

Abstract
The genetic basis of fitness traits has been studied widely in animals, yet the contribution of genetic variation to these traits in humans is controversial. In particular, it is difficult to disentangle genetic versus environmental effects on fertility, because of within-family correlations of sociocultural, economic, and other nongenetic factors that influence family sizes. In this study, we investigated the genetic architecture of reproductive fitness traits in a fertile human population whose communal lifestyle assures uniform and equal access to resources. Our study revealed significant heritabilities for reproductive traits in both men and women, after accounting for common household effects shared among siblings and demographic changes in reproductive practices. Furthermore, our results indicate that both autosomal and X-linked additive and dominance variances contribute to these traits. We therefore propose that reproductive traits should be amenable to genetic mapping studies, and the results we present here will facilitate the search for the novel genes influencing natural fertility in humans.
Keywords: life history traits, human fertility
Reproductive fitness reflects the ability of individuals to pass on their genes to subsequent generations. Fitness traits, also referred to as life-history traits, include measures of fertility and mortality and are complex phenotypes that are direct targets of Darwinian selection. Understanding the genetic basis of variation in these traits and inheritance in animals has long been a central theme in evolutionary biology (1). However, partitioning the observed variation into the genetic and environmental sources, and therefore determining the heritability of these traits, remains challenging in humans. As a result, current theories on the evolution and heritability of fitness, and the empirical data, come largely from animal studies (for examples, see refs. 2–8). However, studies of model organisms suggest that hundreds of genes influence fertility in mammals (9). Standing variation in any of those genes could contribute to interindividual differences in fitness in natural populations.
The difficulty in assessing genetic contributions to human fertility is caused in part by the fact that human family sizes are often deliberately limited, with few populations reaching their true reproductive potential, and because the many nongenetic factors that influence human family size are often shared within families. As a result, disentangling the effects of shared genes from shared environment is often impossible. For example, parent–child correlations in family sizes have been reported for a number of human populations (10–16). However, in nearly all of these studies, the investigators concluded that social or cultural transmission, such as patterns of emigration (10), polygyny and higher male mortality (11), education or marital age (12), or differential access to resources and ability to acquire a mate (15), but not genetic factors, accounted for the observed intergenerational correlations in family size. One exception was a recent study in the Hutterites, which attributed parent–offspring correlation in family sizes to genetic causes (16).
The Hutterites are a young founder population of European descent that are particularly amenable to studies of reproductive fitness. The proscription of contraception and desire for large families, resulted in median completed family sizes (CFSs) >10 and interbirth intervals <2 years in the 1960s (17, 18). Moreover, they practice a communal agrarian lifestyle, which ensures that all members are exposed to a relatively similar environment and have equal access to resources, including wealth, education, and medical care. In an earlier study, intergenerational correlations in family size were measured in 161 three-generation completed Hutterite families (16). Significant correlations between the family size of a couple and that of their sons (r = 0.29; P < 10−6) and their daughters (r = 0.18; P = 0.0041) were reported. Because socio-cultural factors known to influence family sizes are remarkably uniform between the Hutterite families (19), observed correlations were interpreted as evidence for genetic contributions (i.e., heritability) to this trait (16).
Here, we defined three measures of fertility in the extant population to assess different components of a couple’s reproductive fitness (Table 1). These traits include measures of reproductive capacity [(CFS and age at last reproduction (ALR)] and reproductive rate (birth rate). These measures were corrected for age and cohort effects and length of the reproductive period when relevant (see Methods). We also modeled the effects of shared household environment for each trait. The genetic variance for these reproductive fitness measures were formally estimated in Hutterite men and women with proven fertility, who are members of a single 13-generation pedigree (20). The results reported here lay the foundation for future studies to identify novel genes that influence natural fertility and contribute toward theoretical considerations on the evolution of fitness traits.
Table 1.
Definitions and characteristics of three reproductive phenotypes
| Phenotype | Definition | Sample size | Mean ± SD | Range |
| CFS*† | Total number of births (liveborn and stillborn births were included) | 353 | 7.14 ± 3.11 births | 1 to 17 births |
| Birth rate†‡ | Number of births per year of marriage | 459 | 0.53 ± 0.14 births | 0.21 to 1.05 births |
| ALR*† | Age at which the wife had her last child | 353 | 35.07 ± 5.31 years | 22.51 to 47.13 years |
For all phenotypes we counted multiple births as one birth. There were 33 multiple births in our sample (32 twins, 1 triplet), 30 in completed families and 3 in incomplete families.
*Wife’s age at marriage included as a covariate in analyses (mean 22.45, SD 2.62, range 17.57 to 35.15 years).
†Wife’s birth year included as a covariate in analyses (mean 1950, SD 16.12, range 1899 to 1984).
‡Number of years from marriage to last birth included as a covariate in analyses (mean 12.27, SD 5.31, range 0.78 to 25.86 years).
Results
Reproductive Fitness Traits in the Hutterites.
The characteristics of the reproductive phenotypes in ≈450 Hutterite couples are shown in Table 1. In general, there is a wide range of variability in each of the traits. CFSs range between 1 and 17 (Fig. 1) and, not surprisingly, were significantly correlated with the number of years from marriage to last birth (r = 0.87, P < 0.0001; Fig. 2A). Wife’s age at marriage was a significant predictor of CFS and ALR (P < 0.0001), with fewer births and later ALR at later ages at marriage (Fig. 2 B and C). Changes in the reproductive practices over time were also remarkable, with earlier maternal birth years associated with more births, higher rates of reproduction, and later ALRs (P < 0.0001; Fig. 2 D–F). Inclusion of wife’s age at marriage and wife’s birth year as covariates in the multivariate model assured that the residuals of the phenotypes are independent of these demographic variables and pedigree depth (see Methods and Figs. S1 and S2).
Fig. 1.

Family sizes of the Hutterite couples included in this study. Black bars represent the sizes of completed families (n = 353; see Methods for the definition of completed families); gray bars represent the sizes of incomplete families (n = 112).
Fig. 2.
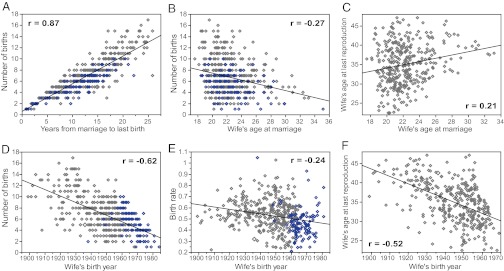
Correlations between fertility traits and their significant covariates (see Table 1 legend). Gray diamonds represent completed families, blue diamonds represent incomplete families. Only traits for which the covariates were significant are shown. Pearson’s correlation coefficient, r, is reported for each plot. (A) Number of years from marriage until last birth was included as a covariate to correct for length of the reproductive period. (B and C) Wife’s age at marriage was included to correct for maternal age effects. (D–F) Wife’s birth year was included to correct for cohort effects (48).
Birth rates are more variable in smaller completed families (≤7 children; Fig. 3A). In larger families, however, higher reproductive rates and less variation are observed. Similarly, birth rates increase with increasing years of marriage (longer reproductive period), particularly for larger family sizes (Fig. 3B). Neither wife’s age at menarche nor birth control use (ever) was a significant predictor of any fertility measure in a subset of 399 and 456 couples, respectively, for whom this information was available, and these covariates were not considered further.
Fig. 3.

Changes in birth rate by CFS (A) and years from marriage to last birth (B) stratified by the CFSs. Green horizontal lines in A show the mean value of the trait.
Correlations between reproductive fitness traits are shown in Fig. 4. CFS was correlated with the other two traits (r > 0.50; P < 0.0001). However, no correlation was observed between birth rate and ALR (r < 0.10; P > 0.05), suggesting that two distinct components of reproductive fitness are captured by these measures: one by the measures of CFS and ALR, which might reflect the reproductive capacity of a couple, and a second by birth rate, which might reflect reproductive success and/or gamete quality.
Fig. 4.

Correlations between the residuals of different fertility traits. Pearson's correlation coefficient, r, is reported for each correlation.
Heritability Estimates of Reproductive Fitness Traits.
We estimated heritabilities by using a variance-component, maximum-likelihood method, developed for large, inbred pedigrees (20, 21), and evaluated models with autosomal additive, autosomal dominance, and X-linked additive variance components, in addition to an environmental variance component that included a shared household effect (see Methods). The full and most parsimonious models for each trait in women and men are shown in Table 2.
Table 2.
Variance component and heritability estimates of the fitness traits in females and males
| Estimate for variance components, SE | Heritability estimates, SE | ||||||||
| Trait | Model | Environment | Additive | Dominance | X-linked additive | hA2 | hX2 | H2 | P value |
| Females | |||||||||
| CFS | E, A, D, X | 4.590 (1.807) | 0.000 (1.161) | 0.565 (2.211) | 1.225 (1.703) | 0.00 (0.18) | 0.20 (0.23) | 0.28 (0.26) | 0.2911 |
| E, X | 5.054 (0.510) | 0.699 (0.430) | 0.22 (0.12) | 0.22 (0.12) | 0.0559 | ||||
| Birth rate | E, A, D, X | 11.665 (3.696) | 0.000 (2.446) | 0.000 (4.524) | 2.218 (1.947) | 0.00 (0.14) | 0.27 (0.19) | 0.27 (0.21) | 0.2089 |
| E, X | 11.670 (1.061) | 2.211 (0.988) | 0.28 (0.10) | 0.28 (0.10) | 0.0330 | ||||
| ALR | E, A, D, X | 15.043 (5.984) | 4.230 (4.056) | 0.000 (7.347) | 0.014 (2.504) | 0.19 (0.21) | 0.05 (0.24) | 0.23 (0.28) | 0.1392 |
| E, A | 15.049 (2.147) | 4.305 (2.212) | 0.23 (0.11) | 0.23 (0.11) | 0.0192 | ||||
| Males | |||||||||
| CFS | E, A, D, X | 1.822 (1.593) | 0.624 (0.849) | 2.783 (2.300) | 0.534 (0.818) | 0.11 (0.14) | 0.09 (0.13) | 0.68 (0.27) | 0.0006 |
| Birth rate | E, A, D, X | 6.512 (3.229) | 1.841 (1.756) | 4.724 (4.595) | 1.075 (1.606) | 0.13 (0.12) | 0.08 (0.11) | 0.54 (0.23) | 0.0211 |
| ALR | E, A, D, X | 12.932 (4.888) | 6.407 (3.005) | 0.000 (6.703) | 0.000 (1.062) | 0.34 (0.14) | 0.00 (0.10) | 0.34 (0.24) | 0.0009 |
| E, A | 12.933 (2.044) | 6.407 (2.421) | 0.34 (0.11) | 0.34 (0.11) | 0.0001 | ||||
For each trait, a full model, in which all the variance components were tested simultaneously, are shown first; followed by the most parsimonious model (if different from the full model) that captures the total genetic variance with the fewest variance components. P values are obtained by χ2 likelihood ratio test against the model that includes environmental variance only. E, environmental; A, autosomal additive; D, dominance; X, X-linked additive variance components; h2A, narrow heritability caused autosomal additive effects; h2X, narrow heritability caused by X-linked additive effects; H2, broad heritability.
CFS.
In women, a model including X-linked additive and environmental variance is favored the most [based on the Akaike Information Criterion (AIC) score and likelihood ratio test], but was only borderline significant compared with a model including environmental variance only (P = 0.056), yielding narrow and broad heritabilities of 0.22. Inclusion of other variance components in the model (autosomal additive, dominance and shared household) did not contribute significantly to heritability of this trait and was not favored statistically. In men, however, there was significant heritability caused by both autosomal and X-linked additive and dominance variances (P = 0.0006), yielding a narrow heritability (h2A + h2x) of 0.20 and broad heritability of 0.68. To address the possibility that the observed dominance effect is caused by the shared household among brothers, we also evaluated a model that includes a shared household variance component in addition to a dominance variance component. The contribution of shared household was not significant in the presence of dominance variance.
Birth rate.
Similar to the results of CFS, X-linked additive is the main source of genetic variance for birth rate in women, yielding narrow and broad heritabilities of 0.28 (P = 0.033). In men, however, a model including all three genetic variance components was favored (P = 0.021), giving a total narrow heritability (h2A + h2x) of 0.21 and broad heritability of 0.54. Inclusion of a shared household effect reduced the estimate for the dominance variance slightly; however, this did not result in improvement in the overall heritability model (based on the AIC score and likelihood ratio test).
ALR.
In both women and men, autosomal additive variance accounted for all of the genetic variance of this phenotype, with narrow and broad heritabilities of 0.23 in women (P = 0.019), and 0.34 in men (P = 0.0001).
Discussion
Reproductive fitness traits are complex phenotypes influenced by environmental and genetic factors and have been studied extensively in both animal and human populations (2–8, 22). Despite this fact the extent to which these traits are shaped by genetic forces (or the nature of this action) in humans remains controversial (e.g., refs. 1 and 23), mainly because of the difficulties in disentangling the effects of shared social and environmental factors from shared genes within human families, and in assessing the true reproductive potential of the individuals. We demonstrate here in a human population with equal access to resources, shared cultural practices, and among the highest fertility rates ever recorded (18), that both autosomal and X-linked additive variances and autosomal dominance variance contribute to the genetic architecture of reproductive fitness traits.
All of the traits considered in this study had significant narrow and broad heritabilities in both women and men. In women, birth rate had a significant X-linked additive variance, whereas ALR had a significant autosomal additive component (Table 2), consistent with the fact that ALR and birth rate are not themselves correlated (r = 0.03; Fig. 4) and further suggesting that they measure different components of reproductive fitness. CFS in women, however, was only marginally heritable, with possible X-linked additive variance. The smaller heritability estimate for CFS indicates a larger role for nongenetic factors in determining family size in women compared with either the rate of reproduction or the women’s ALR. This finding can be interpreted in the context of Price and Schluter’s argument (8), which posits that complex phenotypes are composite traits determined by multiple phenotypes with less complex architecture. In this example, birth rate and ALR can be considered components of the composite traits of CFS. The heritability of CFS would therefore include all of the environmental variances affecting their individual components and additional environmental variation, resulting in an overall greater proportion of environmental variance, and thus, smaller heritability, contributing to the composite traits (8). In this respect, birth rate and ALR can be viewed as independent fitness components contributing to family size, and the smaller heritability of CFS might be the result of the cumulative and increased role of environmental variances in this trait in women. The implication of X chromosome genes for birth rate and possibly for CFS is particularly intriguing, given that the X chromosome is enriched for genes associated with sexual development and reproduction (24). In addition, determinants of ovarian function map to the X chromosome, including genes for folliculogenesis, premature ovarian failure, and infertility (for example, see refs. 25 and 26).
However, at least one variance component contributes significantly to all male fitness traits (Table 2). The heritability of ALR was caused exclusively by autosomal additive variance, whereas both autosomal and X-linked additive and dominance variances contribute to genetic architecture of CFS and birth rate. It was surprising to us that the wife’s ALR, which is highly correlated with the husband’s ALR (r = 0.98), was heritable in men. Although declines in sperm quality with age have been reported (27), this decline has usually been attributed to environmental causes, such as prenatal or postnatal exposures to hormones and chemical compounds (refs. 28 and 29 and references therein), and not generally to genetic factors. Our results suggest that genetic factors directly contribute to the age-related decline in sperm quality in men, or they determine sensitivity to environmental exposures that affect sperm quality.
It is challenging to partition the total genetic variance between variance components, because the effects captured by one model might possibly be confounded by another. In particular, one could expect that the power to distinguish the effects of autosomal and X-linked additive genetic variances in females may be low, because of their similar inheritance patterns. Likewise, shared household effects might mimic dominance variance, because dominance effects are largely driven by correlation among siblings. Nonetheless, the unusually large Hutterite pedigree structure, and inclusion of all pairs of individuals who are related to each other through multiple lines of descent, allows us to estimate these effects simultaneously. In particular, the closed nature of the Hutterite population and the small number of founding genomes result in a nonzero probability of any two individuals sharing both of their alleles identical by descent (IBD) (30), a situation that would not be expected in many human populations. For example, among the 107,880 pairwise relationships between the 465 wives included in this study, there are 313 sib pairs and 107,567 nonsib pairs with dominance variance coefficients >0. Likewise, for 465 husbands, there are 493 sib pairs and 106,611 nonsib pairs with dominance variance coefficients >0. The sheer number of nonsib relatives, each contributing a small effect, allows us to differentiate between dominance versus (nongenetic) household effects. Indeed, if these two variance components were estimating the same effect, the variance would be shared between them, and varying the initial values for the maximum-likelihood procedure would alter the distributions of the variance estimates between these components. However, this was not the case; multiple iterations of maximum likelihood with different starting points all converged to the same estimates in our dataset. Therefore, the unique Hutterite pedigree structure and the known relationships between all individuals enabled us to separate effects caused by autosomal and X-linked sources (as in female birth rate vs. ALR) and caused by dominance and shared household (as in male CFS and birth rate). However, precise quantification of the relative contributions of all variance components to the overall phenotypic variance of these traits remains challenging, because the increased number of parameters (hence, degrees of freedom) in these tests results in larger estimates of the standard errors and reduces the power to detect significant effects when all of the possible components are included in the model simultaneously.
It is noteworthy that males have overall higher heritability for reproductive fitness traits than females. This finding is also consistent with results of our earlier study in the Hutterites, in which the correlation between family sizes of a couple and their sons was higher and more significant than the correlation between family sizes of a couple and their daughters (16). This result may be caused by the overall larger number of genes involved in male compared with female reproductive processes (31) and, therefore, their combined effects may account for more of the observed phenotypic variation between the males. Alternatively, environmental factors affecting female fitness likely differ from those affecting male fitness, which might result in larger proportions of the total variance attributed to environmental variance in women (32). In addition, the effects of genetic models other than those considered here may contribute to variation in fitness. In particular, our analyses focused on male-specific and female-specific traits. We did not simultaneously consider partner effects, although parental combinations of some genes, such as HLA, are known to influence reproductive outcomes this population (33). It is possible, even likely, that parental combination of other genes also contribute to reproductive fitness in this population.
The results we report here are also consistent with previous studies and evolutionary predictions in several respects. First, the narrow heritabilities we estimated for our reproductive fitness traits compare well with those derived from studies of wild animal populations (e.g., refs. 7 and 32) and preindustrial humans (22). For example, narrow heritabilities for fitness traits estimated in various animal populations are low, ranging between 0 and 0.30 (7, 32). Pettay et al. (22) studied fitness traits in preindustrial Finns and were able to show significant narrow heritabilities in women (h2 = 0.18 − 0.76) for traits similar to those considered in this study, although they did not estimate dominance or X-linked variance components. However, their heritability estimations were higher and more significant for female traits compared with male traits. Such differences, however, are not necessarily unexpected given that the Pettay study was conducted in individuals living in “premodern” conditions; whereas the Hutterites in our study enjoy a modern lifestyle, including access to 20th- and 21st-century health care, and heritability estimates for the same traits are expected to differ in different environments. Nevertheless, both studies suggest the presence of significant heritabilities of reproductive fitness traits. Second, traits closely associated with fitness are expected to exhibit lower narrow heritabilities than morphological and physiological traits [a common interpretation of Fisher’s fundamental theorem of natural selection (34)], and this prediction has been supported by numerous comparative studies of heritability estimates in animals (3, 7, 35). Even though it is beyond the scope of this study to compare the heritabilities of fitness versus nonfitness traits, we observed that the narrow heritabilities for the reproductive fitness traits considered here (mean h2 = 0.25, range 0.20 to 0.34) are generally lower than the narrow heritabilities we previously reported for 20 quantitative physiological and anthropometric traits (also with significant genetic variance components) in the same population (mean h2 = 0.47, range 0.16 to 0.81) (21). Last, our results also support theories that argue for significant contributions of nonadditive genetic factors, especially dominance variance, in the overall genetic architecture of fitness traits (e.g., refs. 2 and 23), as observed in male CFS and birth rate. Thus, these results are consistent with those of Crnokrak and Roff (2) that showed the presence of significant dominance components for fitness traits studied in wild animal species. Our study further supports a role for dominance variance in the genetic architecture of fitness traits in humans and suggests that ignoring nonadditive genetic variance components may lead to significant underestimates of the total heritability for fitness traits in natural populations.
The effects of a founder event and inbreeding on shaping the genetic variance are also a subject of debate. Goodnight (36) argues that founder effects may result in conversion of nonadditive (i.e., epistatic) variance into additive variance. We do not know the extent to which epistatic interactions affects our phenotypes; however, we think it is unlikely to be the case because estimates of heritabilities for ≥20 physiological and anthropometric traits in the Hutterites are quite similar to estimations for those same traits in other populations (21, 30, 37, 38). If there was an inflation of the additive genetic variance component caused by the Hutterite founding event, it should affect traits broadly and not be limited to reproductive traits. However, one could argue that because inbreeding increases the frequency of homozygosity for recessive alleles and, hence, the variation caused by these genes (39), our estimates of dominance variance in the Hutterites could be inflated. However, heritability estimates of nonreproductive traits in the Hutterites showed significant contributions of additive variance to most, and dominance variance to only a few, of those traits (21, 30, 37, 38). Therefore, we do not think that a systematic bias caused by either a founder effect or inbreeding exists in this sample and that the presence of dominance variance in the Hutterites represents true nonadditive genetic effects on reproductive fitness traits. Last, the Hutterite communal lifestyle results in a remarkably uniform environment, particularly with regard to sociocultural factors that affect family sizes, which likely maximizes the effects of genetic variance on phenotypic variance in this population.
However, how genetic variation that influences human fertility is maintained in a population over generations is an intriguing question. It could be caused by pleiotropic effects of the contributing genes, if an allele, or tightly linked variation that is beneficial for reproduction has detrimental effects on other physiological processes or at different stages of the lifecycle. Such fitness tradeoffs are similar to those proposed in Williams’ antagonistic pleiotropy hypothesis (40). Alternatively, there may be many genes influencing fertility, each with small effects and individually contributing very little to overall fitness. In that case, selection acting on individual genes may be too weak to drive these alleles to fixation or elimination.
In summary, the correlations in reproductive fitness traits revealed by this study reflect an underlying genetic architecture of male and female fertility and indicate that these traits should be amenable to genetic mapping studies to identify novel genes influencing natural variation in reproductive fitness. As specific fertility genes are identified, and their functions are elucidated, it may be possible to directly examine how genetic diversity has shaped variation in human fitness traits. Furthermore, we suggest that more severe mutations in genes associated with normal variation in fertility may also account for some proportion of infertility, which is present in ≈10% of the general population (41).
Methods
Subjects.
The Hutterites are a young founder population who originated in the South Tyrol in the 16th century (19, 42). In the 1870s, ≈900 Hutterites migrated from Europe to the United States (19, 42), and today their >40,000 descendants live on communal farms (called colonies) in the northern United States and western Canada. The subjects of this study are 525 Hutterite couples living in South Dakota, all of whom can be traced back to 62 ancestors who were born in the early 1700s to 1800s (43). The Hutterites in our studies are related to each other through multiple lines of descent in a 13-generation pedigree consisting of 3,028 individuals (20). The mean pedigree depth was 7.60 ± 0.62 generations for the husbands and 7.68 ± 0.62 generations for the wives in our study.
The mean inbreeding coefficient of these individuals is 0.034 (SD 0.015), approximately equivalent to that of first cousins once removed (1½ cousins). Despite this high level of inbreeding, the Hutterites are among the most fertile human populations with relatively few (≈2%) childless couples and small interbirth intervals (18). Moreover, the Hutterites’ communal agrarian lifestyle ensures that all individuals have similar environmental exposures and equal access to resources. In particular, the limited use of contraception and uniform desire for large families result in large sibships (e.g., see Fig. 1). Last, the Hutterites are strictly monogamous, although second (or third) marriages occur after the death of a spouse. These unique features make the Hutterites ideally suited for genetic studies of fertility, because their family sizes and rates of conception may reveal the true human reproductive potential (18).
Sample Composition.
We obtained birth, death, and marriage dates from records compiled by the Hutterite ministers. In addition, reproductive history interviews were conducted in person by C.O. with 525 ever married women during field trips to Hutterite colonies between 1982 and 2007 (33, 44, 45). All births were updated to at least 2002 for these women. These interviews elicited information on births, miscarriages (approximate dates and gestational ages), infertility (>1 year inability to conceive or use of infertility treatment), birth control use (type, dates, and duration), ages at menarche and last menses, surgical sterilization, medication use, and maternal illnesses that could affect fertility. Of the 525 interviewed couples, 60 couples were excluded from this study for one of the following reasons: the couple was childless or conceived after treatment for infertility (n = 20), conception before marriage (the first child was born before or within 28 weeks after the marriage; n = 30), medical conditions in the wife could have limited her fertility (Rh incompatibility, severe arthritis, severe depression, ovarian cancer, and ovariectomy; n = 7), or incomplete information for the couple (n = 3). The remaining 465 couples were considered for the analyses of male and female reproductive traits.
The wives represented 267 full sibships and one half sibship (sisters having the same father but different mother); the husbands represented 212 full sibships and one half sibship (brothers having the same father but different mother). Three wives and seven husbands included in this study reported a second marriage. However, in six of these cases (two women and four men), the subjects had completed their families (see below) in their first marriage and did not have any children with their second spouses. In those cases, only the first marriages were considered. One woman had children in two marriages. Only the data on her first marriage were used, but her family size was considered incomplete. For the remaining three men, reproductive history interviews were available for their second wives only; therefore only the data on their second marriages were used, but these three men were excluded from the analyses of CFS. Because our studies in the Hutterites are population-based and participation within each colony was high (>95%), there are no known ascertainment biases that could affect the interpretation of our results.
Measures of Reproductive Fitness.
The definitions of the reproductive fitness measures considered in this study are shown in Table 1. We defined families as “completed” if either the wife was >45 years of age and was not widowed before then, or the couple had not had a child in >6 years (n = 353). For birth rate, we first determined total interbirth interval for each couple having two or more children. Birth rate is then calculated as [(the number of births − 1)/(total interbirth intervals)]. Six couples had only one child at the time of the analysis and were therefore excluded from the analyses of birth rate.
For all fitness traits, we fit a multivariate linear regression model and included as covariates the wife’s age at marriage to correct the maternal age effects (Fig. 2 B and C) and wife’s birth year to correct for the demographic changes in reproductive behaviors (Fig. 2 D–F) and pedigree depth (Fig. S2). Because there is a high correlation between the wife’s age and husband’s age in our sample (r = 0.98), we used only the wife’s age in our analyses of both male and female fertility. In addition to these two covariates, number of years from marriage to last birth was also included for the analyses of birth rate to correct for the length of the reproductive period. Residuals of all of the traits were normally distributed.
Estimating the Heritability of the Reproductive Fitness Traits.
We considered male and female fertility separately because of the prior expectation that different biological processes influence natural variation in fertility between the sexes (31). Furthermore, because the wife in each couple has different degrees of relatedness to all other Hutterites than the husband of each couple, the heritabilities can be estimated independently for males and females.
Heritabilities were estimated by using the 3,028-person Hutterite pedigree, using a variance component, maximum-likelihood method, as described (20). Briefly, we modeled each phenotype as a multivariate normal, with mean Xβ and covariance Σ, where X is a matrix of covariates and β is a vector of effect sizes. The matrix Σ is given by Σ = 2Φaσa2 + Δσd2 + 2Φxσx2 + Hσs2 + Iσe2, where Φa and Φx are the autosomal and X-linked kinship coefficient matrices, respectively, Δ is the probability of individuals sharing two alleles IBD, and H and I are the shared household and identity matrices, respectively. Environmental and “shared household” variance components were considered for modeling the nongenetic effects; autosomal additive, autosomal dominance, and X-linked additive variance components were considered for modeling the genetic effects. Estimations of variance component parameters for the genetic effects are explained in detail elsewhere (20, 21). To estimate shared household effects, we created a matrix such that full and half-sib pairs were scored as 1, and all other pairs were scored as 0. We considered full and half-sibs equivalent for the purpose of this analysis because full sibs and half sibs are raised in the same household. There was only one family with half sibs in our study.
For each fertility trait, we fit environmental, autosomal additive, X-linked additive, and dominance variance components simultaneously. The traits for which the dominance variance was significant were also evaluated with models that included a shared household variance component. In addition, we evaluated reduced models for each trait, by excluding the nonsignificant variance components from the model, to obtain a more precise estimate of the significant components. Different variance component models were compared based on their AIC and Bayesian Information Criterion scores (46, 47), and the model that captured the most variance with fewest variance components was reported as the most “parsimonious” model (Table 2). Autosomal and X-linked narrow heritabilities (hA2, hx2) were calculated for all models as hA2 = (1 + fa)VA/VT and hx2= (1 + fx)VX/VT, where f is the autosomal or X-linked average inbreeding coefficient of the population, and VA, VX and VT are the autosomal additive, X-linked additive and total phenotypic variances, respectively. Last, broad heritabilities (H2) were calculated as H2 = 1 − [(VE + VS)/VT], where VS is the variance caused by shared household effect, when included. P values were calculated by χ2 likelihood ratio test against the model including environmental variance only. Using this method previously with >20 quantitative traits, we have shown that heritability estimates for anthropometric and physiologic phenotypes in the Hutterites are similar to estimates in other populations (21, 30, 37, 38).
Acknowledgments
We thank Rebecca Anderson, Jessica Chong, Gaixin Du, Josef Jurek, Lin Pan, and Ying Sun for technical assistance and the Hutterites for their participation. This work was supported by National Institutes of Health Grants HD21244 to C.O. and HG02899 to M.A.
Footnotes
This paper results from the Arthur M. Sackler Colloquium of the National Academy of Sciences, “Evolution in Health and Medicine” held April 2–3, 2009, at the National Academy of Sciences in Washington, DC. The complete program and audio files of most presentations are available on the NAS web site at www.nasonline.org/Sackler_Evolution_Health_Medicine.
The authors declare no conflict of interest.
This article is a PNAS Direct Submission. D.R.G. is a guest editor invited by the Editorial Board.
This article contains supporting information online at www.pnas.org/cgi/content/full/0906196106/DCSupplemental.
References
- 1.Ellegren H, Sheldon BC. Genetic basis of fitness differences in natural populations. Nature. 2008;452:169–175. doi: 10.1038/nature06737. [DOI] [PubMed] [Google Scholar]
- 2.Crnokrak P, Roff DA. Dominance variance: Associations with selection and fitness. Heredity. 1995;75:530–540. [Google Scholar]
- 3.Houle D. Comparing evolvability and variability of quantitative traits. Genetics. 1992;130:195–204. doi: 10.1093/genetics/130.1.195. [DOI] [PMC free article] [PubMed] [Google Scholar]
- 4.Kruuk LE, et al. Heritability of fitness in a wild mammal population. Proc Natl Acad Sci USA. 2000;97:698–703. doi: 10.1073/pnas.97.2.698. [DOI] [PMC free article] [PubMed] [Google Scholar]
- 5.McCleery RH, et al. Components of variance underlying fitness in a natural population of the great tit Parus major. Am Nat. 2004;164:E62–E72. doi: 10.1086/422660. [DOI] [PubMed] [Google Scholar]
- 6.Merila J, Sheldon BC. Lifetime reproductive success and heritability in nature. Am Nat. 2000;155:301–310. doi: 10.1086/303330. [DOI] [PubMed] [Google Scholar]
- 7.Mousseau TA, Roff DA. Natural selection and the heritability of fitness components. Heredity. 1987;59:181–197. doi: 10.1038/hdy.1987.113. [DOI] [PubMed] [Google Scholar]
- 8.Price T, Schluter D. On the low heritability of life-history traits. Evolution (Kans) 1991;45:853–856. doi: 10.1111/j.1558-5646.1991.tb04354.x. [DOI] [PubMed] [Google Scholar]
- 9.Matzuk MM, Lamb DJ. Genetic dissection of mammalian fertility pathways. Nat Cell Biol. 2002;4(Suppl):S41–49. doi: 10.1038/ncb-nm-fertilityS41. [DOI] [PubMed] [Google Scholar]
- 10.Austerlitz F, Heyer E. Social transmission of reproductive behavior increases frequency of inherited disorders in a young-expanding population. Proc Natl Acad Sci USA. 1998;95:15140–15144. doi: 10.1073/pnas.95.25.15140. [DOI] [PMC free article] [PubMed] [Google Scholar]
- 11.Helgason A, et al. A populationwide coalescent analysis of Icelandic matrilineal and patrilineal genealogies: Evidence for a faster evolutionary rate of mtDNA lineages than Y chromosomes. Am J Hum Genet. 2003;72:1370–1388. doi: 10.1086/375453. [DOI] [PMC free article] [PubMed] [Google Scholar]
- 12.Imaizumi Y, Nei M, Furusho T. Variability and heritability of human fertility. Ann Hum Genet. 1970;33:251–259. doi: 10.1111/j.1469-1809.1970.tb01650.x. [DOI] [PubMed] [Google Scholar]
- 13.Neel JV. Lessons from a “primitive” people. Science. 1970;170:815–822. doi: 10.1126/science.170.3960.815. [DOI] [PubMed] [Google Scholar]
- 14.Pearson KAL, Bramley-Moore L. On the inheritance of fertility in mankind. Philos Trans R Soc London Ser B. 1899;192:282–330. [Google Scholar]
- 15.Madrigal L, Relethford JH, Crawford MH. Heritability and anthropometric influences on human fertility. Am J Hum Biol. 2003;15:16–22. doi: 10.1002/ajhb.10109. [DOI] [PubMed] [Google Scholar]
- 16.Pluzhnikov A, et al. Correlation of intergenerational family sizes suggests a genetic component of reproductive fitness. Am J Hum Genet. 2007;81:165–169. doi: 10.1086/518446. [DOI] [PMC free article] [PubMed] [Google Scholar]
- 17.Mange AP. Growth and inbreeding of a human isolate. Hum Biol. 1964;36:104–133. [PubMed] [Google Scholar]
- 18.Sheps MC. An analysis of reproductive patterns in an American isolate. Popul Stud. 1965;19:65–80. [Google Scholar]
- 19.Hostetler J. Hutterite Society. Baltimore: John Hopkins Univ Press; 1974. [Google Scholar]
- 20.Abney M, McPeek MS, Ober C. Estimation of variance components of quantitative traits in inbred populations. Am J Hum Genet. 2000;66:629–650. doi: 10.1086/302759. [DOI] [PMC free article] [PubMed] [Google Scholar]
- 21.Pan L, Ober C, Abney M. Heritability estimation of sex-specific effects on human quantitative traits. Genet Epidemiol. 2007;31:338–347. doi: 10.1002/gepi.20214. [DOI] [PubMed] [Google Scholar]
- 22.Pettay JE, et al. Heritability and genetic constraints of life-history trait evolution in preindustrial humans. Proc Natl Acad Sci USA. 2005;102:2838–2843. doi: 10.1073/pnas.0406709102. [DOI] [PMC free article] [PubMed] [Google Scholar]
- 23.Merila J, Sheldon BC. Genetic architecture of fitness and nonfitness traits: Empirical patterns and development of ideas. Heredity. 1999;83:103–109. doi: 10.1046/j.1365-2540.1999.00585.x. [DOI] [PubMed] [Google Scholar]
- 24.Saifi GM, Chandra HS. An apparent excess of sex- and reproduction-related genes on the human X chromosome. Proc Biol Sci. 1999;266:203–209. doi: 10.1098/rspb.1999.0623. [DOI] [PMC free article] [PubMed] [Google Scholar]
- 25.Toniolo D, Rizzolio F. X chromosome and ovarian failure. Semin Reprod Med. 2007;25:264–271. doi: 10.1055/s-2007-980220. [DOI] [PubMed] [Google Scholar]
- 26.Vaiman D. Fertility, sex determination, and the X chromosome. Cytogenet Genome Res. 2002;99:224–228. doi: 10.1159/000071597. [DOI] [PubMed] [Google Scholar]
- 27.Kidd SA, Eskenazi B, Wyrobek AJ. Effects of male age on semen quality and fertility: A review of the literature. Fertil Steril. 2001;75:237–248. doi: 10.1016/s0015-0282(00)01679-4. [DOI] [PubMed] [Google Scholar]
- 28.Carlsen E, et al. Evidence for decreasing quality of semen during past 50 years. Br Med J. 1992;305:609–613. doi: 10.1136/bmj.305.6854.609. [DOI] [PMC free article] [PubMed] [Google Scholar]
- 29.Swan SH, Elkin EP, Fenster L. Have sperm densities declined? A reanalysis of global trend data. Environ Health Perspect. 1997;105:1228–1232. doi: 10.1289/ehp.971051228. [DOI] [PMC free article] [PubMed] [Google Scholar]
- 30.Abney M, McPeek MS, Ober C. Broad and narrow heritabilities of quantitative traits in a founder population. Am J Hum Genet. 2001;68:1302–1307. doi: 10.1086/320112. [DOI] [PMC free article] [PubMed] [Google Scholar]
- 31.Torgerson DG, Whitty BR, Singh RS. Sex-specific functional specialization and the evolutionary rates of essential fertility genes. J Mol Evol. 2005;61:650–658. doi: 10.1007/s00239-005-0007-5. [DOI] [PubMed] [Google Scholar]
- 32.Visscher PM, Hill WG, Wray NR. Heritability in the genomics era: Concepts and misconceptions. Nat Rev Genet. 2008;9:255–266. doi: 10.1038/nrg2322. [DOI] [PubMed] [Google Scholar]
- 33.Ober C, et al. Human leukocyte antigen matching and fetal loss: Results of a 10-year prospective study. Hum Reprod. 1998;13:33–38. doi: 10.1093/humrep/13.1.33. [DOI] [PubMed] [Google Scholar]
- 34.Fisher RA. The Genetical Theory of Natural Selection. Oxford: Clarendon; 1930. [Google Scholar]
- 35.Gustafsson L. Lifetime reproductive success and heritabilities: Empirical suport for Fisher’s fundamental theorem. Am Nat. 1986;128:761–764. [Google Scholar]
- 36.Goodnight CJ. Epistasis and the effect of founder events on the additive genetic variance. Evolution (Lawrence, Kans) 1988;42:441–454. doi: 10.1111/j.1558-5646.1988.tb04151.x. [DOI] [PubMed] [Google Scholar]
- 37.Ober C, Abney M, McPeek MS. The genetic dissection of complex traits in a founder population. Am J Hum Genet. 2001;69:1068–1079. doi: 10.1086/324025. [DOI] [PMC free article] [PubMed] [Google Scholar]
- 38.Weiss LA, et al. The sex-specific genetic architecture of quantitative traits in humans. Nat Genet. 2006;38:218–222. doi: 10.1038/ng1726. [DOI] [PubMed] [Google Scholar]
- 39.Falconer DS, Mackay TFC. Introduction to Quantitative Genetics. 4th ed. New York: Longman; 1996. [Google Scholar]
- 40.Williams GC. Pleiotropy, natural selection, and the evolution of senescence. Evolution (Lawrence, Kans) 1957;11:398–411. [Google Scholar]
- 41.Behrman SJ, Kistner RN. Progress in Infertility. 2nd Ed. Boston: Little, Brown & Co.; 1975. [Google Scholar]
- 42.Steinberg AG, et al. Genetic studies in an inbred human isolate. In: Crow JF, Neel JV, editors. Proceedings of the Third International Congress of Human Genetics. Baltimore: Johns Hopkins Univ Press; 1967. pp. 267–290. [Google Scholar]
- 43.Ober C, et al. HLA and mate choice in humans. Am J Hum Genet. 1997;61:497–504. doi: 10.1086/515511. [DOI] [PMC free article] [PubMed] [Google Scholar]
- 44.Ober C, et al. Variation in the HLA-G promoter region influences miscarriage rates. Am J Hum Genet. 2003;72:1425–1435. doi: 10.1086/375501. [DOI] [PMC free article] [PubMed] [Google Scholar]
- 45.Ober C, et al. Decreased fecundability in Hutterite couples sharing HLA-DR. Am J Hum Genet. 1992;50:6–14. [PMC free article] [PubMed] [Google Scholar]
- 46.Akaike H. A new look at the statistical model identification. IEEE Trans Automatic Control. 1974;19:716–723. [Google Scholar]
- 47.Schwartz G. Estimating the dimension of a model. Ann Stat. 1978;6:461–464. [Google Scholar]
- 48.Ober C, Hyslop T, Hauck WW. Inbreeding effects on fertility in humans: Evidence for reproductive compensation. Am J Hum Genet. 1999;64:225–231. doi: 10.1086/302198. [DOI] [PMC free article] [PubMed] [Google Scholar]