

Abstract
A model is investigated in which mutations that affect a complex trait (e.g., heart disease) also affect fitness because the trait is a component of fitness or because the mutations have pleiotropic effects on fitness. The model predicts that the genetic variance, and hence the heritability, in the trait is contributed by mutations at low frequency in the population, unless the mean strength of selection of mutations that affect the trait is very small or weakly selected mutations tend to contribute disproportionately to the trait compared with strongly selected mutations. Furthermore, it is shown that each rare mutation tends to contribute more to the variance than each common mutation. These results may explain why most genome-wide association studies have failed to find associations that explain much of the variance. It is also shown that most of the variance in fitness contributed by new nonsynonymous mutations is caused by mutations at very low frequency in the population. This implies that most low-frequency SNPs, which are observed in current resequencing studies of, for example, 100 chromosomes, probably have little impact on the variance in fitness or traits. Finally, it is shown that the variance contributed by a category of mutations (e.g., coding or regulatory) depends largely upon the mean strength of selection; this has implications for understanding which types of mutations are likely to be responsible for the variance in fitness and inherited disease.
Keywords: disease, evolution
Most biological traits, and many of the characters that are of most interest to humans, are complex, or quantitative, in nature; they are determined by many mutations in multiple loci. These traits include diseases such as heart disease, type II diabetes, and schizophrenia, but also traits of commercial and biological interest such as milk yield and clutch size.
Because of the great health and commercial implications, there has been considerable interest in finding the mutations and genes involved in complex traits, particularly those involved in human disease, both to aid in predicting risk and to further understand the genetic basis of disease. This project has advanced rapidly in humans in the past few years with the help of the HAPMAP project (1, 2) and genome-wide association studies (3). By the end of December 2008, more than 300 associations had been reported in more than 70 common diseases (4). Unfortunately, although these studies have successfully identified many mutations associated with a variety diseases and traits, these associations explain very little of the variance in each trait (5–8). A good example is human height; three separate studies involving approximately 63,000 individuals have identified 54 markers associated with height, but, all told, these explain less than 10% of the variation in human height, a trait that has a heritability of 80% (9–11).
A number of different explanations have been proffered as to why the associations discovered by genome-wide association studies explain so little of the variance; these have included epistasis, epigenetics, incomplete association, and structural variation (6, 8). It has also been suggested that rare variants with large or moderate effects might contribute much of the variance, and that such mutations might be rare because they have deleterious fitness effects (8, 12, 13). As pleiotropy appears to be very common (14), mutations that affect a trait may be subject to selection, either because the trait is a component of fitness or because the mutations have pleiotropic effects on fitness. As a consequence, mutations with large effects on the trait may be kept at low frequency because of their deleterious effects on fitness (8, 12, 13). Here I explore a pleiotropic model in which mutations affect both fitness and a trait (15, 16).
Let us consider a population of diploid organisms under a Fisher-Wright model with stationary population size. We will assume that mutations are semidominant and that mutations affect both fitness and some trait of interest, such as body size; we assume that the trait is not subject to selection directly unless the trait is fitness itself. Let us assume that all mutations are deleterious, although some may be sufficiently weakly selected to be effectively neutral; let the fitnesses of the three genotypes be 1, 1-s and 1–2s and the effects of the mutations on the trait be 0, z, and 2z. Let z and s be related to each other by the following model:
where S = 4Nes, ε is normally distributed with a mean of zero and an SD of σ, and δ randomly takes a value of +1 or −1 with equal probability. Examples of the relationship are given in Fig. 1. The δ parameter transforms the distribution of effects such that mutations have equal probabilities of increasing or decreasing the trait, unless the trait is fitness, in which case δ is +1. The strength of association between the effects of mutations on the trait and fitness is dependent upon two parameters, σ and τ. As σ becomes larger, so the dependency decreases. However, this parameter turns out to be unimportant in terms of how the variance in the trait is distributed with respect to allele frequency (as discussed later). In contrast, τ is important; it measures how the SD in the trait, or equivalently the mean absolute effect of a mutation on the trait, increases with the strength of selection. If τ is 1, this increase is linear; so a mutation that has a 10 fold larger effect on fitness will also, on average, have a 10 fold larger effect on the trait. If τ is 0, the effects of a mutation on trait and fitness are independent.
Fig. 1.

The relationship between trait and fitness, assuming the distribution of fitness is a Γ-distribution (β = 0.20 and  = 3,000) for different values of t and σ.
We assume that S is Γ-distributed:
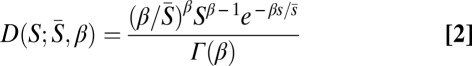 |
where β is the shape parameter and is the mean strength of selection.
If we assume free recombination and that the effects of mutations combine additively, then we can write down an expression for the additive genetic variance contributed by mutations as a function of their frequency in the population, x, as:
 |
where  is the distribution of ε,
 |
and
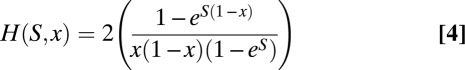
H(S,x) is the time that a new mutation of selective strength S spends at a frequency x (17) and U(z,x) is the variance in the trait contributed by a mutation of effect z at frequency x. Eq. 3 takes into account mutation, selection, and genetic drift. It can solved to yield the following:
 |
where Zeta is the Hurwitz Zeta function and θ is 4Neu. It is useful to know, for plotting Eq. 6, the density of the variance as a function of log10 of the allele frequency; this is  , where y is log10(x) and v is loge(10).
The total additive genetic variance in the trait is:
 |
which simplifies to:
 |
It is evident on inspection of Eqs. 6 and 7 that V(x) / VT is independent of θ and σ. A Mathematica notebook of these equations is available from the author’s Web site (www.lifesci.susx.ac.uk/home/Adam_Eyre-Walker/).
Results
In our model we assume that mutations have effects on both fitness and a trait of interest, such as the chance of developing diabetes. The effects of the mutation on fitness and the trait are correlated, and this correlation can vary from very strong, when the trait is fitness, to very weak, when the effects are independent of one another. Let us start by considering the case in which the trait is fitness itself (i.e., δ = +1, τ = 1, and σ = 0), and as a starting point let us consider the distribution of fitness effects (DFE) to be that inferred for new amino acid mutations in humans [β = 0.20, = 3000 (18); see also refs. 19 and 20]. It is apparent that, under this distribution, the vast majority of the variance, and hence heritability, in fitness is contributed by mutations that are very rare in the population; 96% of the variance is contributed by mutations that are at a frequency of less than 0.001 (Fig. 2). This pattern depends little on the shape of the distribution (Fig. S1), although more of the variance tends to be contributed by mutations at high frequencies when the distribution is less leptokurtic (i.e., higher values of β). However, the relationship between the variance and allele frequency does depend strongly upon the mean strength of selection; the lower the mean fitness, the more of the variance is contributed by mutations at relatively high frequencies in the population (Fig. 2). Nevertheless, even if the mean Nes is just 10, we expect 95% of the additive variance to be contributed by mutations at less than 5% in the population and 73% to be contributed by mutations at less than 1%.
Fig. 2.

The density of variance, V(x) / VT, in the trait as a function of allele frequency when the trait is fitness for different mean strengths of selection when β is 0.20.
It is therefore apparent that the majority of the variance in fitness tends to be contributed by mutations that are rare in the population unless the mean strength of selection is small. This is a simple consequence of two facts: mutations with large effect tend to contribute disproportionately to the variance, and mutations that have large effect are rare because natural selection is effective at minimizing their frequency in the population. Some insight into this can be gained from simple population genetics. The variance contributed by a mutation of selective strength s at a frequency x in the population is 2x(1 − x)s2. If the mutation is deleterious, it will be rare, so the variance is approximately 2xs2. At equilibrium, the mean frequency of such a mutation in the population is approximately u/s, so the variance contributed by such mutations is 2us. The variance therefore depends upon the mutation rate and the strength of selection; hence categories of mutations that are numerous or are strongly selected tend to contribute most to the variance in fitness.
It is also of interest to determine the variance in fitness contributed by a single mutation at a particular frequency. This can be calculated by dividing the variance contributed by mutations at a frequency by the density of mutations at that frequency. As expected, there are more mutations at lower frequencies, but on a log scale this difference in density is relatively small over a broad range of parameters (Fig. S2); hence the variance contributed by single mutations at a particular frequency is very similar to the proportion of variance contributed by all mutations at that frequency, with common mutations contributing slightly more variance on a mutation-by-mutation basis than they do as a category (Fig. S3).
Let us now consider the case in which trait and fitness are not perfectly correlated, and let us first consider the case in which the mean absolute effect of a mutation on the trait is linearly related to the strength selection on the mutation (τ = 1, σ > 0). So if two mutations differ by twofold in fitness, they will, on average, differ twofold in their average absolute effects on the trait, although mutations can have very large or small effects on the trait depending on the magnitude of σ. Surprisingly, the relationship between the variance in the trait and allele frequency under this model is identical to the case when the trait is fitness itself (Fig. 3); so even if σ is very large and the effects on trait and fitness are very poorly correlated, most of the variance is contributed by rare mutations unless the mean strength of selection is low. This can be seen be by considering V(x) / VT; this expression is independent of σ (as described earlier).
Fig. 3.

The density of variance, V(x) / VT, in the trait as a function of allele frequency, for different values of τ and different mean strengths of selection (β = 0.20): (A) of 3,000, (B) of 30.
In contrast, if the effects of the mutation on fitness and trait are independent (τ = 0, σ > 0), all of the variance in the trait is contributed by common mutations (Fig. 3 and Fig. S4); these are neutral mutations segregating at relatively high frequency. In between these extremes we see a shift from one pattern to the other. For example, if τ is 1/2, such that the mean absolute trait value increases as the square root of the mean strength of selection, then more variance is contributed by high-frequency mutations, than when the trait is fitness or when the SD increases linearly with selection (Fig. 3 and Fig. S4). As the strength of selection increases, the proportion of variance explained by high allele frequency decreases; the proportion is also dependent upon the shape parameter of the DFE, but here we see a different pattern to that observed when the trait is fitness. When τ << 1, the relationship between variance and allele frequency becomes more dependent upon the shape parameter, and as the DFE becomes less leptokurtic (i.e., increasing shape parameter), less of the variance in the trait is contributed by high-frequency mutations. However, when τ is relatively large we see the opposite pattern, and less leptokurtic distributions have slightly more variance being contributed by relatively common mutations.
We have so far considered the proportion of the variance in the trait being contributed by mutations at different allele frequencies under a single unimodal DFE. However, in reality, both fitness and trait are likely to be governed by complex multimodal distributions, composed of several different distributions; indeed there is some evidence of this (21). It seems likely that the overall distribution will, at minimum, be a combination of the distribution of nonsynonymous point and small indel mutations, point and small indel mutations in regulatory sequences, and copy number variant mutations. It is thus of interest to investigate the absolute level of variance contributed by a certain distribution and how this depends upon the shape and mean of the distribution and the relationship between trait and fitness. A visual inspection of Eq. 7 shows that the total variance is linearly related to the square of σ, but otherwise the relationship between the total variance and any one parameter (e.g., β) depends on the values of the other two parameters (e.g., τ and ). However, the total variance is largely independent of the shape parameter, β. The variance increases with the mean strength of selection, and the rate at which it increases depends on τ (Fig. 4). When τ is 1, the increase in variance is linear with a slope of 1, such that a 10-fold increase in the mean strength of selection yields a 10-fold increase in the variance. This dependency declines as τ decreases (Fig. 4).
Fig. 4.

The total variance, VT, as a function of the mean strength of selection and the parameter τ. The shape parameter, β, was assumed to be 0.20, and σ was set at 1.
Discussion
We have investigated a model in which mutations that affect a trait of interest also have affects on fitness, even if the effects are very small, either because the trait is a component of fitness or because the mutations have pleiotropic effects on other traits, which are themselves aspects of fitness (15, 16). Under this model, most of the variance in fitness is contributed by mutations of large effect that are very rare in the population, unless the mean strength of selection acting upon the mutations is very low (i.e.,  < 10) or the mean absolute effect of a mutation on the trait (equivalently, the SD of trait effects) increases less than linearly with the strength of selection. Surprisingly, the model is independent of the variation in the trait, σ, so the correlation between the effects of a mutation on the trait and fitness can be very small and still most of the variance in the trait will come from low-frequency mutations if the SD of the trait increases linearly with the strength of selection.
One might argue that the model relating fitness and trait is unrealistic because, if σ is not very large, then the distribution of mutational effects on the trait is bimodal. As an alternative, we investigated a model in which the distribution of mutational effects on the trait is unimodal:  . Examples of this relationship are given in Fig. S5. If we substitute this model into Eq. 3 and simplify, we get an equation that is very similar to Eq. 6; it differs only in that the (1 + σ2) term vanishes. The model therefore behaves in an almost identical manner in all respects.
The relationship between the variance in a trait and allele frequency has been previously investigated by Pritchard (22), who concluded that slightly deleterious mutations would contribute most to the variance in the trait, and that most of this variance would be from mutations at moderate frequencies in the population. However, the model assumed that the effect of mutations on trait and fitness were uncorrelated, so this is consistent with the results presented here for a τ of 0. There seems little reason to believe that the effects would not be correlated.
A number of assumptions have been made within the model. First, it is assumed that population sizes are stationary. However, population size expansions or contractions can affect the distribution of alleles in a population, and this may influence how the variance is distributed between different allele frequency classes. Furthermore, it has been shown that demography can have implications for the diversity of alleles that cause a disease (23, 24). Second, the model assumes that mutations are being held in a balance among mutation, selection, and genetic drift. However, the maintenance of quantitative genetic variation still remains the subject of debate (25). It is possible that positive selection may increase the frequency of mutations, either directly because some mutations are advantageous, or indirectly through genetic “hitchhiking” (26), and this will have consequences for the variance in the trait. Third, we assume that all traits are equal; however, we are most interested in common diseases, and these may be common simply because some mutations are segregating at high frequency by chance.
The behavior of the model depends critically on the how the effects of a mutation of the trait and fitness are related; if the effects are independent, most of the variance is contributed by mutations segregating at high frequencies in the population, but if the mean absolute effect of a mutation on the trait is linearly related to the strength of selection, most of the variance is contributed by mutations at low frequencies. Unfortunately we know relatively little about how mutations affect fitness and traits, although it is clear from work in Drosophila, mice, and humans that pleiotropy is widespread (14). The one study to specifically address the relationship between fitness and a putatively neutral trait (27) showed that mutations with large effects on two traits, abdominal and sternopleural bristle number, also had negative effects on viability, but the level of resolution was not sufficient to determine whether the absolute effect on the trait increased linearly with the strength of selection (27). Without additional information, there seems little reason to believe that the relationship would not be linear (i.e., τ = 1 in both models). As a consequence it seems likely that most of the variance in the trait will be contributed by mutations segregating at low frequencies unless the mean strength of selection is very low (i.e., Nes < 10).
Unfortunately, we do not know the DFE for all new mutations in humans or any other organism (21). In humans, we have some information about the DFE for amino acid mutations; using the site frequency spectrum and assuming a Γ-distribution for the DFE, it has been estimated that the distribution is highly leptokurtic (i.e., shape parameter of 0.20) with a mean strength of selection of approximately 3,000 (ref. 18; see also refs. 19, 20, 28, and 29). The estimate of the mean strength of election must be treated with some caution because, in analyses of this sort, there is little information about the mean. Nevertheless it is clear that the mean is likely to be greater than 100 as the majority of mutations are inferred to have effects larger than this (18–20, 28, 29) and we therefore expect the vast majority of the variance in fitness to be contributed by mutations below 1/100 (Fig. 1); if the mean is greater than 1,000, most of the variance is contributed by mutations below 1/1,000. This suggests that very little of the variance in fitness is being contributed by nonsynonymous mutations discovered in current resequencing projects, which have sample sizes of approximately 100 chromosomes (30–33). If we want to find the nonsynonymous mutations that might contribute to the variance in fitness or traits, we need to be prepared to sequence at least 1,000, and maybe 10,000, individuals. Furthermore, it may be that we will also need to sequence deeply to see mutations causing disease if they tend to be at all strongly selected.
Although we know something about the DFE of nonsynonymous or amino acid mutations, we know less about the DFE for mutations in noncoding DNA. It has been estimated that approximately 3.6% of the genome is noncoding DNA subject to some level of selective constraint, as opposed to 0.6% of the genome in coding sequences (34). However, several lines of evidence suggest the strength of selection is substantially lower in functional noncoding sequences than in coding DNA. First, a recent analysis of SNPs estimated the mean strength of selection acting upon new mutations in human conserved nongenic sequences (CNGs) to be such that S is approximately 50 (35), whereas a similar analysis in coding sequences estimated the strength of selection on new nonsynonymous mutations to be approximately 3,000 (18). Second, CNGs show higher levels of divergence and diversity than coding sequences and less skew toward rare polymorphisms (34, 36, 37). And third, CNGs and sequences flanking protein coding sequences are less constrained in hominids than in rodents, which suggests that many mutations in these sequences are weakly selected (36–38).
Although they must be treated with great caution, the best estimates suggest the strength of selection acting upon CNG mutations is nearly 100-fold less than that acting upon nonsynonymous mutations. This would therefore suggest that the vast majority of the variance in fitness is contributed by nonsynonymous mutations, as there are only about 10 times more CNGs than nonsynonymous sites. Furthermore, if the relationship between trait and fitness is the same for regulatory and nonsynonymous mutations, this implies that most of the variance in traits will also be contributed by nonsynonymous mutations. This is because, to a first approximation, the variance contributed by a category of mutations is the total mutation rate for the category multiplied by the mean strength of selection.
We have so far discussed point mutations, but insertions, deletions, and genomic rearrangements are often involved in disease (39). These may contribute substantial variance because, although they are probably less numerous than point mutations, they are also expected to have larger effects on fitness and on traits. Unfortunately, we currently do not know either the rate or effects of indel and genomic rearrangements.
The fact that most of the variance in a trait tends to be contributed by rare mutations, unless the means strength of selection acting upon mutations that affect the trait is very low, has clear implications for genome-wide association studies. These studies have successfully identified many mutations associated with a variety of diseases and traits in humans (4, 7), but disappointingly, these variants explain little of the variance in any of the traits (6, 8). This is perhaps not surprising given the analysis presented here; if mutations have effects on the trait and on fitness, most of the variance in the trait is contributed by mutations that are rare in the population, which genome-wide association studies would never, and may never, be able to detect. Furthermore, current genome-wide association studies may actually be misleading us to some extent. It is possible that the genes that have the largest effect on a trait also tend to be the most strongly selected, so we will never find associations in those genes; instead we may be finding associations in genes in which most mutations are relatively weakly selected, but which also correspondingly have small effects on the trait. Such a bias is consistent with the observation that genes that contain a nonsynonymous SNP associated with disease appear to be subject to weaker natural selection than other genes containing nonsynonymous SNPs, as judged by the rate of nonsynonymous to synonymous substitution (40, 41).
Acknowledgments
I am very grateful to David Waxman for mathematical help and to Nina Stoletzki, Peter Keightley, David Houle, Mary Clare King, Raju Govindaraju, Peter Visscher, Monty Slatkin, Bill Hill, and two anonymous referees for helpful comments and discussion.
Footnotes
This paper results from the Arthur M. Sackler Colloquium of the National Academy of Sciences, “Evolution in Health and Medicine” held April 2–3, 2009, at the National Academy of Sciences in Washington, DC. The complete program and audio files of most presentations are available on the NAS web site at www.nasonline.org/Sackler_Evolution_Health_Medicine.
The author declares no conflicts of interest.
This article is a PNAS Direct Submission. D.R.G. is a guest editor invited by the Editorial Board.
This article contains supporting information online at www.pnas.org/cgi/content/full/0906182107/DCSupplemental.
References
- 1.The_International_HapMap_Consortium A haplotype map of the human genome. Nature. 2005;437:1299–1320. doi: 10.1038/nature04226. [DOI] [PMC free article] [PubMed] [Google Scholar]
- 2.The_International_HapMap_Consortium A second generationhuman haplotype map of over 3.1 million SNPs. Nature. 2007;449:851–862. doi: 10.1038/nature06258. [DOI] [PMC free article] [PubMed] [Google Scholar]
- 3.Hirschhorn JN, Daly MJ. Genome-wide association studies for common diseases and complex traits. Nat Rev Genet. 2005;6:95–108. doi: 10.1038/nrg1521. [DOI] [PubMed] [Google Scholar]
- 4.Donnelly P. Progress and challenges in genome-wide association studies in humans. Nature. 2008;456:728–731. doi: 10.1038/nature07631. [DOI] [PubMed] [Google Scholar]
- 5.Weiss KM. Tilting at quixotic trait loci (QTL): an evolutionary perspective on genetic causation. Genetics. 2008;179:1741–1756. doi: 10.1534/genetics.108.094128. [DOI] [PMC free article] [PubMed] [Google Scholar]
- 6.Maher B. Personal genomes: The case of the missing heritability. Nature. 2008;456:18–21. doi: 10.1038/456018a. [DOI] [PubMed] [Google Scholar]
- 7.Hindorff LA, et al. Potential etiologic and functional implications of genome-wide association loci for human diseases and traits. Proc Natl Acad Sci USA. 2009;106:9362–9367. doi: 10.1073/pnas.0903103106. [DOI] [PMC free article] [PubMed] [Google Scholar]
- 8.Manolio TA, et al. Finding the missing heritability of complex diseases. Nature. 2009;461:747–753. doi: 10.1038/nature08494. [DOI] [PMC free article] [PubMed] [Google Scholar]
- 9.Gudbjartsson DF, et al. Many sequence variants affecting diversity of adult human height. Nat Genet. 2008;40:609–615. doi: 10.1038/ng.122. [DOI] [PubMed] [Google Scholar]
- 10.Lettre G, et al. Diabetes Genetics Initiative; FUSION; KORA; Prostate, Lung Colorectal and Ovarian Cancer Screening Trial; Nurses’ Health Study; SardiNIA. Identification of ten loci associated with height highlights new biological pathways in human growth. Nat Genet. 2008;40:584–591. doi: 10.1038/ng.125. [DOI] [PMC free article] [PubMed] [Google Scholar]
- 11.Weedon MN, et al. Diabetes Genetics Initiative; Wellcome Trust Case Control Consortium; Cambridge GEM Consortium. Genome-wide association analysis identifies 20 loci that influence adult height. Nat Genet. 2008;40:575–583. doi: 10.1038/ng.121. [DOI] [PMC free article] [PubMed] [Google Scholar]
- 12.Bodmer W, Bonilla C. Common and rare variants in multifactorial susceptibility to common diseases. Nat Genet. 2008;40:695–701. doi: 10.1038/ng.f.136. [DOI] [PMC free article] [PubMed] [Google Scholar]
- 13.Goldstein DB. Common genetic variation and human traits. N Engl J Med. 2009;360:1696–1698. doi: 10.1056/NEJMp0806284. [DOI] [PubMed] [Google Scholar]
- 14.Flint J, Mackay TF. Genetic architecture of quantitative traits in mice, flies, and humans. Genome Res. 2009;19:723–733. doi: 10.1101/gr.086660.108. [DOI] [PMC free article] [PubMed] [Google Scholar]
- 15.Hill WG, Keightley PD. Interrelations of mutation, population size, artificial and natural selection. Proceedings of the second international conference on quantitative genetics. In: Weir BS, Eisen EJ, Goodman MM, Namkoong G, editors. Sunderland, MA: Sinauer; 1988. pp. 57–70. [Google Scholar]
- 16.Keightley PD, Hill WG. Variation maintained in quantitative traits with mutation-selection balance: pleiotropic side-effects on fitness traits. Proc R Soc Lond B. 1990;242:95–100. [Google Scholar]
- 17.Wright S. The distribution of gene frequencies under irreversible mutation. Proc Natl Acad Sci USA. 1938;24:253–259. doi: 10.1073/pnas.24.7.253. [DOI] [PMC free article] [PubMed] [Google Scholar]
- 18.Boyko AR, et al. Assessing the evolutionary impact of amino acid mutations in the human genome. PLoS Genet. 2008;4:e1000083. doi: 10.1371/journal.pgen.1000083. [DOI] [PMC free article] [PubMed] [Google Scholar]
- 19.Eyre-Walker A, Woolfit M, Phelps T. The distribution of fitness effects of new deleterious amino acid mutations in humans. Genetics. 2006;173:891–900. doi: 10.1534/genetics.106.057570. [DOI] [PMC free article] [PubMed] [Google Scholar]
- 20.Keightley PD, Eyre-Walker A. Joint inference of the distribution of fitness effects of deleterious mutations and population demography based on nucleotide polymrophism frequencies. Genetics. 2007;177:2251–2261. doi: 10.1534/genetics.107.080663. [DOI] [PMC free article] [PubMed] [Google Scholar]
- 21.Eyre-Walker A, Keightley PD. The distribution of fitness effects of new mutations. Nat Rev Genet. 2007;8:610–618. doi: 10.1038/nrg2146. [DOI] [PubMed] [Google Scholar]
- 22.Pritchard JK. Are rare variants responsible for susceptibility to complex diseases? Am J Hum Genet. 2001;69:124–137. doi: 10.1086/321272. [DOI] [PMC free article] [PubMed] [Google Scholar]
- 23.Peng B, Kimmel M. Simulations provide support for the common disease-common variant hypothesis. Genetics. 2007;175:763–776. doi: 10.1534/genetics.106.058164. [DOI] [PMC free article] [PubMed] [Google Scholar]
- 24.Reich DE, Lander ES. On the allelic spectrum of human disease. Trends Genet. 2001;17:502–510. doi: 10.1016/s0168-9525(01)02410-6. [DOI] [PubMed] [Google Scholar]
- 25.Johnson T, Barton NH. Theoretical models of selection and mutation on quantitative traits. Phil Trans R Soc B. 2005;360:1411–1425. doi: 10.1098/rstb.2005.1667. [DOI] [PMC free article] [PubMed] [Google Scholar]
- 26.Williamson SH, et al. Localizing recent adaptive evolution in the human genome. PLoS Genet. 2007;3:e90. doi: 10.1371/journal.pgen.0030090. [DOI] [PMC free article] [PubMed] [Google Scholar]
- 27.Lyman RF, Lawrence F, Nuzhdin SV, Mackay TF. Effects of single P-element insertions on bristle number and viability in Drosophila melanogaster. Genetics. 1996;143:277–292. doi: 10.1093/genetics/143.1.277. [DOI] [PMC free article] [PubMed] [Google Scholar]
- 28.Yampolsky LY, Kondrashov FA, Kondrashov AS. Distribution of the strength of selection against amino acid replacements in human proteins. Hum Mol Genet. 2005;14:3191–3201. doi: 10.1093/hmg/ddi350. [DOI] [PubMed] [Google Scholar]
- 29.Kryukov GV, Pennacchio LA, Sunyaev SR. Most rare missense alleles are deleterious in humans: implications for complex disease and association studies. Am J Hum Genet. 2007;80:727–739. doi: 10.1086/513473. [DOI] [PMC free article] [PubMed] [Google Scholar]
- 30.Akey JM, et al. Population history and natural selection shape patterns of genetic variation in 132 genes. PLoS Biol. 2004;2:e286. doi: 10.1371/journal.pbio.0020286. [DOI] [PMC free article] [PubMed] [Google Scholar]
- 31.Bustamante CD, et al. Natural selection on protein-coding genes in the human genome. Nature. 2005;437:1153–1157. doi: 10.1038/nature04240. [DOI] [PubMed] [Google Scholar]
- 32.Hinds DA, et al. Whole-genome patterns of common DNA variation in three human populations. Science. 2005;307:1072–1079. doi: 10.1126/science.1105436. [DOI] [PubMed] [Google Scholar]
- 33.Livingston RJ, et al. Pattern of sequence variation across 213 environmental response genes. Genome Res. 2004;14(10A)(10A):1821–1831. doi: 10.1101/gr.2730004. [DOI] [PMC free article] [PubMed] [Google Scholar]
- 34.Asthana S, et al. Widely distributed noncoding purifying selection in the human genome. Proc Natl Acad Sci USA. 2007;104:12410–12415. doi: 10.1073/pnas.0705140104. [DOI] [PMC free article] [PubMed] [Google Scholar]
- 35.Torgerson DG, et al. Evolutionary processes acting on candidate cis-regulatory regions in humans inferred from patterns of polymorphism and divergence. PLoS Genet. 2009;5:e1000592. doi: 10.1371/journal.pgen.1000592. [DOI] [PMC free article] [PubMed] [Google Scholar]
- 36.Kryukov GV, Schmidt S, Sunyaev S. Small fitness effect of mutations in highly conserved non-coding regions. Hum Mol Genet. 2005;14:2221–2229. doi: 10.1093/hmg/ddi226. [DOI] [PubMed] [Google Scholar]
- 37.Keightley PD, Kryukov GV, Sunyaev S, Halligan DL, Gaffney DJ. Evolutionary constraints in conserved nongenic sequences of mammals. Genome Res. 2005;15:1373–1378. doi: 10.1101/gr.3942005. [DOI] [PMC free article] [PubMed] [Google Scholar]
- 38.Keightley PD, Lercher MJ, Eyre-Walker A. Evidence for widespread degradation of gene control regions in hominid genomes. PLoS Biol. 2005;3:e42. doi: 10.1371/journal.pbio.0030042. [DOI] [PMC free article] [PubMed] [Google Scholar]
- 39.Lupski JR. Genomic disorders ten years on. Genome Med. 2009;1:42. doi: 10.1186/gm42. [DOI] [PMC free article] [PubMed] [Google Scholar]
- 40.Thomas PD, Kejariwal A. Coding single-nucleotide polymorphisms associated with complex vs. Mendelian disease: evolutionary evidence for differences in molecular effects. Proc Natl Acad Sci USA. 2004;101:15398–15403. doi: 10.1073/pnas.0404380101. [DOI] [PMC free article] [PubMed] [Google Scholar]
- 41.Blekhman R, et al. Natural selection on genes that underlie human disease susceptibility. Curr Biol. 2008;18:883–889. doi: 10.1016/j.cub.2008.04.074. [DOI] [PMC free article] [PubMed] [Google Scholar]