Abstract
Low kVp settings provide high conspicuity of contrast materials at CT but may result in high image noise, particularly in larger patients. Material decomposition at dual energy CT can differentiate renal stones by their composition, quantify tissue iron stores, improve the detection of pathologic hyperenhancement, and reduce contrast material and radiation dose compared to conventional CT. Further clinical research and technique refinement will be needed as the usage of these exiciting technologies spreads.
Introduction
Changes are occurring in medical CT imaging that promise to augment the already well recognized CT strengths of speed, high resolution, excellent patient tolerance, and large territory coverage. These changes include dose reduction, noise reduction, and more speed. But perhaps more fundamentally, the ability to perform dual-energy scanning at CT (DECT) is being developed by every major CT scanner manufacturer and provides the ability of CT to differentiate between different materials at imaging. DECT improves our ability to detect contrast material and distinguishes between the high-density areas created by iodine from those created by calcium or other substances – in essence, DECT brings the insight of tissue and material decomposition to standard gray-scale CT images. The basis of DECT has been explored over the past 30 years [1-5] and now CT scanners and software are being engineered to leverage dual-energy imaging for practical clinical applications. This review article will discuss the influence of tube potential on CT images and explore the potential impact of DECT on imaging the abdomen and pelvis.
Tube Potential and the Basis of DECT
In conventional X-ray imaging, including CT, the adjustable setting that affects tissue contrast is the tube peak voltage (kVp), which determines the upper limit of the X-ray energy spectrum produced by the X-ray tube. Other settings, such as tube current (typically specified in milliAmperes, mA) and helical pitch affect image noise, but do not affect the X-ray attenuation (also called “CT number” and measured in units of Hounsfield (HU)) of the scanned object. In general, the extent of attenuation of an incident X-ray is affected by its energy and the properties of the intervening matter: its atomic composition, density, and thicknesses. At X-ray energies relevant to diagnostic imaging, the two predominant interactions between X-ray photons and matter are the photoelectric effect (complete X-ray aborption) and Compton interactions (X-ray scatter with fractional loss of X-ray energy), with a shift from a predominance of photoelectric effect to Compton interactions from the lower energy range of medical imaging (20-50 keV) to the higher-energy range (50-150 keV). X-ray attenuation is strongly related to the atomic number of the elements that make up the materials in the object being imaged and is typically higher for lower-energy than for higher-energy photons where attenuation is related to the electron density or mass of the imaged material. Any given material will have a set change in expected X-ray attenuation when imaged with one known X-ray energy spectrum compared to another. When an object with unknown material composition is imaged twice, once with one known X-ray energy spectrum and again with another known spectrum, the materials within that object can be differentiated and quantified based on the change in X-ray attenuation observed between voxels obtained with the two spectra, with reference to the expected change in X-ray attenuations of the base materials. Algorithms that quantify of the materials that make up an imaged object or voxel is called base material decomposition [3, 4, 6]. The evaluation of the attenuation differences by different materials imaged at two X-ray spectra has been exploited in planar imaging in many ways, including to quantify bone mineral density at dual-energy X-ray absorptiometry (DXA) [7], and to subtract bone from soft tissue, such as in chest radiography to improve parenchymal lung lesion detection.
Base material decomposition at DECT enabled improved CT bone mineral density measurements [2, 8] and liver iron quantification [9] compared to conventional single energy CT. While the benefits of DECT were recognized over 30 years ago, exploitation of this powerful tool was limited by the slowness of older generation CT since two separate scans were required, one at a high and one at a low kVp setting. A limitation of this method, particularly for soft tissues, is poor image registration due to movement of abdominal structures between the scan acquisitions, which usually required separate breathholds or at minimum, 2 seconds between individual slices. While repeat imaging was of minimal concern when evaluating bony structures [2, 10], the low temporal resolution constraints of early CT scanners prevented DECT utilization for imaging dynamic intravenous enhancement of organs due to rapid changes in the concentration of intravascular contrast material changes between scans. Also, the poor X-ray output of early X-ray tubes and inefficiency of early detectors prevented the use of low kVp settings since those settings resulted in low photon flux and excessive image noise.
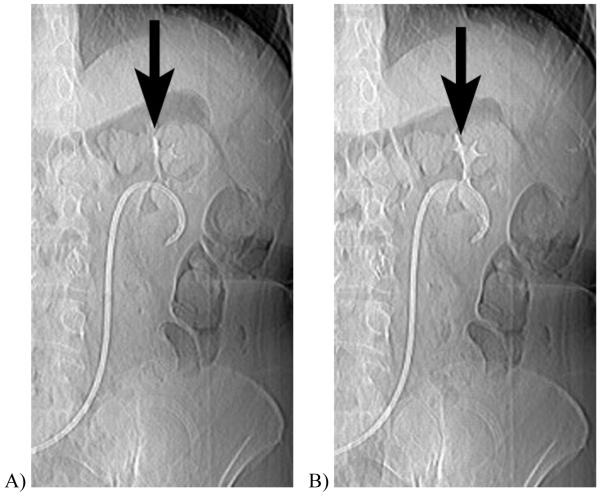
However, engineering DECT scanners to be fast and efficient_enough to image contrast material could not be ignored because iodinated contrast material is more conspicuous when imaged at lower kVp settings and shows an approximately 80% increase in CT number at 80 kVp than at 140 kVp. Imaging at lower kVp settings has numerous potential advantages, including an substantial reduction in the radiation dose, reduction in the amount of required intravenous contrast material, and reduction in certain artifacts such as pseudoenhancement [11]. Some reports showed that low kVp settings could emphasize contrast enhancement in certain scenarios such as CT angiography of renal donors [12] or CT perfusion imaging [13] and CT intravenous pyelograms (Fig 1) [14]. Unfortunately, low kVp settings frequently result in a substantial increase in image noise due to the relatively low X-ray output of the source and also increased relative X-ray attenuation by the patient, such that image noise is a problem in larger patients. Furthermore, while tissue contrast generally improves with lower kVp settings, certain structures such as gallstones [15] and certain renal stones have been shown to have improved conspicuity at higher kVp settings, even when image noise was taken into consideration [15, 16]. Combined use of high and low kVp settings in DECT, therefore, aims to capitalize on the strengths of each setting within the same examination for medical imaging
Figure 1.
CT scout obtained 10 minutes after intravenous contrast injection in a 61 year-old woman with cystectomy and ureteral stents. When imaged at A, 120 kVp, the excreted iodinated contrast material is barely visible in the renal calyces, but at B, 80 kVp the enhanced calyces are readily seen.
DECT Scanners
Several design modifications of CT scanners have been implemented to make DECT data acquisition more practical, and these approaches include rotate-rotate software, dual-source scanners, sandwich detectors, rapid kVp switching, and photon counting detectors. Briefly, rotate-rotate software drives the CT gantry to fully rotate once to acquire data at the first kVp setting, then almost immediately again to acquire data at the second kVp setting, and is used when the scanner does not have built-in hardware to allow for simultaneous dual-energy acquisition. The downsides of this method are the low speed and non-simultaneous nature of data acquisition which make this solution a minimal improvement over DECT with conventional CT systems.
Dual-source hardware involves the orthogonal placement of two source-detector units into a single gantry to allow simultaneous acquisition of low- and high-kVp images. Due to mechanical constraints, one unit has a smaller field of view limited to the central portion of the gantry. Slight misregistration artifact may occur between the two energy scans as the two x-ray tubes are offset by 90 degree phase and more sophisticated photon scatter correction is required.
Rapid kVp switching involves a single source that is capable of alternating hundreds of times per second between the two kVp settings during the CT gantry rotation. Sandwich detectors involves placement of one or more layers of detectors immediately on top of each other such that the detector layers deeper in the stack receive progressively higher mean energy photons due to the absorption of lower energy photons by the layers that are closer to the source. In these two solutions, excellent image registration can be obtained with a full field of view. Furthermore, since the source/detector configuration is essentially the same for both kVp settings, material decomposition can be obtained using the projection data rather than the image data and allow for more sophisticated analysis, including extrapolation of monochromatic CT images. A potential drawback of rapid kVp switching may be limited control of tube current for the two kVp settings, which may result in mismatched noise levels between the images acquired at each setting.
The general limitation of all of these approaches to DECT is that the energy spectra generated by the source(s) are polychromatic with overlap of the low-energy spectra with the high-energy spectra. The part of the spectra that overlaps adds noise without any material differentiation. Detectors capable of rapid photon counting combined with special k-edge filters, or sources that produce monochromatic X-rays would most likely provide the highest performance but currently not feasible because of technical limitations.
DECT techniques can be adjusted to deliver similar total radiation doses to the patient as conventional CT scans. A challenge, however, is that the processing of DECT works best if the noise is similar between the high and low kVp images, a scenario which is difficult to achieve particularly for large patients where high noise at 80 kVp imaging in the abdomen is inevitable. To match the image noise at 120 to 140 kVp, the tube current of an 80 kVp scan must be substantially increased. This latter consideration results in the need to select patients and clinical scenarios that are least likely to be impacted by the limitations of 80 kVp imaging. To some extent, use of a higher low kVp threshold, such as 100 rather than 80 kVp, can be utilized in problematic scenarios. Furthermore, newer CT reconstruction algorithms which reduce image noise will likely improve the range of applications available to abdominal DECT in the future.
Unenhanced DECT
Renal Stone Classification
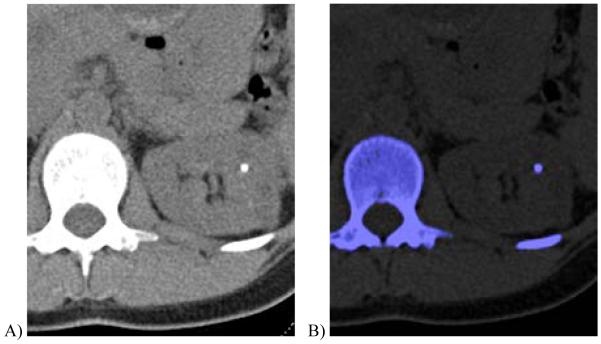
The intraabdominal DECT application that has received the widest initial attention is the differentiation of renal stones by their composition. Evaluation for possible renal stone disease is one of the most common indications for abdominal CT in the emergency setting, and CT is widely considered the standard of reference for the detection of urolithiasis. For patients where stones are identified and deemed unlikely to pass spontaneously, triage by stone composition could alter patient management because uric acid stones can often be treated by aggressive medical expulsive therapy while other types of stones generally require more urgent surgical consultation for possible mechanical extraction. Differentiation of stone composition plays to the strength of DECT because uric acid stones, which are composed of the small atoms carbon, oxygen, nitrogen, and hydrogen, show relatively little change in X-ray attenuation compared to almost all other stones, which generally include larger atoms including calcium, phosphorous, magnesium, or sulphur (Fig. 2). Limited in vitro and clinical studies have shown that DECT material decomposition can distinguish uric acid stones from other types of renal stones with high accuracy [17, 18]. For example, uric acid and calcium can be semi-automatically distinguished at DECT and color-coded for visual distinction (Fig. 3) [18].
Figure 2.
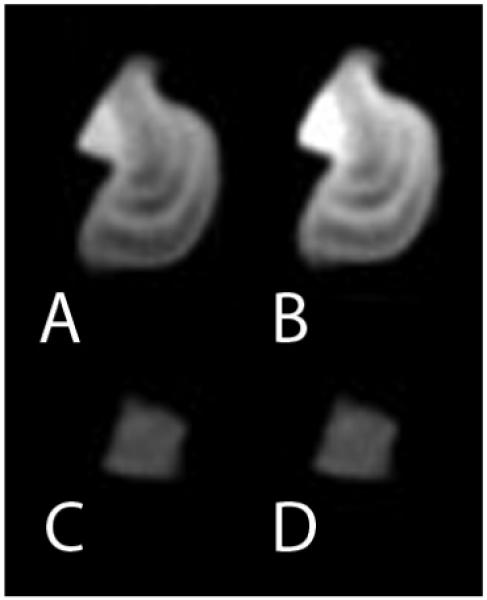
Renal stones imaged at DECT. A 140 kVp CT image of a struvite stone(A) shows much lower attenuation than the 80 kVp image (B). In contrast, the uric acid stone shows a relatively unchanged attenuation when imaged at 140 kVp (C) and 80 kVp (D). This basic principle can be exploited to semiautomatically classify renal stones as uric acid or non-uric acid composition and aid in patient triage.
Figure 3.
35 year-old female with autosomal dominant polycystic kidney and renal stone.
A, Transverse non-contrast dual energy (combined 80 kV/140 kV) image showing a left renal stone.
B, Axial, color-coded overlay using a three material classification scheme (uric acid-calcium-urine, where calcium is color-coded as blue) shows that the stone is calcium-containing.
(Courtesy Mayo Clinic CT Clinical Innovation Center)
Iron Quantification
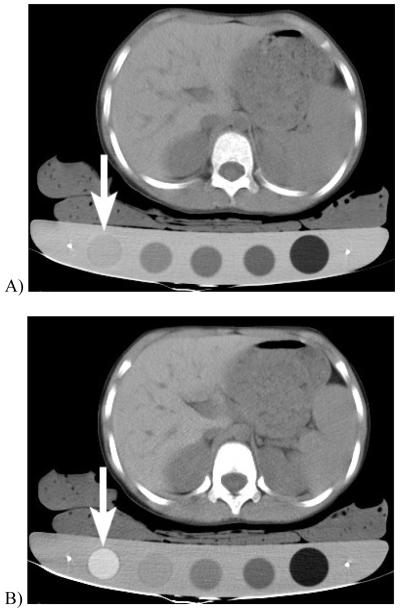
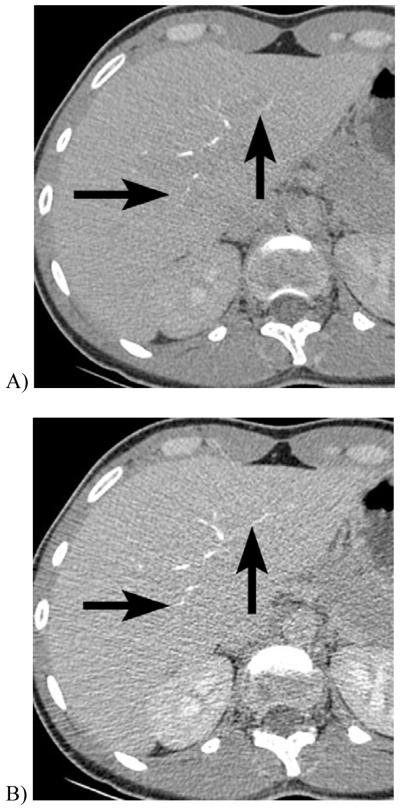
One of the initial applications developed for material decomposition with DECT was the quantification of liver iron stores [9, 19, 20]. Excessive body iron stores may be due to a primary (idiopathic) cause related to excessive iron absorption from intestinal mucosa, or secondary due to chronic large volume blood transfusion, often associated with hematologic disorders. In these patients, excess iron deposition may be seen in the reticuloendothelial system (liver, spleen, and bone marrow) and other organs, and can lead to cirrhosis and multiorgan failure. The diagnosis of hemochromatosis by liver biopsy or serum ferritin is known to be inaccurate for determining liver or body iron stores. DECT is a method of noninvasively and accurately quantifying liver iron stores based on the fact that differences in hepatic X-ray attenuation at different kVp’s vary linearly with changes in hepatic iron concentration [9, 19], while changes in attenuation of water and normal liver parenchyma are negligible [9]. Differences in hepatic X-ray attenuation between images obtained at two kVp settings are correlated with those of standardized cylinders of known iron content to quantify the liver iron concentration (Fig. 4). The liver iron concentration is then multiplied by the 3D volume of the liver to calculate the liver iron stores. In early studies, excellent correlation (r=0.993) was seen between biopsy and DECT determination of liver iron [20], which was a marked improvement over what is possible with conventional single energy CT due to the variable contribution of liver fat which may occur concurrently with iron deposition. In addition to the liver, DECT allows for quantification of iron deposition in other tissues including the myocardium [21].
Figure 4.
DECT quantification of liver iron in 7 year old girl with beta-thalassemia major. The patient was scanned at kVp settings of (A) 140 and (B) 80 kVp while lying on a board containing iron standards, which are cylinders with known concentrations of iron. For example, the arrow points to the highest concentration iron standard (20 mg iron / cm3) which shows markedly higher CT attenuation at the 80 than the 140 kVp setting. In this case, the liver attenuation at 140 kVp was 76 HU and at 80 kVp was 88 HU, and correlated with a high liver iron concentration of 4.5mg/ cm3. The liver was 526 cm3, giving a total liver iron load of 2.4 grams
Challenges
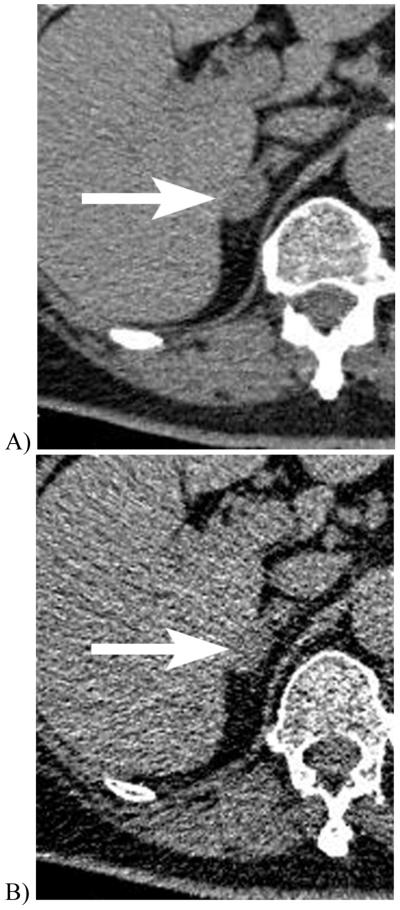
The clinical utilization and interpretation of unenhanced DECT requires further development and validation. For example, the evaluation of adrenal masses should be approached with caution using DECT until new thresholds are set to reliably differentiate adenomas from non-adenomas. At conventional CT, a low attenuation of a homogeneous adrenal mass consisting of a greater than 10% negative voxels suggests that the mass is an adenoma with microscopic fat [22]. However, these criteria were developed using predominantly 120 kVp settings, hence reference standards appropriate for DECT and attention to technique will be required (Fig. 5).
Figure 5.
Unenhanced CT scans of a 70 year-old woman with a right adrenal adenoma imaged at 140 kVp (A) show a mean adrenal mass CT attenuation of 24 HU and 14% of voxels less than 0 HU. The same lesion imaged at 80 kVp (B) showed a lower mean CT attenuation of 19 HU and a higher fraction (44%) of the voxels measured less than 0 HU. These differences between CT attenuations obtained at different CT settings highlight the need to consider the impact of imaging technique when using CT criteria to assess adrenal masses at CT. Most established CT criteria have utilized 120 kVp settings.
Intravenous Contrast Enhanced DECT
CT angiography
Conventional CT angiography is increasingly utilized for the assessment of vascular disease throughout the body and in many scenarios has become the first-line test of choice. DECT potentially augments conventional CT angiography by providing improved contrast resolution (Fig 6), potentially reducing the required dose of intravenous contrast material per examination. DECT also addresses the unfortunate drawback of conventional CT angiography of difficulty of manual subtraction of bone and mental subtraction of calcified atherosclerotic plaque from the enhanced arterial lumen. Particularly for 3 dimensional displays, calcifications may obscure the true size of the vascular lumen since both contrast and calcium are radiodense. Using DECT, owing to the substantial difference in the relative change in X-ray attenuation of calcium and iodine when imaged at 80 versus 140 kVp, calcified bone and calcified plaque can be differentiated from intravenous contrast material and automatically or semiautomatically subtracted [23]. Nevertheless, artifacts can occur due to image noise or slight misregistration of the 80 and 140 kVp data which may cause some areas of calcium or iodine to be inappropriately categorized. Furthermore, calcium bloom and small vessels with narrowed lumens may result in partial volume averaging effects [24].
Figure 6.
CT cholangiogram of 32 year old woman being evaluated for possible liver donation. Intravenous contrast material that is excreted into the biliary tract in this patient is slightly less conspicuous when the scan is obtained at 140 kVp/200 mA (A) than at 100 kVp/400 mA (B), but the image noise is lower with the high kVp setting. In this case, the iodinated contrast in the renal medulla is more conspicuous at the lower kVp setting, despite the higher image noise. In larger patients, image noise at low kVp settings may obscure fine detail.
Organ Perfusion and Lesion Detection
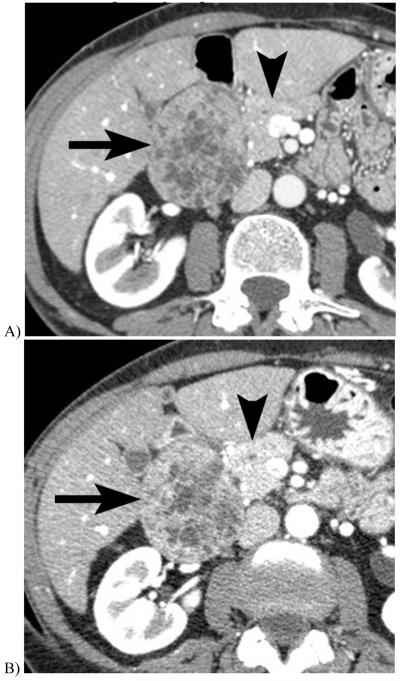
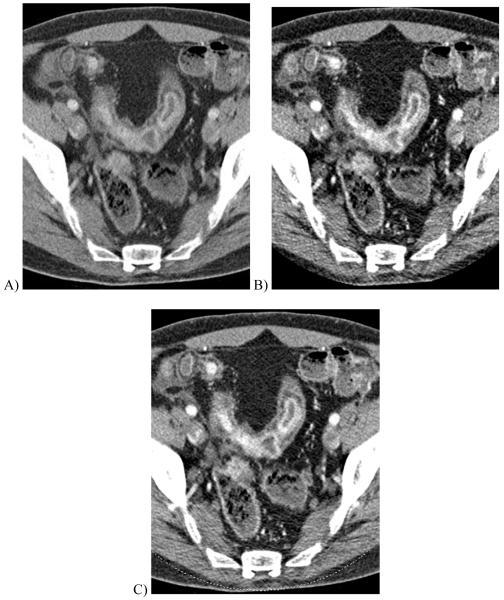
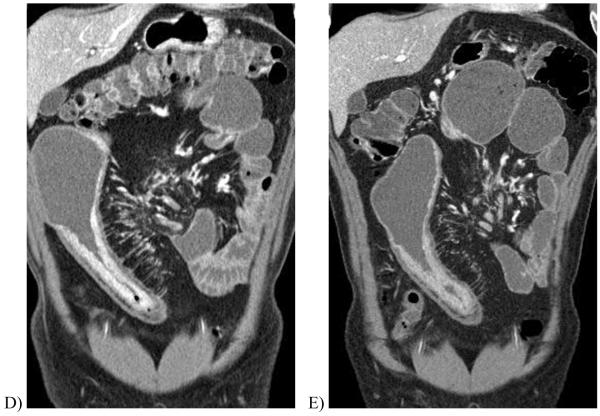
The value of DECT for contrast enhanced abdominal organ imaging is an exciting area of growth. The improved CT contrast resolution obtained at low kVp settings has been shown to provide higher detection rates of hypervascular lesions in phantom and clinical hepatic imaging, provided that the noise in the low kVp image is not excessive [25]. Areas of hyperemia in bowel and pancreas clearly benefit from enhanced detection of iodinated contrast material [26, 27] (Fig 7, 8). While the improved detection of contrast is primarily derived from the low energy (80 or 100 kVp) data, DECT can capitalize on the improved anatomic detail that is generally available from the low-noise high-energy data, particularly in larger patients, to augment the high contrast resolution images obtained from the low kVp settings. Blending strategies are an area of active DECT investigation, and for example, rather than simple linear averaging of the datasets, a sigmoidal blending technique that maximizes the benefits of each dataset appears promising in early experience (Fig. 9) [28]. In this strategy, voxels with low attenuation numbers are preferentially extracted from the high kVp dataset so as to minimize noise in fat, muscle, and homogeneous organs, while high attenuation numbers are obtained from the low kVp dataset so as to emphasize contrast enhancement. Manual blending during image generation and interpretation allows the reader to interact with the two datasets as needed for a given clinical problem.
Figure 7.
Intravenous contrast-enhanced CT images of a 66 year-old woman with a duodenal gastrinoma obtained one week apart, with the second examination obtained due to worsened abdominal pain. The initial scan was obtained at 120 kVp (A), and the subsequent at 80 kVp (B), both with 45 second scan delays after administration of intravenous contrast material. While differences in enhancement may be due in part to slight differences in day-to-day blood circulation time, the enhancement of the pancreas (arrowhead), gastrinoma (arrow), and bowel mucosa are much more conspicuous on the lower than the higher kVp image.
Figure 8.
46 year-old male with Crohn’s disease imaged with DECT enterography. (A) Axial image of output from the 140 kV tube shows ileal hyperemia. (B) Corresponding axial image of 80 kV tube shows increased noise and contrast. (C) Axial 80 kV tube output after multi-band filtration shows reduced image noise using only the output of the 80 kV tube. (D) Corresponding blended coronal image shows increased conspicuity of these findings of mural inflammation.compared with (E) a coronal image from a single energy 120 kV CT enterography obtained 5 months earlier. (Courtesy Mayo Clinic CT Clinical Innovation Center).
Figure 9.
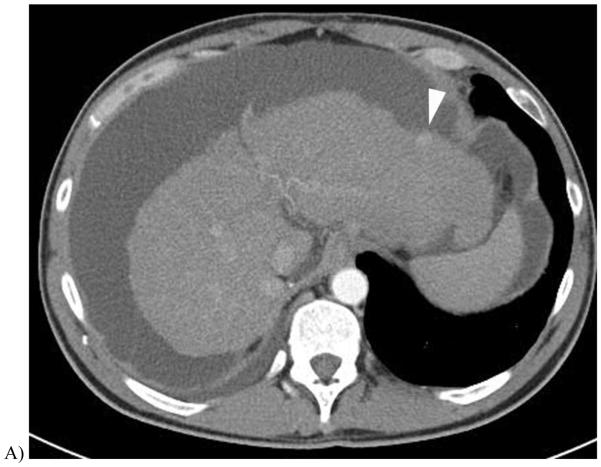
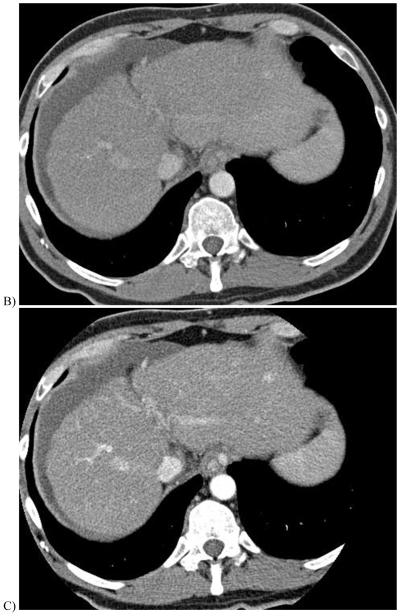
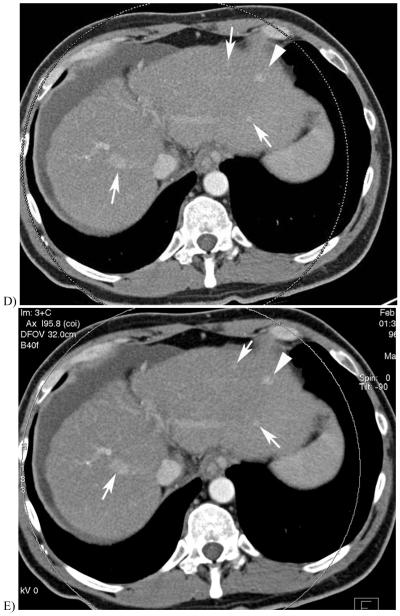
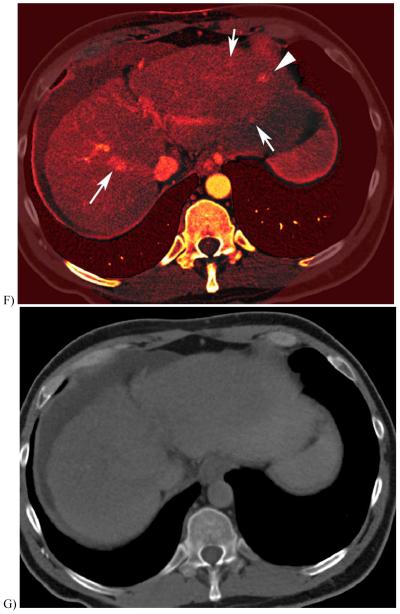
51 year-old with alcoholic cirrhosis.
A, Late arterial phase scan using 120 kV demonstrated a single hyperenhancing nodule (arrowhead) prompted follow-up DECT 3 months later.
B & C, 140 and 80 kV images from a late arterial phase of the follow-up DECT exam D, 0.3 linear blend of the 140 and 80 kV images (from B&C) better demonstrates same nodule (arrowhead) and multiple hypervascular nodules not seen on earlier exam (arrows).
E, Sigmoidal blend of B&C images shows the nodules with less noise in the liver parenchyma due to greater weighting of 140 kV pixels in the background liver compared with that of the linear blend image
F, Iodine overlay image (with pixels containing iodine colored orange) demonstrate hyperenhancing foci containing iodinated contrast.
G, Virtual unenhanced image created using images B&C and material classification to subtract the iodine contrast material
(Courtesy Mayo Clinic CT Clinical Innovation Center)
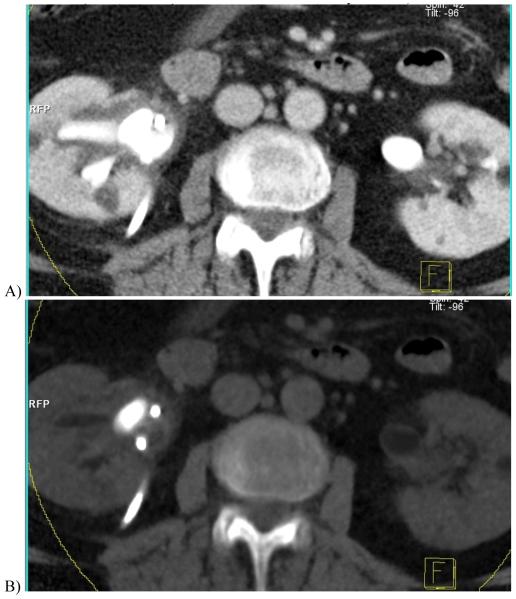
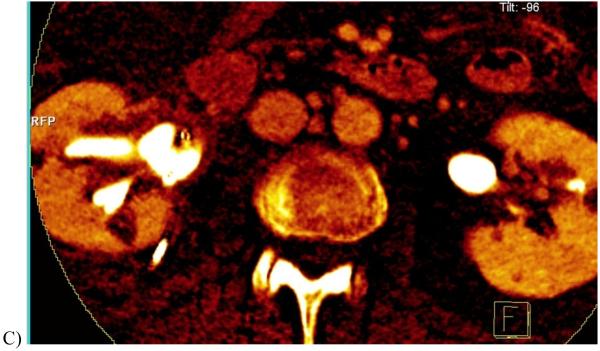
Conversely, rather than merging the data into a single image set, the high and low kVp datasets can be post-processed to isolate the iodinated intravenous contrast signal from the soft tissue to produce two new sets of images: 1) an “iodine only” image set that provides information regarding contrast material distribution in the end-organ, and 2) a “virtual unenhanced” CT scan which could potentially be used to replace the true unenhanced CT scan and thereby reduce radiation dose and improve patient throughput. These image sets could potentially be used, for example, to obtain a single-scan assessment of the renal parenchyma that would differentiate between high-attenuation hemorrhagic cysts and enhancing renal cell carcinomas [29] and reveal renal stones that may be otherwise obscured by intravenous contrast material [26, 30] (Fig 10). Similarly, the virtual unenhanced and iodine-only images can confirm the presence of active contrast extravasation, such as for the complication of endoleak from aortic stentgrafts, without the need to obtain a separate conventional unenhanced image for comparison, and thereby reducing radiation dose to the patient [31]. The iodine-only images can also emphasize areas of perfusion abnormality and improve both hyper- and hypo-vascular lesion detection in solid organs. In the thorax, iodine-only images have shown value in improving the detection pulmonary emboli by demonstrating segmental perfusion defects [32] or to show defects in myocardial tissue perfusion [33]. Similarly, the distribution of inhaled xenon gas can be determined by DECT to provide an assessment of pulmonary ventilation [34].
Figure 10.
Contrast-enhanced dual energy split-bolus CT urogram in a 68 year-old woman. (A) Axial contrast-enhanced image combining the high and low kVp data shows right nephrostomy tube and contrast in renal pelvis. (B) “Virtual unenhanced” image after iodine subtraction reveals a large stone in right renal pelvis. (C) “Iodine only” image in orange overlaid on the “virtual non-contrast” image shows a sepstation (arrow) within the right renal cyst, seen in retrospect on the contrast-enhanced image (A), indicating this is a Bosniak II cyst. (Courtesy, Dr. Robert Hartman, Mayo Clinic)
Challenges
Further refinement and clinical evaluation of the iodine only and virtual unenhanced images will be needed because image noise from the source DECT images results in substantially higher noise once they are post-processed. Also, virtual unenhanced images differ from conventional unenhanced CT images in that they do not reflect the X-ray spectra from a single kVp setting and so the interpretation of the X-ray attenuation in these images should be approached with caution. Using a similar example as for unenhanced DECT, it is likely that new thresholds will be required to use the virtual unenhanced images for the assessment of adrenal masses since the currently existing criteria were described for images acquired at 120 kVp, rather than at 80, 140, or blended / virtual images generated from disparate energy spectra.
Conclusion
The ability of DECT to extract basic information regarding iodine concentration and material composition has led to practical abdominal DECT applications that include the triage of patients with nephrolithasis based on stone composition, quantification of liver iron stores, evaluation of tissue perfusion, potential reduction in radiation dose by elimination of a separate unenhanced CT acquisition, and improved detection of pathologic hyperenhancement. As clinical utilization expands, radiologists must critically determine appropriate scenarios for using DECT for lesion detection as well as assess whether new diagnostic criteria unique to DECT should be implemented. Furthermore, to take advantage of the range of data available from DECT, improved display platforms to simplify viewing of the source and post-processed images and further understanding of post-processing artifacts will be needed. Continuing rapid technical developments will improve the acquisition and post-processing of DECT image data and clinical evaluation of this exciting new technology across a spectrum of abdominal diseases will be required.
References
- 1.Avrin DE, Macovski A, Zatz LE. Clinical application of Compton and photoelectric reconstruction in computed tomography: preliminary results. Invest Radiol. 1978;13:217–222. doi: 10.1097/00004424-197805000-00007. [DOI] [PubMed] [Google Scholar]
- 2.Genant HK, Boyd D. Quantitative bone mineral analysis using dual energy computed tomography. Invest Radiol. 1977;12:545–551. doi: 10.1097/00004424-197711000-00015. [DOI] [PubMed] [Google Scholar]
- 3.Kalender WA, Perman WH, Vetter JR, Klotz E. Evaluation of a prototype dual-energy computed tomographic apparatus. I. Phantom studies. Med Phys. 1986;13:334–339. doi: 10.1118/1.595958. [DOI] [PubMed] [Google Scholar]
- 4.Vetter JR, Perman WH, Kalender WA, Mazess RB, Holden JE. Evaluation of a prototype dual-energy computed tomographic apparatus. II. Determination of vertebral bone mineral content. Med Phys. 1986;13:340–343. doi: 10.1118/1.595951. [DOI] [PubMed] [Google Scholar]
- 5.Alvarez RE, Macovski A. Energy-selective reconstructions in X-ray computerized tomography. Phys Med Biol. 1976;21:733–744. doi: 10.1088/0031-9155/21/5/002. [DOI] [PubMed] [Google Scholar]
- 6.Kalender WA, Felsenberg D, Louis O, et al. Reference values for trabecular and cortical vertebral bone density in single and dual-energy quantitative computed tomography. Eur J Radiol. 1989;9:75–80. [PubMed] [Google Scholar]
- 7.Gluer CC, Steiger P, Selvidge R, Hayashi C, Genant HK. Performance of X-Ray and isotope-based dual-energy bone densitometers; Tenth Annual Scientific Meeting for the American Society of Bone and Mineral Research; New Orleans. 1988. [Google Scholar]
- 8.Kalender WA, Felsenberg D, Louis O, et al. Reference values for trabecular and cortical vertebral bone density in single and dual-energy quantitative computed tomography. European Journal of Radiology. 1989;9:70–80. [PubMed] [Google Scholar]
- 9.Goldberg HI, Cann CE, Moss AA, Ohto M, Brito A, Federle M. Noninvasive quantitation of liver iron in dogs with hemochromatosis using dual-energy CT scanning. Invest Radiol. 1982;17:375–380. doi: 10.1097/00004424-198207000-00013. [DOI] [PubMed] [Google Scholar]
- 10.Genant HK, Cann CE, Ettinger B, et al. Quantitative computed tomography for spinal mineral assessment: current status. J Comput Assist Tomogr. 1985;9:602–604. doi: 10.1097/00004728-198505000-00042. [DOI] [PubMed] [Google Scholar]
- 11.Wang ZJ, Coakley FV, Fu Y, et al. Renal cyst pseudoenhancement at multidetector CT: what are the effects of number of detectors and peak tube voltage? Radiology. 2008;248:910–916. doi: 10.1148/radiol.2482071583. [DOI] [PMC free article] [PubMed] [Google Scholar]
- 12.Sahani DV, Kalva SP, Hahn PF, Saini S. 16-MDCT angiography in living kidney donors at various tube potentials: impact on image quality and radiation dose. AJR Am J Roentgenol. 2007;188:115–120. doi: 10.2214/ajr.05.0583. [DOI] [PubMed] [Google Scholar]
- 13.Wintermark M, Maeder P, Verdun FR, et al. Using 80 kVp versus 120 kVp in perfusion CT measurement of regional cerebral blood flow. AJNR Am J Neuroradiol. 2000;21:1881–1884. [PMC free article] [PubMed] [Google Scholar]
- 14.Kawashima A, Vrtiska TJ, LeRoy AJ, Hartman RP, McCollough CH, King BF., Jr. CT urography. Radiographics. 2004;24(Suppl 1):S35–54. doi: 10.1148/rg.24si045513. discussion S55-38. [DOI] [PubMed] [Google Scholar]
- 15.Chan WC, Joe BN, Coakley FV, et al. Gallstone detection at CT in vitro: effect of peak voltage setting. Radiology. 2006;241:546–553. doi: 10.1148/radiol.2412050947. [DOI] [PubMed] [Google Scholar]
- 16.Tublin ME, Murphy ME, Delong DM, Tessler FN, Kliewer MA. Conspicuity of renal calculi at unenhanced CT: effects of calculus composition and size and CT technique. Radiology. 2002;225:91–96. doi: 10.1148/radiol.2251010242. [DOI] [PubMed] [Google Scholar]
- 17.Graser A, Johnson TR, Bader M, et al. Dual energy CT characterization of urinary calculi: initial in vitro and clinical experience. Invest Radiol. 2008;43:112–119. doi: 10.1097/RLI.0b013e318157a144. [DOI] [PubMed] [Google Scholar]
- 18.Primak AN, Fletcher JG, Vrtiska TJ, et al. Noninvasive differentiation of uric acid versus non-uric acid kidney stones using dual-energy CT. Acad Radiol. 2007;14:1441–1447. doi: 10.1016/j.acra.2007.09.016. [DOI] [PMC free article] [PubMed] [Google Scholar]
- 19.Royal SA, Beiderman BA, Goldberg HI, Koerper MM, Thaler MM. Detection and estimation of iron, glycogen and fat in liver of children with hepatomegaly using computed tomography (CT) Pediatr Res. 1979;13:408. [Google Scholar]
- 20.Chapman RW, Williams G, Bydder G, Dick R, Sherlock S, Kreel L. Computed tomography for determining liver iron content in primary haemochromatosis. Br Med J. 1980;280:440–442. doi: 10.1136/bmj.280.6212.440. [DOI] [PMC free article] [PubMed] [Google Scholar]
- 21.Hazirolan T, Akpinar B, Unal S, Gumruk F, Haliloglu M, Alibek S. Value of Dual Energy Computed Tomography for detection of myocardial iron deposition in Thalassaemia patients: initial experience. Eur J Radiol. 2008;68:442–445. doi: 10.1016/j.ejrad.2008.07.014. [DOI] [PubMed] [Google Scholar]
- 22.Bae KT, Fuangtharnthip P, Prasad SR, Joe BN, Heiken JP. Adrenal masses: CT characterization with histogram analysis method. Radiology. 2003;228:735–742. doi: 10.1148/radiol.2283020878. [DOI] [PubMed] [Google Scholar]
- 23.Brockmann C, Jochum S, Sadick M, et al. Dual-Energy CT Angiography in Peripheral Arterial Occlusive Disease. Cardiovasc Intervent Radiol. 2009 doi: 10.1007/s00270-008-9491-5. [DOI] [PubMed] [Google Scholar]
- 24.Tran DN, Straka M, Roos JE, Napel S, Fleischmann D. Dual-energy CT discrimination of iodine and calcium: experimental results and implications for lower extremity CT angiography. Acad Radiol. 2009;16:160–171. doi: 10.1016/j.acra.2008.09.004. [DOI] [PubMed] [Google Scholar]
- 25.Schindera ST, Nelson RC, Mukundan S, Jr., et al. Hypervascular liver tumors: low tube voltage, high tube current multi-detector row CT for enhanced detection--phantom study. Radiology. 2008;246:125–132. doi: 10.1148/radiol.2461070307. [DOI] [PubMed] [Google Scholar]
- 26.Graser A, Johnson TR, Chandarana H, Macari M. Dual energy CT: preliminary observations and potential clinical applications in the abdomen. Eur Radiol. 2009;19:13–23. doi: 10.1007/s00330-008-1122-7. [DOI] [PubMed] [Google Scholar]
- 27.Fletcher JG, Takahashi N, Hartman R, et al. Dual-Energy and Dual-Source CT: Is There a Role in the Abdomen and Pelvis? Radiol Clin North Am. 2009;47:41–57. doi: 10.1016/j.rcl.2008.10.003. [DOI] [PubMed] [Google Scholar]
- 28.Holmes DR, 3rd, Fletcher JG, Apel A, et al. Evaluation of non-linear blending in dual-energy computed tomography. Eur J Radiol. 2008;68:409–413. doi: 10.1016/j.ejrad.2008.09.017. [DOI] [PMC free article] [PubMed] [Google Scholar]
- 29.Brown CL, Hartman RP, Dzyubak OP, et al. Dual-energy CT iodine overlay technique for characterization of renal masses as cyst or solid: a phantom feasibility study. Eur Radiol. 2009 doi: 10.1007/s00330-008-1273-6. [DOI] [PubMed] [Google Scholar]
- 30.Takahashi N, Hartman RP, Vrtiska TJ, et al. Dual-energy CT iodine-subtraction virtual unenhanced technique to detect urinary stones in an iodine-filled collecting system: a phantom study. AJR Am J Roentgenol. 2008;190:1169–1173. doi: 10.2214/AJR.07.3154. [DOI] [PMC free article] [PubMed] [Google Scholar]
- 31.Stolzmann P, Frauenfelder T, Pfammatter T, et al. Endoleaks after endovascular abdominal aortic aneurysm repair: detection with dual-energy dual-source CT. Radiology. 2008;249:682–691. doi: 10.1148/radiol.2483080193. [DOI] [PubMed] [Google Scholar]
- 32.Thieme SF, Becker CR, Hacker M, Nikolaou K, Reiser MF, Johnson TR. Dual energy CT for the assessment of lung perfusion--correlation to scintigraphy. Eur J Radiol. 2008;68:369–374. doi: 10.1016/j.ejrad.2008.07.031. [DOI] [PubMed] [Google Scholar]
- 33.Ruzsics B, Lee H, Zwerner PL, Gebregziabher M, Costello P, Schoepf UJ. Dual-energy CT of the heart for diagnosing coronary artery stenosis and myocardial ischemia-initial experience. Eur Radiol. 2008;18:2414–2424. doi: 10.1007/s00330-008-1022-x. [DOI] [PubMed] [Google Scholar]
- 34.Chae EJ, Seo JB, Goo HW, et al. Xenon ventilation CT with a dual-energy technique of dual-source CT: initial experience. Radiology. 2008;248:615–624. doi: 10.1148/radiol.2482071482. [DOI] [PubMed] [Google Scholar]


