

Abstract
Cholinergic neurons are a major constituent of the mammalian central nervous system. Acetylcholine, the neurotransmitter used by cholinergic neurons, is synthesized from choline and acetyl CoA by the enzymatic action of choline acetyltransferase (ChAT). The transport of choline into the cholinergic neurons, which results in synthesis of ACh, is hemicholinium sensitive and is referred to as high affinity choline uptake (HACU). Thus, the formation of acetylcholine in cholinergic neurons largely depends on both the levels of choline being transported into the cells from the extracellular space, and the activity of ChAT. Several methods were described previously to measure HACU and ChAT simultaneously in synaptosomes, but the same for cultured cells is lacking. We describe a procedure to measure HACU and ChAT at the same time in cultured cells by simple techniques employing radionuclides. In this procedure we determined quantitatively hemicholinium sensitive choline uptake, and ChAT enzyme activity in a small number of differentiated human neuroblastoma (SK-N-SH) cells. We also determined the kinetics of choline uptake in the SK-N-SH cells. We believe that these simple methods can be used for neurochemical and drug discovery studies in several models of neurodegenerative disorders including Alzheimer’s disease.
Keywords: Acetylcholine, choline uptake, ChAT, differentiation, enzyme assay, HACU, neuronal cells, neurodegenerative disorders, tissue culture
1. Introduction
Acetylcholine is the neurotransmitter in cholinergic neurons and is synthesized in the nerve terminal following transport of choline from the extracellular space. Choline is transported into the cell by the high affinity choline transporter (Apparsundaram et al., 2000) where it reacts with acetyl CoA in the presence of the enzyme choline acetyltransferase (ChAT) to form acetylcholine. High affinity choline uptake into cholinergic cells can be completely blocked by hemicholinium-3 and is referred to as high affinity choline uptake (HACU) (Simon and Kuhar, 1975). Loss of cholinergic neurons is pathognomonic in several neurodegenerative disorders like Alzheimer’s disease (AD) (Ginsberg et al., 2006). One of the important modes of treatment in AD is to restore cholinergic transmission by preventing the degradation of acetylcholine by acetylcholinesterase (Birks et al., 2009). Indeed, there are four FDA approved cholinesterase inhibitors (ChEIs) and a partial NMDA receptor antagonist, memantine being used for the treatment of AD. However, their effects on HACU are unknown. In addition to ChEIs other strategies, such as estrogen replacement therapy, neuroprotective compounds and antioxidants are being investigated for the prevention and treatment of AD (Lahiri et al., 2003). In this context, the ability of estrogen to increase HACU activity in cultured basal forebrain cholinergic neurons assumes significance (Bennett et al., 2009). Our goal is to test whether ChEIs, both FDA approved and the newer drugs have effects on choline uptake and/or ChAT, and for this purpose we developed a procedure to measure HACU and ChAT at the same time in neuronally differentiated cultured cells as described herein.
We have used radioisotope based protocols to measure both HACU and ChAT enzyme activity in the same population of cultured cells. The protocols were originally developed to measure HACU in synaptosomes obtained from rodent brain(Simon et al., 1976) and ChAT enzyme activity in brain tissue (Fonnum, 1973). In our protocol, we have primarily used retinoic acid (RA) differentiated human neuroblastoma (SK-N-SH) cells. Human SK-N-SH cells display characteristics suggestive of multipotent embryonic precursor cells of neural crest origin (Pizzi et al., 2002). When exposed to RA, these cells undergo mitotic arrest and differentiate to a neuronal phenotype (Wainwright et al., 2001). Apart from differentiated SK-N-SH cells, we have also used this protocol to demonstrate HACU in embryonic rat primary cortical neuronal cells. Our simple, rapid and economical protocols not only accurately measure HACU in cell culture models, but at the same time assess ChAT enzyme activity. Measurement of HACU and ChAT together in the same cells give precise indication about the formation of acetylcholine and the “cholinergic status” of the cells. Taken together, these modified protocols can be used in cell culture based drug development studies in many central nervous system disorders.
2. Results
2.1. HACU activity in differentiated and undifferentiated SK-N-SH cells
HACU was found to be present in both undifferentiated and differentiated SK-N-SH cells. However, as expected, ATRA differentiated SK-N-SH cells showed twice as much choline uptake compared to undifferentiated SK-N-SH cells under the same conditions of the assay (figure 5 A).
Figure 5.
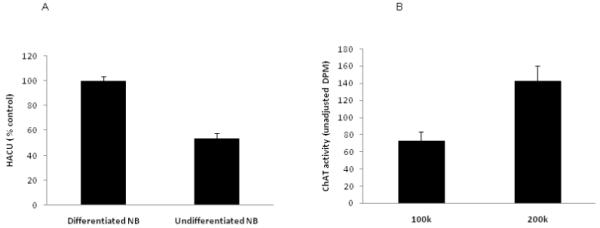
A: High affinity choline uptake in differentiated and undifferentiated SK-N-SH cells. Data for HACU were adjusted for CTG and are presented relative to differentiated cells SK-N-SH cells compared to the undifferentiated cells. [n=3 for each group].
B: Choline acetyltransferase activity as a function of cell number. ChAT activity was determined in differentiated SK-N-SH cells grown at two densities (100,000 and 200,000 cells/well). ChAT activity in wells that contain 200,000 cells is approximately twice that in wells containing 100k cells, showing linearity of enzyme activity with cell number.[n=3 for each group]
2.2. ChAT enzyme activity in differentiated SK-N-SH) cells
In addition to assaying HACU activity, enzymatic activity of ChAT was determined in differentiated SK-N-SH cells grown at two densities (100- and 200,000 cells/well). As shown in Fig. 5 B, the differentiated SK-N-SH cells contained a significant ChAT activity, which was found to be approximately twice in 200,000 cells as in 100,000 cells, demonstrating linearity of enzyme activity with cell number.
2.3. Effect of incubation temperature on choline uptake
To optimize the incubation temperature for [3H] choline uptake, we performed the uptake assay in differentiated SK-N-SH cells at four different temperatures, 7°C, 27°C, 37°C and 47°C. We have observed maximum choline uptake at 37°C (figure 6 A)
Figure 6.
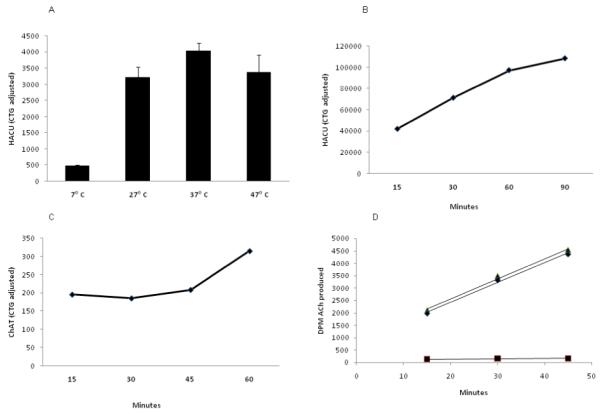
A: Temperature dependence of high affinity choline uptake in SK-N-SH cells. [3H] choline chloride incubation was carried out for 60 minutes at four different temperatures. CTG adjusted HACU data demonstrated maximum uptake at 37°C [n=3 for each group]. This particular experiment was carried out in a 48-well plate with 50,000 cells/well (CTG adjusted DPM is approximately 50% lower than those of other experiments).
B: Time course for high affinity choline uptake in SK-N-SH cells. [3H] choline chloride incubation was carried out at 37°C for four different times. CTG adjusted HACU data show maximum linear uptake at 60 minutes incubation. Although the uptake is more at 90 minutes incubation, it is no longer in the linear range.
C: ChAT activity as a function of incubation time. ChAT buffer substrate was added into differentiated SK-N-SH cell lysate and incubated at 37°C for 15, 30, 45 and 60 minutes. CTG adjusted DPM show maximum ChAT enzyme activity at 60 minutes.
D: Equal amount of rat cerebral cortex lysates were incubated with ChAT buffer substrate for 15, 30 and 45 minutes. The graph shows linearity of enzyme activity for at least 45 minutes of incubation. The triangles represent total activity; circles represent net activity; squares represent blank values.
2.4. Effect of incubation time on choline uptake and ChAT enzyme activity
For HACU we optimized the incubation time by incubating the differentiated SK-N-SH cells for 15, 30, 60 and 90 minutes. We observed that the choline uptake increased in a linear way up to 60 minutes of incubation and then reaches a plateau (figure 6 B).
We also conducted a time course for ChAT activity by incubating the cell lysate with BS for 15, 30, 45 and 60 minutes. Cell Titer Glo (CTG, which estimates viability of cells by measuring ATP content) adjusted ChAT activity showed maximum ChAT values at 60 minute compared to other times (figure 6 C). Similarly ChAT enzyme activity was found to be increased when equal amount of rat cerebral cortex lysate samples were incubated for 15, 30 and 45 minutes (figure 6 D).
2.5. Determining Km and Vmax for choline uptake in differentiated SK-N-SH cells
Here we also tested whether it is possible to use cell culture model systems, and the aforementioned protocols to determine HACU kinetics. Our preliminary data clearly demonstrate that HACU in differentiated SK-N-SH cells is saturable and obeys Michaelis Menten kinetics, with an estimated Km of approximately 2-3 μM and a Vmax of about 190 pmoles per hour (values have been normalized to cell numbers as assessed by CTG) (figure 7, A & B). Kinetics of ChAT can also be performed using this protocol simply by varying the substrate concentration of the BS.
Figure 7.
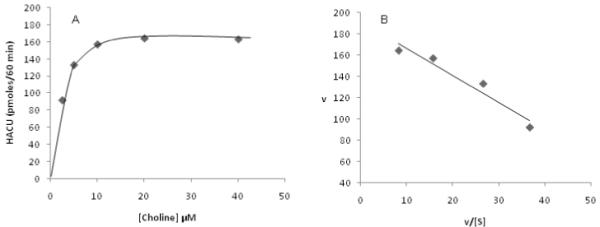
A and B: Kinetics of high affinity choline uptake in SK-N-SH cells. Cutured cells were incubated at 37°C for 1 hour in the presence of a fixed concentration (12 nM) of [3H] choline and varying concentrations (2.5 μM - 40 μM) of unlabelled choline. Data were normalized to CTG values, and converted to pmoles using the specific radioactivity for each condition. Blank values (plus HC-3) have been subtracted from all values. Left panel (A), saturation curve; right panel (B), Eadie-Hofstee transformation of same data in left panel.
3. Discussion
Our results clearly demonstrate that choline uptake and ChAT enzyme activity can be measured at the same time in cultured cells. These quantitative assays may have a wide range of implications. As already mentioned, severe cholinergic loss is associated with AD which is characterized by deposition of Aβ plaque and subsequent loss of cholinergic nerve cells. So far, FDA approved drugs like cholinesterase inhibitors (ChEIs) and the NMDA receptor partial antagonist memantine, are considered as 1st and 2nd lines of treatment for AD, respectively. Whether these or any other drugs can improve cholinergic transmission by increasing choline uptake and/or ChAT enzyme activity is still unknown. We have tested several ChEIs, memantine, and other natural products in differentiated SK-N-SH cells, and measured their effects on HACU and ChAT. We have seen that a ChEI, memantine, and a few garlic derived compounds significantly increase choline uptake in cultured cells (Ray and Lahiri, unpublished data). Furthermore, we have tested the effect of reactive oxygen species (ROS), which is continuously being generated in AD brain, on choline uptake in cultured cells and observed that concentrations of H2O2 of 25 μM and greater significantly decreases choline uptake in differentiated SK-N-SH cells (data not shown).
Another important aspect of the protocol is the successful determination of Km and Vmax for choline uptake in differentiated SK-N-SH cells, which can be applied to other cell lines, including those of CNS origin. This is important as post mortem brains from Alzheimer’s type dementia patients have been examined for Km and Vmax of ChAT. Notably, higher values for the Km and lower values for the Vmax for ChAT were found in many regions of AD brain compared to those of control brains (Koshimura et al., 1988). Such findings suggest not only a possible loss of enzyme protein (decrease in Vmax), but also a change in the conformation of the remaining enzyme molecules (change in Km). Similar studies on the kinetics of ChAT can be performed in vitro using the currently described protocols simply by varying the concentration of choline in the BS. On the other hand, kinetics for choline uptake in postmortem brain is extremely difficult to perform owing to the fact that fresh tissue is required to conduct such uptake studies. It should certainly be possible to use cell culture model systems, and the protocols described here to investigate such kinetics, as evident from our data that HACU in differentiated SK-N-SH cells is saturable and follows Michaelis Menten kinetics, with an estimated Km of approximately 2-3 μM and a Vmax of about 190 pmoles per hour.
4. Experimental procedure
4.1. Materials required for HACU and ChAT assays
4.1.1. Cell culture
SK-N-SH cells were obtained from American Type Cell Culture (ATCC) and plated in 24/48 well plates. Other cell lines can also be tested in the same way.
4.1.2. Special equipment
Inverted phase contrast microscope (Leica DMIL HC) (Leica Microsystems GmbH, Wetzler, Germany)
Both [3H] and [14C] signals are determined using a Beckman model LS 3801 liquid scintillation spectrometer. Tritium is counted using a lower window setting of 0, and an upper window setting or 1000. [14C] is counted using a lower window setting of 400, and an upper window setting of 1000. These latter settings eliminate any overlap of tritium into the [14C] window, thus allowing determination of[14C] used in the ChAT assay without interference from the tritium in the same sample from the HACU procedure. Disintegrations per minute (DPM) are determined from standard quench curves for [3H] and [14C] respectively, using the H# software of the scintillation spectrometer, and a predetermined standard curve for each radionuclide. The average efficiency for counting [3H] is approximately 37%. The average efficiency for counting [14C] is about 91%.
Veritas luminometer (Turner Biosystem, Sunnyvale, CA, USA) to obtain luminescence signals from CTG assay.
4.1.3. Other standard equipment
100 mm tissue culture plates (Corning Incorporated, Corning, NY, USA; Cat#430167)
24-well tissue culture plates (Corning; Cat#3526) (6-well and 48-wells can also be used)
96-well flat bottom white polystyrene plates (Corning; Cat#3688)
96-well flat bottom polystyrene plate with lid for protein assay (Corning, Cat#3599)
50 and 15 ml polyethylene (PE) tubes. (Corning, Cat# 430828; 430052 respectively)
Pasteur pipettes (Fisher Scientific, Pittsburgh, PA, USA; Cat# 13-678-30)
Improved neubauer hemocytometer for counting cells.
Polyethylene counting vials (Research Products, International Corp, Mount Prospect, IL, USA; Cat# 125501)
4.1.4. Chemicals and reagents
Dulbecco’s Phosphate Buffer Saline (DPBS) (Cellgro/ Mediatech, Manassas, VA, USA; Cat# 20-031-CV)
Minimum Essential medium (MEM) (Sigma, St.Louis, MO, USA; Cat# M4655)
Fetal bovine serum (Atlanta Biologicals, Lawrenceville, GA, USA; Cat# S11050H)
Penicillin-Streptomycin-AmphotericinB (Cellgro/ Mediatech; Cat# 30-004-Cl) or sometimes simply called as “antibiotic mixture”
All-trans Retinoic acid (ATRA) (Sigma; Cat# R2625) or sometimes simply called as RA
Trypsin EDTA (Cellgro/ Mediatech; Cat# 25-051-Cl)
Filtered 0.9%, (0.154 M) Normal saline (Sigma; Cat# S3014)
0.154 M Potassium chloride (KCl) (Sigma; Cat# P4504)
0.11 M Calcium chloride (CaCl2) (Sigma; Cat# C3881)
0.1M Sodium hydrogen phosphate (Na2HPO4) (Sigma; Cat# 71638)
0.154 M Magnesium sulphate (MgSO4) (Sigma; Cat# M-2773)
Dextrose (Sigma; Cat# G-5767)
Hemicholinium-3 (HC-3) (Sigma; Cat# H108)
[3H] Choline chloride (Perkin Elmer, Boston, MA, USA)
Trypan blue (Sigma; Cat# T-8154)
Mammalian protein extraction buffer (M-PER) (Pierce, Rockford, IL, USA; Product#78505)
CTG reagent (Promega, Fitchburg, WI, USA; Cat#G7572)
Protein assay reagent (BioRad, Hercules, CA, USA; Cat#500-0006).
ChAT buffer substrate (the exact composition is shown in table 2)
[14C] acetyl CoA (Perkin Elmer)
Eserine hemisulphate (Sigma; Cat#E8625)
Choline chloride (Sigma; Cat# C7527)
EDTA (Sigma; Cat#ED2SS)
0.05 M Hydrochloric acid (HCl) (Sigma; Cat# 84435)
Sodium tetraphenyl boron (Strem chemicals, Newburyport, MA, USA; Cat# 93-057)
3-Heptanone (MP Biomedicals LLC, Solon, OH, USA; Cat# 195217)
Biodegradable counting cocktail (Econo-Safe) (Research Products, International Corp; Cat#111175)
Table 2.
Ingredients and their relative proportions to prepare ChAT buffer substrate
| Concentration in ChAT Buffer Substrate | Final concentration in assay |
|---|---|
| 60 mM Sodium phosphate buffer, pH 7.4 | 42.9 mM |
| 0.2 mM EDTA (tetrasodium) | 0.14 mM |
| 12 mM choline chloride | 8.6 mM |
| 0.12 mM eserine sulfate | 0.086 mM |
| 240 mM NaCl | 171 mM |
| 0.15 mM [14C]-acetylcoenzyme A | 0.11 mM |
4.2. Detailed procedure
Measurement of HACU
4.2.1. Preparation of cell culture media
Fifty (50) ml of FBS is mixed with 500 ml of MEM to make 10% serum containing media. Antibiotic mixture (5.5 ml) is added to the media. To induce differentiation, 10 μM ATRA is added to the 10% serum containing media. ATRA is light sensitive and must be added in the dark.
4.2.2. Preparation of cells
Human SK-N-SH cells are removed from -150°C freezer and plated in 100 mm plates with 10% FBS and antibiotic containing MEM media as described previously (Lahiri et al., 1999). Regular 10% FBS containing media is replaced by ATRA containing media once the cells became 70% confluent. After 5 days, the regular medium is removed, and the cells are trypsinized from the plate by adding 5ml of trypsin-EDTA solution. After 15 minutes, the trypsinized cells are gently pipetted out from the wells. The cell suspension is kept in a 15 ml polyethylene tube. The tube is centrifuged at 100g for 5 minutes. The trypsin-EDTA solution is aspirated and the cell pellet is re-suspended with 5ml of ATRA containing media and triturated gently with a fire polished Pasteur pipette to prevent clumping of cells. Suspended cells are counted in a hemocytometer by Trypan blue exclusion method. One hundred thousand (100,000) cells are plated in each well of a 24-well plate, and 500 μl of ATRA containing media is added to each well. Cell numbers can be adjusted accordingly for 12-well or 48-well plates. HACU assay is carried out two days after plating the cells.
4.2.3. Preparation of normal Krebs buffer
Krebs buffer is a mixture of NaCl, KCl, CaCl2, Na2HPO4, MgSO4 and dextrose. The exact composition of Krebs buffer is shown in table 1.
Table 1.
shows ingredients of Krebs buffer required for HACU experiment
| Stock Solution | Volume Used | Final Concentration |
|---|---|---|
| 0.154 M NaCl | 100 ml | 122 mM |
| 0.154 M KCl | 4.0 ml | 4.9 mM |
| 0.11 M CaCl2 | 1.5 ml | 1.3 mM |
| 0.1 M Na2HPO4 | 20 ml | 15.8 M |
| 0.154 M MgSO4 | 1.0 ml | 1.2 mM |
The volumes shown in the table can be changed proportionately to prepare smaller or larger volumes of the Krebsbuffer.
To the above, 2 mg/ml of glucose is added to give a final concentration of ll mM
4.2.4. Preparation of Krebs-HC-3 buffer
To make Krebs buffer containing 100 μM HC-3, 6 mg of HC-3 is dissolved in sterile distilled water to make a 10 mM stock solution. Eighty (80) μl of the stock solution is added to 7.92 ml (1: 100 dilutions) of normal Krebs buffer. The 10 mM HC-3 stock solution can be stored at -20°C but should be used within 7 days.
4.2.5. Preparation of [3H] choline
The stock solution (66.7 Ci/mmole; 1 mCi/ml) is diluted 1:50 with normal Krebs buffer. For a typical experiment with 24 wells, 12 μl of the stock solution is mixed with 588μl of normal Krebs buffer.
4.2.6. Addition of normal Krebs and Krebs-HC-3 buffer into the wells
Growth media from the each well is aspirated gently and 500 μl of room temperature DPBS is added gently to each well of the 24-well plate. The DPBS is then aspirated gently and served as a single wash step. DPBS wash is required for complete removal of growth medium from the wells prior to conducting the HACU assay. Afterwards, 500 μl of Krebs buffer is added to each well designated for uptake and the same volume of Krebs-HC-3 buffer is added to each well designated for the hemicholinium blank. A schematic of uptake and HC-3 blank is shown in figure 1.
Figure 1.
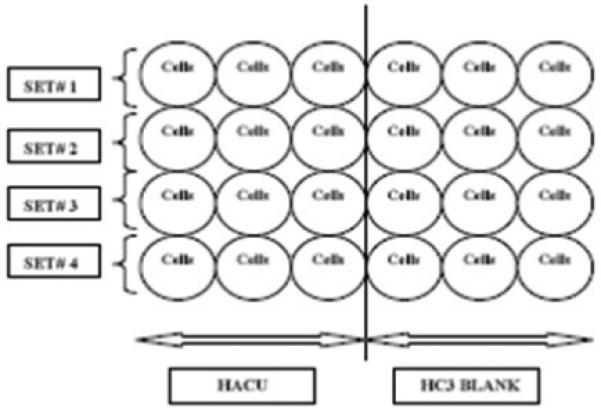
Schematic showing a 24-well plate with cells where HACU experiment can be carried out. In a 24-well plate, four sets (conditions) of experiments can be performed (for each set n=3). In every set, first three wells are assigned for HACU and the next three wells are allocated for hemicholinium (HC-3) blanks. In this way, one row of the 24-well plate can serve as a single set (condition) of experiment. Alternatively, one can increase (n) by decreasing the sets or conditions.
4.2.7. Uptake of [3H] choline chloride by the cells
Twenty (20) μl of previously prepared [3H] choline chloride is added to each well. While pipetting [3H] choline, an attempt is made to keep the tip of the pipette close to the surface of the buffer so that radioactive choline does not touch the wall of the wells. Following addition of [3H] choline, the plate is incubated in a 37°C water bath oscillating at 50 cycles per minute for one hour. This temperature and time of uptake is critical in this procedure (see results section).
4.2.8. Removal of [3H] choline from the wells and washing
To terminate the uptake, the incubation media was gently aspirated from the wells (this liquid contains radioactive [3H] choline and should be considered as radioactive waste material). Following aspiration of the incubation media, ice cold DPBS (750 μl) is added gently and subsequently removed by aspiration. This DPBS wash is necessary to remove traces of [3H] choline that may be adhering to the wells. It is important to add more DPBS (i.e. 700-750 μl) than the volume of [3H] choline containing buffer (500μl). This step is included in order to wash [3H] choline off from the walls of the wells. The plate is then viewed under an inverted microscope to assess any cell loss or morphological changes during washing (Figure: 2).
Figure 2.
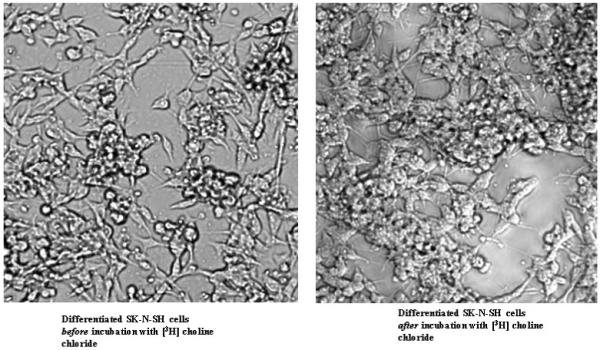
Images of seven days differentiated human SK-N-SH cells before (left) and after (right) the uptake experiment are shown as 10x magnification. Relative density of the cells is fairly similar for both conditions, i.e. there was no significant cell loss during the procedure. This is also confirmed by CTG data.
4.2.9. Lysis of cells
One hundred (100) μl of MPER buffer is added to each well of the plate and the plate is shaken in a shaker at 75 cycles per minute for 10 minutes. While shaking, the plate should be placed on an ice containing tray to minimize degradation of ATP.
4.2.10. Cell viability (CTG) assay
CTG assay measures the ATP concentration of the lysate and corresponds to the number of viable cells (Crouch et al., 1993). Thirty (30) μl of cell lysate from each well is taken and placed in a 96-well flat bottom white polystyrene plate. An equal volume (30μl) of CTG buffer is then added to each well. The plate is shaken in a shaker on ice for 10 minutes. Quantitative luminescence signals are obtained using a luminometer. CTG numbers are one of the adjustment parameters used to determine net choline uptake. Alternatively, 5μl of the lysate can be used to determine the protein concentrations in each uptake well, and can be considered as an adjustment parameter as well.
4.2.11. Determination of [3H] radioactivity in the lysate
Fifty (50) μl of the lysate both from uptake and HC-3 (blank) wells were placed into polyethylene scintillation vials. Twenty (20) μl of the 1:50 [3H] choline used in the uptake assay is also placed in a vial in order to determine the amount of radioactivity added per well in each experiment. Five (5) ml of biodegradable counting cocktail is added to each vial and radioactivity is measured in a scintillation counter. Fifteen (15) μl of the remaining lysates from all the uptake wells are placed in marked 1.5 ml plastic microfuge tubes for ChAT activity measurement. Measurement of ChAT activity can be performed on the same day; otherwise the lysate must be stored at -80°C and should be used within one month.
4.2.12. Determination of net uptake by differentiated SK-N-SH cells
Raw disintegration per minute (DPM) for uptake and HC-3 wells are adjusted with the corresponding relative CTG value to obtain relative DPM for each well. Average of DPM values of HC-3 blanks is subtracted from each uptake well to determine net uptake for each well. Figure 3 shows the calculations mentioned above. The rationale for adjusting the uptake values using CTG is that CTG provides a measure of ATP content of the cell, which correlates directly with cell number. Hence any variation in cell number will be reflected in the CTG value. Furthermore, HACU is known to be an energy dependent process requiring ATP (Simon et al., 1976). DPM values for the direct radioactive count indicates the total radioactive choline added to each well, and may be used to calculate the final extracellular concentration of choline present during the uptake procedure. Except for the experiment described in figure 7, we used 8-13 nM choline chloride in all other uptake experiments.
Figure 3.
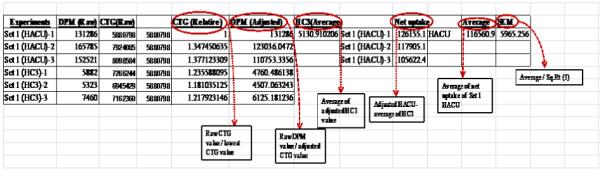
This shows the calculations involved in determining the net choline uptake in cultured cells. Raw DPM values were adjusted by CTG to nullify well to well cell number variability. To determine net choline uptake, adjusted DPM value of the individual uptake well was subtracted by the average of all hemicholinium-3 (blank) wells.
Measurement of ChAT activity
4.2.13. Preparation of ChAT buffer substrate and sodium tetraphenylboron/3heptanone solution
ChAT buffer substrate (BS) is prepared as per composition shown in table 2. BS can be aliquoted and stored at -20°C for future use. Sodium tetraphenylboron is dissolved in 3 heptanone at 30mg/ml. For example, if there are 24 samples and 100 μl of sodium tetraphenylboron/3 heptanone is to be added to each tube, one should make 2500 μl or 2.5 ml of the solution. To do this, 30 × 2.5=75 mg of sodium tetraphenylboron is dissolved in 2.5 ml of 3 heptanone.
4.2.14. ChAT enzyme assay
The enzyme assay is performed in 1.5 ml plastic microfuge tubes in duplicate or triplicate. Frozen cell lystes remaining after radioactivity measurement in the HACU procedure are thawed on ice before the experiment and 4 μl of the lysates were transferred to new 1.5 ml microfuge tubes. If the procedure is performed on the same day as HACU, 4 μl of the lysate can be transferred into new 1.5 ml microfuge tubes kept on ice. Microfuge tubes containing the lysates must always be kept on ice to maintain the integrity of the enzyme (ChAT). Ten microliter (10 μl) of ChAT BS is added to each tube and gently vortexed. The tubes are incubated in a 37°C water bath oscillating at 50 cycles per minute for 60 minutes. After 60 minutes the tubes are returned to ice and 25 μl of 0.05 M HCl is added to each tube to stop the reaction. Once the reaction is stopped, 100 μl of sodium tetraphenolboron/3-heptanone (30 mg/ml) solution is added to each tube and the tubes are vortexed for 10 seconds followed by centrifugation for 2 minutes at 1200 g. Centrifugation separates the fluid within the microfuge tube into two layers; top organic (clear) and bottom aqueous (turbid) which is shown in figure 4. Ninety (90) μl of the top organic layer is pipetted out from the microfuge tube and transferred to polyethylene scintillation vials. Bio-degradable counting cocktail (5ml) is added to each vial and radioactivity is measured by scintillation spectrometry. Raw radioactivity signals (DPM value) are adjusted in the same way as for HACU by relative CTG or protein concentration as described above (figure 3). In this regard, we observed a direct linear relationship between the protein content of the cell culture and the CTG value.
Figure 4.
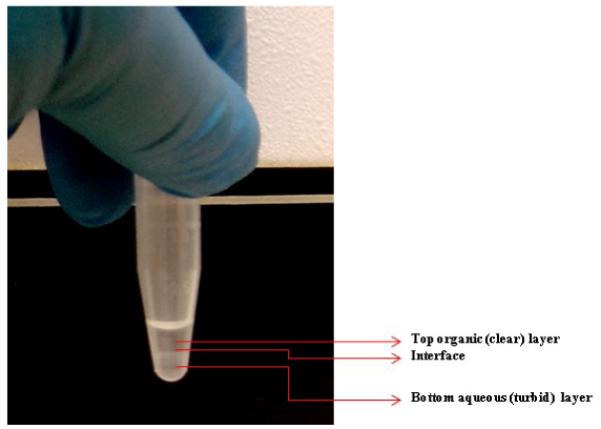
The ‘biphasic’ liquid obtained in ChAT enzyme assay. The clear top portion (organic phase) contains [14C]-ACh for radioactivity measurement.
4.3. Trouble shooting
4.3.1 Trouble shooting the HACU assay
A key factor for a successful HACU procedure is to make sure that the “adherent” cultured cells are not washed out from the plates during the wash procedures. Microscopic examination of the cells before and after the procedure is recommended to evaluate any gross change in cell number. Since the net uptake is adjusted by the cell viability (CTG assay) at the end of the procedure, a minor variation in the cell number from well to well will not adversely affect the results. However, if the majority of the cells are washed out, the raw DPM for HACU will be close to that of the HC-3 blank. After choline uptake, one should ensure that most of the cells are lysed as incomplete lysis will produce erroneous results.
If the Krebs buffer should turn cloudy, this is generally an indication that the CaCl2 and/or the phosphate buffer may be made incorrectly, or added incorrectly. The cloudy nature usually results from insoluble calcium phosphate formation. In this case, fresh CaCl2 and phosphate buffer should be prepared and used. Krebs buffer that has turned cloudy should never be used in the HACU procedure.
If considerable variability is noted during the HACU procedure, one may wish to prepare the incubation media already containing the [3H]-choline, rather than adding 20 μl of the radiolableld substrate to each well. Finally, if sample to blank ratios decline over time, one should check the purity of the radioactive choline, as well as the integrity of the HC-3 solution.
4.3.2. Trouble shooting the ChAT assay
Care must be taken when removing the top organic layer for assessment of [14C]-ACh synthesis. If this is a problem, one can always adjust the volume taken, and simply include this adjustment in the calculations. Thus, instead of removing 90 μl out of the 100 μl of organic phase, one could sample take 75 μl, or even 50 μl of the organic phase, and account for this in the calculations at the end of the experiment. Finally, care must be exercised in setting the windows of the scintillation spectrometer. Since there is tritium present at the time of the [14C] based ChAT assay, it is important to eliminate or minimize the contribution of this tritium. This can be accomplished by setting the lower window at an energy level high enough to omit tritium, and thus count only [14C].
4.3.3. Alternative and support protocols
Although the protocol described here is based on performing HACU and ChAT assays in the same population of cells, it is possible to conduct the two assays on cells grown in separate wells. Thus, some cells would be used for HACU, while others would be used for ChAT. In our protocol, assay values have been normalized to cell numbers as assessed by CTG). Another support protocol includes normalization to protein instead of cell number.
4.4. Time required
For HACU (Culture of cells not included)
Preparation of buffers (0.5 h)
Incubation of tritiated choline chloride with cells (1 h)
Lysis of the cells (0.25 h)
Cell viability/Cell titer glo (CTG) assay (0.5 h)
Radioactivity measurement (1-2 h, depends upon the number of samples)
For ChAT
Preparation of buffer (0.5 h)
Incubation of ChAT buffer substrate (14C) with cell lysate (1 h)
Extraction of 14C-ACh (0.5-1 h, depends upon the number of samples)
Radioactivity measurement (1-2 h, depends upon the number of samples)
4.5. Quick procedure
4.5.1. HACU assay
Aspirate growth media from the well and gently wash the cells 1x with DPBS.
Add Krebs and Krebs-HC-3 buffer in appropriate uptake and blank wells, respectively.
Add appropriate amount of [3H] choline chloride in all the wells. Incubate the cell culture plate in 37°C water bath oscillating at 50 cycles per minute for 60 minutes.
Return plate back to ice, and remove the buffer from all wells and wash the wells gently 1x with ice cold DPBS.
Add 100 μl of MPER or other lysis buffer to the wells and shake the plate in a shaker on ice.
Take 30μl of the cell lysate for CTG assay and 50 μl to the scintillation vials for radioactivity measurement. Store 10 μl of the lysate at -80°C for ChAT assay (ChAT assay can be done on the same day as well).
Adjust raw DPM value with the CTG reading to obtain adjusted uptake.
Subtract HC-3 blank values from total uptake values to obtain net HACU values.
If desired, convert net HACU values to pmoles by using the specific radioactivity of the [3H] choline.
The remaining cell lysate can be utilized for Bradford protein assay and other experiments, such as western blotting.
4.5.2. ChAT assay
Take 4 μl of the cell lysate into 1.5 ml microfuge tubes and add 10 μl of ChAT BS.
Incubate the microfuge tubes in 37°C water bath oscillating at 50 cycles per minute for 60 minutes.
Stop the reaction by adding 25 μl of 0.05 M HCl.
Add 100 μl of sodium tetraphenolboron/3-heptanone (30 mg/ml) solution to each tube, and vortex for 10 seconds.
Centrifuge the tubes at 12000 g for two minutes.
Collect the clear top layer and measure [14C] radioactivity in scintillation counter.
Adjust the raw DPM values with CTG/protein content, and any aliquot factor.
ACKNOWLEDGEMENTS
We thank Jason Bailey and Justin Long. This work was supported by grants from Alzheimer’s Associations (Zenith Award); and the National Institutes of Health (AG18379 and AG18884) to DKL.
Footnotes
Publisher's Disclaimer: This is a PDF file of an unedited manuscript that has been accepted for publication. As a service to our customers we are providing this early version of the manuscript. The manuscript will undergo copyediting, typesetting, and review of the resulting proof before it is published in its final citable form. Please note that during the production process errors may be discovered which could affect the content, and all legal disclaimers that apply to the journal pertain.
References
- Apparsundaram S, Ferguson SM, George AL, Jr., Blakely RD. Molecular cloning of a human, hemicholinium-3-sensitive choline transporter. Biochem Biophys Res Commun. 2000;276:862–7. doi: 10.1006/bbrc.2000.3561. [DOI] [PubMed] [Google Scholar]
- Bennett KM, Hoelting C, Martin CP, Stoll J. Estrogen effects on high-affinity choline uptake in primary cultures of rat basal forebrain. Neurochem Res. 2009;34:205–14. doi: 10.1007/s11064-008-9746-1. [DOI] [PubMed] [Google Scholar]
- Birks J, Grimley Evans J, Iakovidou V, Tsolaki M, Holt FE. Rivastigmine for Alzheimer’s disease. Cochrane Database Syst Rev. 2009 doi: 10.1002/14651858.CD001191. CD001191. [DOI] [PubMed] [Google Scholar]
- Crouch SP, Kozlowski R, Slater KJ, Fletcher J. The use of ATP bioluminescence as a measure of cell proliferation and cytotoxicity. J Immunol Methods. 1993;160:81–8. doi: 10.1016/0022-1759(93)90011-u. [DOI] [PubMed] [Google Scholar]
- Fonnum F. Recent developments in biochemical investigations of cholinergic transmission. Brain Res. 1973;62:497–507. doi: 10.1016/0006-8993(73)90714-2. [DOI] [PubMed] [Google Scholar]
- Ginsberg SD, Che S, Wuu J, Counts SE, Mufson EJ. Down regulation of trk but not p75NTR gene expression in single cholinergic basal forebrain neurons mark the progression of Alzheimer’s disease. J Neurochem. 2006;97:475–87. doi: 10.1111/j.1471-4159.2006.03764.x. [DOI] [PubMed] [Google Scholar]
- Lahiri DK, Nall C, Ge YW. Promoter activity of the beta-amyloid precursor protein gene is negatively modulated by an upstream regulatory element. Brain Res Mol Brain Res. 1999;71:32–41. doi: 10.1016/s0169-328x(99)00150-3. [DOI] [PubMed] [Google Scholar]
- Lahiri DK, Farlow MR, Sambamurti K, Greig NH, Giacobini E, Schneider LS. A critical analysis of new molecular targets and strategies for drug developments in Alzheimer’s disease. Curr Drug Targets. 2003;4:97–112. doi: 10.2174/1389450033346957. [DOI] [PubMed] [Google Scholar]
- Pizzi M, Boroni F, Bianchetti A, Moraitis C, Sarnico I, Benarese M, Goffi F, Valerio A, Spano P. Expression of functional NR1/NR2B-type NMDA receptors in neuronally differentiated SK-N-SH human cell line. Eur J Neurosci. 2002;16:2342–50. doi: 10.1046/j.1460-9568.2002.02403.x. [DOI] [PubMed] [Google Scholar]
- Simon JR, Kuhar MG. Impulse-flow regulation of high affinity choline uptake in brain cholinergic nerve terminals. Nature. 1975;255:162–3. doi: 10.1038/255162a0. [DOI] [PubMed] [Google Scholar]
- Simon JR, Atweh S, Kuhar MJ. Sodium-dependent high affinity choline uptake: a regulatory step in the synthesis of acetylcholine. J Neurochem. 1976;26:909–22. doi: 10.1111/j.1471-4159.1976.tb06472.x. [DOI] [PubMed] [Google Scholar]
- Wainwright LJ, Lasorella A, Iavarone A. Distinct mechanisms of cell cycle arrest control the decision between differentiation and senescence in human neuroblastoma cells. Proc Natl Acad Sci U S A. 2001;98:9396–400. doi: 10.1073/pnas.161288698. [DOI] [PMC free article] [PubMed] [Google Scholar]