Abstract
Certain bipolar cells in most species immunostain for GABA or its synthesizing enzyme, GAD. However it is unknown whether they actually release GABA, and if so, from which cellular compartment, and by what release mechanism. We investigated these questions in monkey retina where rod bipolar cells immunostain for GABA. We found that rod bipolar cells immunostain for one isoform of GAD, GAD65, in their somas, dendrites, and axon terminals. Near the fovea, the somatic stain of rod bipolar cells is weaker than that of horizontal cells, but at the periphery, it is stronger. Staining for the vesicular GABA transporter in monkey rod bipolar cells is negative. On the other hand, staining for the GABA transporter, GAT3, is positive in the soma and primary dendrites (but not in the axon terminals). Staining for GAT3 is also positive in horizontal cells. Double staining of rod bipolar cells and the alpha subunit of the GABAA receptor, reveals scarce GABAA puncta that appose rod bipolar dendrites. We conclude that monkey rod bipolar cells use GABA, and discuss the possibility that they tonically release GABA from their dendrites using a reverse action of GAT3.
Keywords: GABA, VGAT, GAT3, co-transmission, horizontal cells
The old dogma of “Dale’s principle” stating that a single neuron releases a single neurotransmitter has been violated repeatedly. Many neurons are now known to co-release a fast neurotransmitter with a modulator (Brecha et al., 1981; Vaney & Young, 1988; Casini & Brecha, 1992; Nusbaum et al., 2001; Salio et al., 2006), two inhibitory neurotransmitters (Jonas et al., 1998), or even a fast excitatory and a fast inhibitory neurotransmitter (O'Malley et al., 1992; Thind & Goldsmith, 1995; Walker et al., 2001). In retina, bipolar cells collect input from photoreceptors and signal to ganglion cells using glutamate as their primary neurotransmitter (Slaughter & Miller, 1983; Massey & Miller, 1988; reviewed by Massey, 1990). However, certain bipolar cells in almost every species contain GABA or its rate limiting synthesizing enzyme, GAD. This includes salamander (Yang & Yazulla, 1994; Yang, 1998), frog (Mosinger et al., 1986; Agardh et al., 1987a), mudpuppy (Mosinger et al., 1986), cat (Wässle & Chun, 1989; Pourcho & Owczarzak, 1989; Vardi & Auerbach, 1995), ferret (unpublished observations), monkey (Agardh et al., 1987b; Grünert & Wässle, 1990), and man (Agardh et al., 1987b; reviewed by Freed, 1992). In salamander and cat, the same bipolar cells that contain GABA also express GAD and a GABA transporter (GAT in salamander and VGAT in cat, Yang & Yazulla, 1994; Yang, 1998; Kao et al., 2004).
Since GABA-containing bipolar cells are so prevalent, it is important to understand their function. For that, one needs to know which GABA-associated molecules are expressed, what is the cell type, and what is its circuit. Some of these issues have been addressed in salamander, where the presumed GABAergic bipolar cells were identified as several types of ON and OFF bipolar cells (Yang, 1997); and in cat where they were identified as two types of OFF bipolar cells (Kao et al., 2004). These questions have not been addressed in monkey where the GABA-containing bipolar cells have been identified as a subset of rod bipolar cells, and it is unknown whether or not these cells express any GABA-associated proteins (Martin & Grünert, 1992). To get further insight into the possible function of the GABAergic bipolar cells, we explored the monkey retina where bipolar circuits have been well studied. Here we show that monkey rod bipolar cells, and also horizontal cells, express GAD65 and GAT3. In rod bipolar cells, GAT3 expression is restricted to somas and primary dendrites, raising the possibility that GABA is released from dendrites rather than from axons.
MATERIALS & METHODS
Immunostaining
All figures are from the rhesus monkey (Macaca mulatta), but some experiments were also performed on the crab-eating monkey (Macaca fasciularis). Fixed retinas were obtained from Covance Research Products Inc. (Alice, TX) following unrelated experiments. The retinas were fixed with 2–4% paraformaldehyde for 30–60 min at room temperature (RT), cryoprotected with 30% sucrose, embedded in a mixture of Tissue Freezing Medium (Electron Microscopy Sciences, Ft. Washington, PA) and 20% sucrose (1:2), and cryosectioned at 10–18 µm. Changes of staining pattern across different eccentricities were explored using a long piece of retina (5×12 mm extending from 1.5 mm nasal to fovea to far periphery) embedded in agar, placed vertically in Tissue Freezing Medium on a microtome metal chuck, frozen with liquid nitrogen, and cryosectioned. For cell counting, similar but shorter pieces were embedded in agar and sectioned with a Vibratome. Sections were preincubated in 0.1M phosphate buffer containing 5% sucrose, 10% normal goat serum, 2–3% bovine serum albumin, 0.01% sodium azide and 0.5% Triton X-100 (blocking buffer) for 1 hour at RT. They were then incubated in primary antibodies diluted in blocking buffer for 3 days at 4 °C, rinsed, incubated in secondary antibodies for 3 hours at RT, rinsed and mounted in Vectashield (Vector Laboratories, Burlingame, CA). For double labeling, both primary antibodies were applied simultaneously. Sections were imaged either with a Leica or Olympus confocal microscope. All images were taken with the default pinhole (of one airy disk) calculated by the confocal microscopes. Thus for 100x NA 1.4 (Leica) and 60x NA 1.42 (Olympus) objectives the z-resolutions was 500–600 nm; and for 40x NA 1.25 (Lieca) and 40x NA 1.3 (Olympus) it was 650–750 nm. All images were captured with at least 1024 pixels. Thus, for high resolution images taken under 60x (olympus) the pixel size was either 0.211 µm/pixel when the zoom value was 1, or half or third that value when the zoom was 2 or 3. For display, images were contrast adjusted with Adobe Photoshop 7.0 (Adobe Systems, San Jose, CA). Unless otherwise indicated in figure legends, all images are from a single confocal plan.
Antibodies
Monoclonal mouse-anti-GAD65 (GAD-6, 1:10, Developmental Studies Hybridoma Bank, University of Iowa, Iowa City, IA, contract N01-HD-6–2915) has been established to be specific in several species including monkey retina (Vardi et al., 1994; Vardi & Auerbach, 1995; Johnson & Vardi, 1998). Polyclonal rabbit-anti-VGAT, raised against 99 amino acids located at the N-terminus (1:100; gift of Robert Edwards, University of San Francisco, CA), has been established to be specific (Chaudhry et al., 1998) and has been used on retinas of several species including monkey and human (Haverkamp et al., 2000; Cueva et al., 2002; Jellali et al., 2002; Kao et al., 2004). Rabbit-anti-GAT3, raised against amino acid residues 607–627 of rat GAT3 (1:175, Sigma), and guinea pig-anti-GAT3, raised against the last 115 amino acids of the rat C-terminus (1:500, gift of Nathan Nelson, Tel Aviv University, Israel; previously named NTT4) (Jursky & Nelson, 1999a; Jursky & Nelson, 1999b) gave almost identical staining patterns and are therefore likely to be specific (see results). Mouse anti-α1 subunit of the GABAA receptor (bd24; Developmental Studies Hybridoma Bank, University of Iowa, Iowa City, IA) has been established to be specific in retinas of several species (Vardi et al., 1992; Vardi & Sterling, 1994; Greferath et al., 1994; Greferath et al., 1995; Koulen et al., 1996). The following antibodies were used as cell type markers. Rabbit-anti-PKCα (1:1000, Sigma, St. Louis, MO) and mouse anti-PKCα (1:20, Sigma) mark rod bipolar cells (Greferath et al., 1990). Mouse-anti-parvalbumin (PV) made against protein purified from fish muscle (1:3000 from Chemicon Temecula California) and rabbit anti-parvalbumin made against protein purified from rat muscle (1:2000 from Swant Bellinzona Switzerland) mark horizontal cells in monkey retina (Röhrenbeck et al., 1987; Röhrenbeck et al., 1989). Mouse anti-Gαo was raised against purified bovine protein ( MAB3073, clone 2A from Millipore) mark ON bipolar somas and dendrites (Vardi et al., 1993; Vardi, 1998; Dhingra et al., 2000; Dhingra et al., 2002). The following secondary antibodies were from Jackson ImmunoResearch Lab (West Grove, PA) or Molecular Probes (Eugene, OR): goat anti-rabbit-Cy3 (1:300); goat anti-mouse-Cy3 (1:300); goat anti-rabbit-Alexa488 (1:100); goat anti-mouse-Alexa488 (1:100); goat anti-guinea pig-Alexa488 (1:100), and goat anti-mouse F(ab) fragments (1:50).
Cell counts
Cell density was counted from 100 µm thick Vibratome sections stained for GAD65. Confocal optical sections were collected with a Z-step of 1 µm; stained somas were traced and projected onto the horizontal plane. To estimate the percent colocalization of two stains at the somas, we first looked at the marker stain (with the aid of Fluoview 1000) and identified each soma through the Z-stack. We counted all the somas stained with the marker, then looked at the other stain and counted those somas that showed this stain, and then checked if there were any “new” somas that stained only for the marker. To assess precise membrane-associated colocalization of PKC and GAT3, images were imported into Matlab, which gave the intensity values along any particular Y level.
Subcloning of GAT3
GAT3 mRNA was amplified by RT-PCR from whole retinal RNA prepared using a Nucleospin RNA II kit (Clontech). Reverse transcription was performed on 1µg of total RNA with oligo-dT primers using Moloney murine leukemia virus reverse transcriptase (BD Biosciences). For this PCR, the forward primer was: 5’- cat gac ggc gga gaa gg –,3’ and the reverse primer was: 5’-caa gca agc ccc tac cat ta-3’. PCRs used 35 cycles (94°C for 1 min, 58°C for 30 s, and 72°C for 3 min) and were performed on a programmable thermocycler (PerkinElmer Life and Analytical Sciences). The PCR product was then subcloned into pcDNA3.1 using pcDNA3.1/V5-His TOPO TA expression vector (Invitrogen) to yield GAT3 pcDNA3.1.
Cell culture and transfection
Human embryonic kidney (HEK) 293 cells were cultured at 37°C in a 5% CO2 incubator in Dulbecco’s minimal essential medium supplemented with Penstrep (Invitrogen) and 10% heat-inactivated fetal bovine serum. Approximately 50% confluent cells were transiently transfected with GAT3 pcDNA 3.1 using Fugene transfection reagent (Invitrogen). Cells were harvested 48 h later.
RESULTS
Rod bipolar cells in monkey retina express GAD65
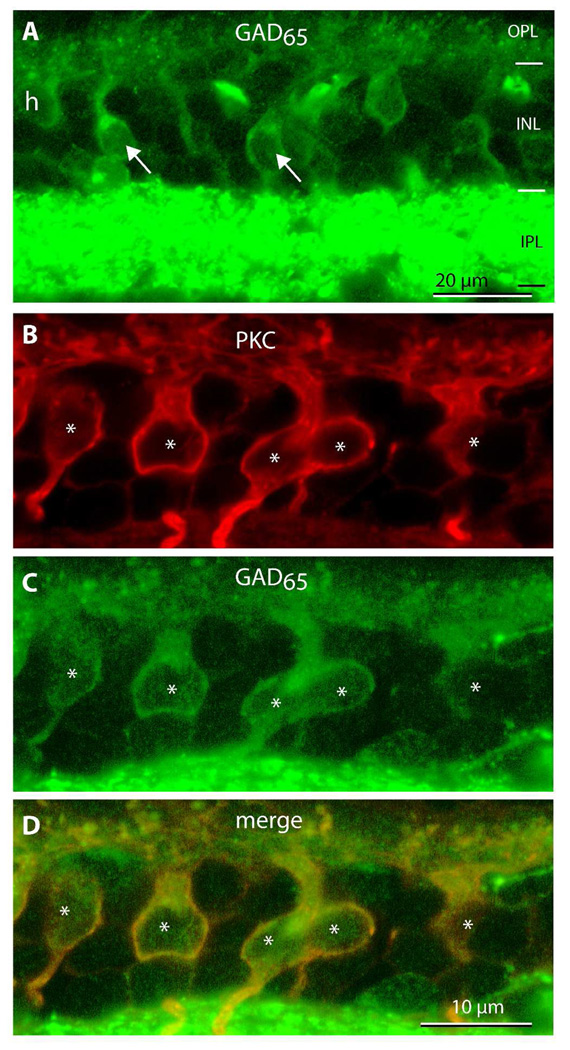
Martin and Grünert (1992) observed immunoreactivity for GABA in certain bipolar cells in monkey retina, and identified them as rod bipolar cells. To determine whether any bipolar cell type expresses GAD (and thus is likely to synthetize GABA), we immunostained monkey retina with two antibodies specific for the two isoforms of GAD (GAD65, and GAD67). No bipolar cells stained for GAD67 (not shown), but certain bipolar somas stained for GAD65 (Fig. 1A).
Figure 1. Rod bipolar cells in monkey express GAD65.
A. Certain bipolar cells (arrows) contain the GABA-synthesizing enzyme GAD65. OPL, outer plexiform layer; INL, inner nuclear layer; IPL inner plexiform layer. h, possible horizontal cell soma.
B–D. Double labeling for PKC (red) and GAD65 (green). In this view, all PKC-positive somas (*) stain for GAD65 (imaged under 40x zoom 2).
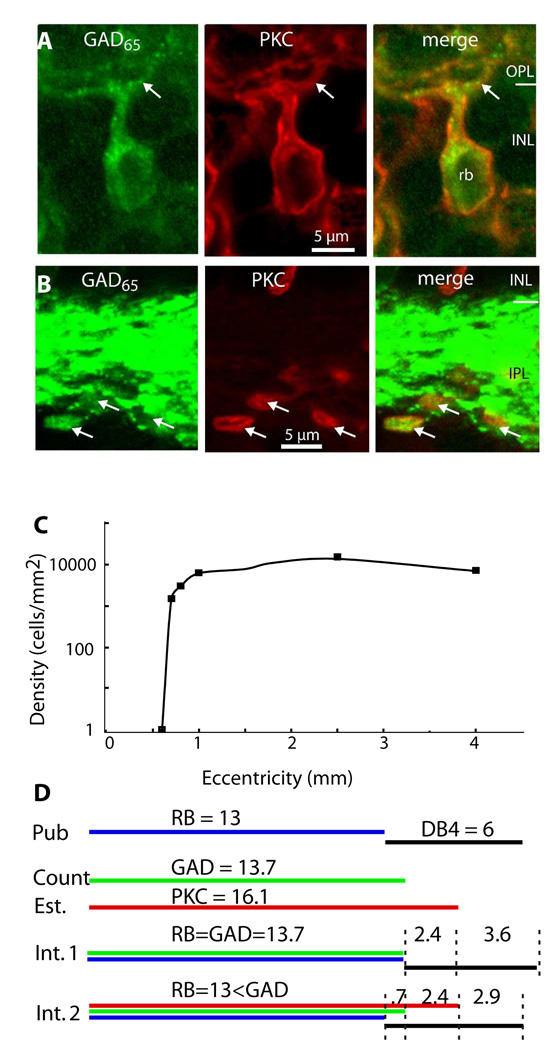
To determine if these GAD65-positive bipolar cells are indeed rod bipolar cells, we next costained with an antibody against the alpha subunit of protein kinase C (PKC). In monkey, anti-PKC marks rod bipolar cells strongly and one type of cone bipolar cell (DB4) weakly (Grünert et al., 1994; Mills and Massey, 1999). We found that all GAD65-stained bipolar cells (n=93) were positive for PKC (Fig. 1B–D), but only about 88% of PKC-positive bipolar cells were also positive for GAD65 (out of 103 PKC-positive cells, 93 were GAD65-positive). Within the rod bipolar cell, staining for GAD65 was positive in the somas, dendrites and axon terminals (Fig. 2A, B). Unlike PKC staining that often outlined the cell soma and axon terminal, GAD65 staining filled the cell, indicating that the enzyme localizes to the cytosol.
Figure 2. GAD65 staining is present in rod bipolar dendrites and axon terminals.
A. Double labeling for GAD65 (green) and PKC (red). A rod bipolar soma (rb; interpreted to be so by the strong PKC staining) and its dendritic arbor (arrow) stain for GAD65. (Imaged under 40x zoom 2.)
B. Many PKC-labeled axon terminals stain for GAD65 (arrows). The GAD65 staining in rod bipolar axon terminals is much fainter than that in GABA-ergic amacrine cells, so demonstrating it resulted in saturation of strongly stained regions. However, the low background staining near these terminals allowed their faint stain to have a good contrast. The left arrow points to a strongly GAD65-stained axon terminal while the right arrow points to a weakly or unstained terminal. Note that the PKC staining in A and B tends to outline the cell while the GAD65 staining concentrates within the cytosol (imaged under 100x)
C. Density of GAD65-positive bipolar cells vs. retinal eccentricity. Density was measured from serial radial Vibratome sections that extend temporally from the center of the foveal dip (0 mm eccentricity). This profile is typical for rod bipolar cells.
D. Possible interpretations of the staining. Density numbers (in thousands) are at around 1.5–2.5 mm eccentricity. Pub: published data estimates the density of rod bipolar cells (blue line) at 13,000 cells/mm2 and of DB4 cells (black line) at 6,000. Count: Peak density of GAD65- stained bipolar cells in this study (green line) was 13,700 cells/mm2. Est.: Estimated PKC-stained cell density (red line) at the same eccentricity that has the peak GAD65 stained cell density was 16,100 cells/mm2. Int. 1: The first interpretation is that all GAD65-stained bipolar cells are rod bipolar cells (green=blue). Then DB4 cells constitute a fraction (<50%) that stains for PKC (red and black) and a larger fraction that remains unstained (black alone). Int. 2: The second interpretation is that a small fraction of the GAD65-stained cells are DB4 cells so these cells are co-stained for GAD65 and PKC (green, red, and black); another fraction of DB4 cells stains for PKC alone (red and black), and another fraction does not stain for either antibody (black alone).
The colocalization of GAD65 with PKC raises the possibility that not only rod bipolar cells, but also DB4 cells express GAD65. To assess this possibility we estimated the density of GAD65-stained bipolar cells at different eccentricities. The fovea was devoid of GAD65-stained bipolar cells. The density sharply increased at 0.5mm eccentricity and reached a peak of 13,700 cells/mm2 at 2.5 mm eccentricity (Fig. 2C). Since this profile follows the previously published density profile of rod bipolar cells (Grünert et al., 1994), our data suggests that in monkey, all rod bipolar cells and no DB4 cone bipolar cells express GAD65 (Fig. 2D, first interpretation).
This interpretation suggests that our PKC staining is incomplete as we now explain. We counted 13,700 cells/mm2 GAD65-stained bipolar somas at their peak density and found that this number represented 85% of PKC-stained cells. If GAD65-stained cells represent rod bipolar cells alone, then we would estimate that PKC-stained cells are at a density of 16,100 cells/mm2 (13,700/0.85). If anti-PKC stained all DB4 cells, our calculation predicts the density of DB4 cells to be 2,400 cells/mm2, much lower than the 6,000 cells/mm2 estimated for these cells at this eccentricity by Grünert et al (1994). Thus we conclude that many DB4 cells remain unstained for PKC. This should not be surprising given that the staining of DB4 cells by anti-PKC was realized only after several publications assumed it was a rod bipolar-specific marker.
It is also likely that GAD65 staining is not complete since the detection of staining in bipolar or horizontal cells was highly dependent on the fixation and the antibody concentration, and since the intensity of staining varied with eccentricity (see below). Thus, it is quite possible that we underestimated the number of GAD65-stained bipolar cells. If that is the case, we should be open to the possibility that DB4 cells weakly expresses GAD65 (Fig. 2D, second interpretation). We conclude that rod bipolar cells express GAD65, and DB4 bipolar cells may express it weakly.
Expression of GAD65-pattern in the OPL varies dramatically across eccentricities
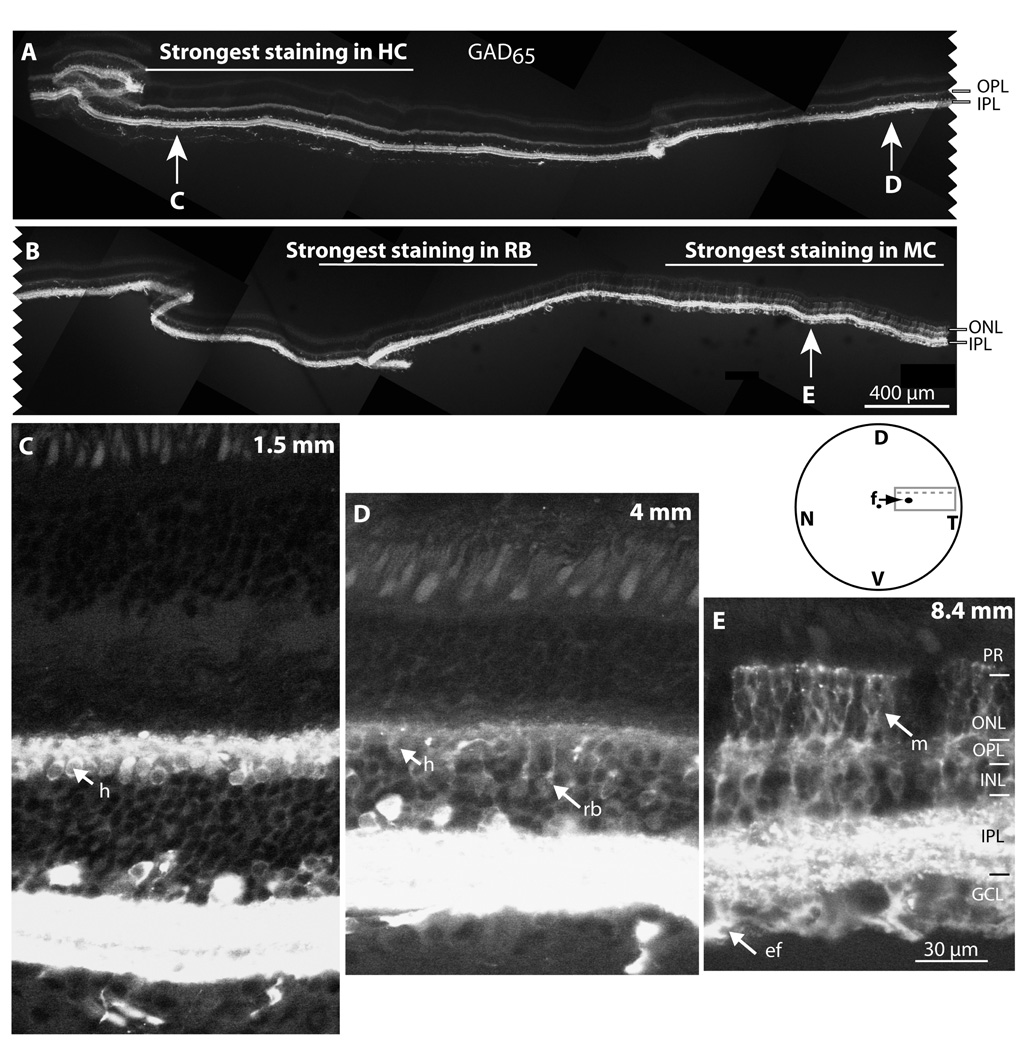
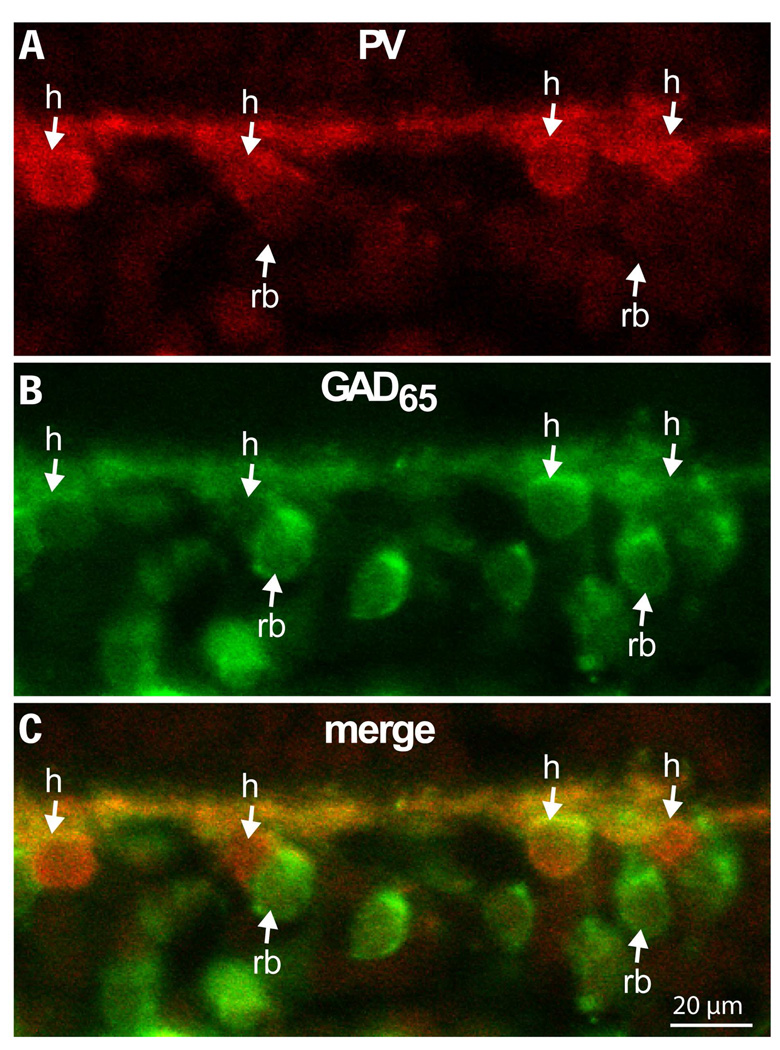
Close observation of GAD65- and PKC- labeled sections often showed near complete colocalization of the two stains in the OPL. This was surprising since we expected to see horizontal cell processes that stained for GAD65 but not for PKC. To better understand this staining, we examined retinal sections that stretched from near the fovea to a 9 mm eccentricity (Fig. 3A, B). GAD65 staining in horizontal cells was strong near the fovea (Fig. 3C) and gradually weakened out toward the periphery. The reverse was true for rod bipolar cells where GAD65 staining was weak near the fovea and stronger at the periphery (Fig. 3D). Comparing GAD65 staining in horizontal cells (identified by parvalbumin) to that in rod bipolar cells revealed that near the fovea, horizontal cells stained more strongly than rod bipolar cell somas, but at 7 mm eccentricity, rod bipolar cells stained more strongly (Fig. 4). Another cell type that varied in GAD65 staining with eccentricity was the Müller cell. In the center these cells were totally unstained, but at 7.8 mm eccentricity, a few cells with strong puncta at the outer limiting membrane became stained. This labeling gradually increased and by 8.4 mm eccentricity, staining in Müller cells in the outer retina became dominant (Fig. 3E). The same results were observed in both Macaca mullata (2 retinas) and Macaca facicularis (2 retinas). Thus, GAD65 expression shifts from being mainly in horizontal cells near the fovea, to mainly in rod bipolar cells at the middle, to Müller cells at the far periphery.
Figure 3. In the outer retina, GAD65 expression shifts from being mainly in horizontal cells, to rod bipolar cells, to Müller cells.
A, B. A composite picture of a cryostat section stained for GAD65. Left edge of A is 2 mm dorsal and nasal to fovea; right edge of A connects to left edge of B; right edge in B is 9 mm temporal. From center to periphery, staining intensity in the OPL gradually decreases and Müller cell staining increases. Section was fixed in 4% paraformaldehyde for 30 min, and photographed under 10x objective. Inset (not to scale) shows the retinal piece that was embedded in agar (solid gray rectangle) and the location of the cryostat section (dotted gray line). N, nasal; T, temporal, D, dorsal; V, ventral. Arrow points to fovea (f). C–E. Higher magnification at the three eccentricities marked by the arrows in A and B (each panel is a projection of 2 confocal plans). In C (1.5 mm eccentricity), horizontal cell somas (h) are strongly stained, and rod bipolar cell staining is below detection levels in this relatively well fixed retina. In D (4 mm eccentricity), both horizontal cell somas (h) and bipolar cell somas (rb) stain clearly. In E (8.4 mm eccentricity), horizontal cells are difficult to recognize, but bipolar cells and Müller cells (m) are strongly stained. PR, photoreceptors; ONL, outer nuclear layer; GCL, ganglion cell layer; m, Müller cell vertical process; ef, Müller cell end foot. Images were processed independently, and cannot be compared.
Figure 4. At mid retina, GAD65 staining in rod bipolar cells appears stronger than in horizontal cells.
Double labeling for parvalbumin (red, marks horizontal cells) and GAD65 (green) at 7 mm eccentricity. Down arrows point to horizontal cell somas (h) while up arrows point to rod bipolar somas (rb). Of the four horizontal cell somas shown in the figure, three stain more weakly for GAD65 than the adjacent rod bipolar cell somas (imaged under 40x).
Rod bipolar cells express GAT3 but not VGAT
We next determined if rod bipolar cells express other proteins involved in GABA transmission, such as VGAT (a vesicular GABA transporter that packages GABA into synaptic vesicles and is expressed in cat GABA-containing bipolar cells; Kao et al., 2004) and GAT3 (a plasma membrane GABA transporter). In both Macaca species, an antibody against the N terminus of VGAT gave staining that was restricted to the inner plexiform layer with neither horizontal cells nor bipolar cell somas being stained (Fig. 5A). A different antibody (against the whole protein) has been reported to stain the tips of horizontal cell processes but not bipolar cell processes in the macaque monkey (Haverkamp et al., 2000). To test if VGAT might be present in bipolar axon terminals, we double-stained for PKC and VGAT and found that rod bipolar axons and axon terminals were devoid of VGAT staining (Fig. 5B–D). There was however strong VGAT staining in puncta around the bipolar terminals; these are most likely GABAergic amacrine processes that feed back onto rod bipolar axon terminals.
Figure 5. The rod bipolar cell does not contain VGAT.
A. VGAT staining. Only the IPL stains above background, while the INL and OPL remain unstained.
B–D. Higher magnification of IPL (from a different section) stained for PKC (red) and VGAT (green). Rod bipolar descending axons (arrowhead) and their terminals (*) are devoid of VGAT staining. VGAT staining is found however around the axon terminals (arrows), presumably in GABAergic amacrine varicosities (imaged under 100x).
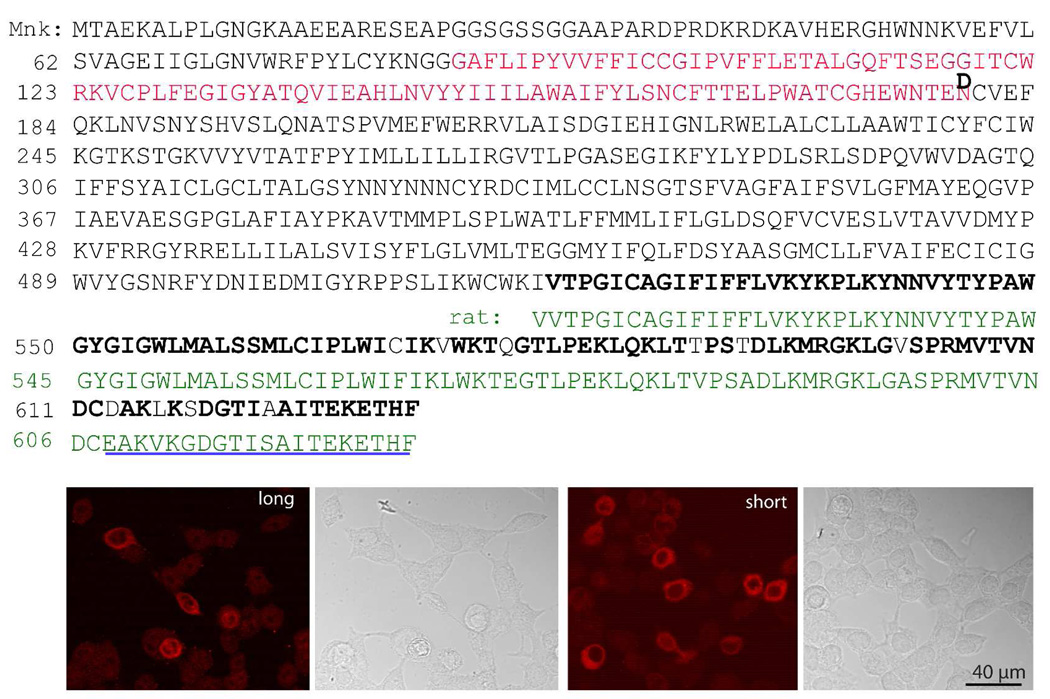
To determine localization of the membrane GABA transporter GAT3, we used antibodies against the C-terminus of rat GAT3, which is similar but not identical to monkey GAT3. To test whether these antibodies recognized the monkey GAT3, we first performed RT-PCR from monkey retina, subcloned the product, and then sequenced 5 clones. This revealed two splice variants: a known full transcript of 2103 bp encoding 632 aa (sequenced from 4 clones; accession number: NM_001134952), and a shorter variant encoding 539 aa (sequenced from 1 clone; accession number: EU864115). These clones were used to transfect HEK cells and these cells were then immunostained with the anti-GAT3 antibodies. We found that both clones were recognized by the antibodies (Fig. 6). Untransfected HEK cells remained unstained. When the antibodies were applied to Western blots, all samples tried, monkey retina, HEK cells transfected with either clone, and untransfected HEK cells, showed a band at around 40 kDa (and occasionally a faint band at around 60 kDa), suggesting these antibodies do not work on the denatured protein (Supplemental figure 1).
Figure 6. Anti-GAT3 antibodies are specific.
Top. GAT3 protein sequence as interpreted from sequencing of the RT-PCR product. Two splice variants were identified by RT-PCR: a long sequence that is identical to accession NM_001134952, and a new short variant (deposited in EU864115) that is missing 93 amino acids (red residues) and differs in one amino acid (D instead of N). The guinea pig antibody was raised against rat C-terminus (green residues) where most of the sequence in monkey is conserved (bolded residues). The rabbit antibody was raised against the last 20 amino acids (underlined).
Bottom. Images of HEK cells transfected with either the long or the short splice variant and immunoreacted with the rabbit anti-GAT3. The DIC images to the right of the fluorescent images were taken from the same fields and they show that untransfected cells were unstained.
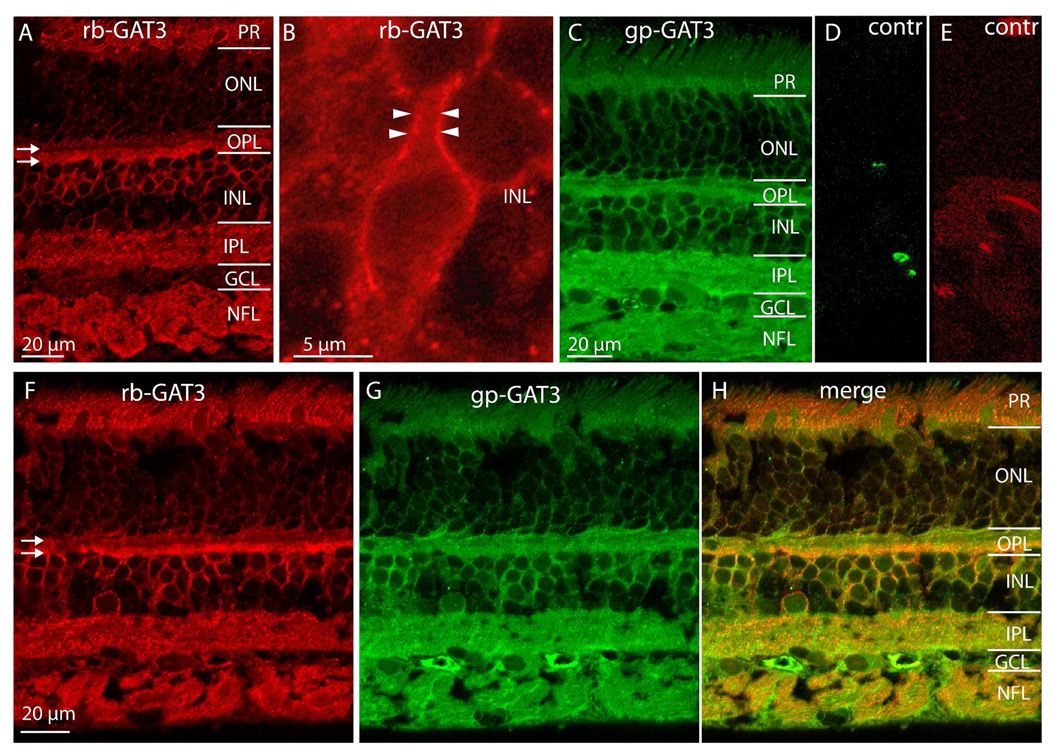
In monkey retina, GAT3 staining (with a rabbit antibody that was raised against the last 20 amino acids) appeared in the inner plexiform layer, the upper tiers of the inner nuclear layer, and the outer plexiform layer (Fig. 7A). In the inner nuclear layer, the two lower tiers, where Müller cells and amacrine cells reside, remained largely unstained with only a few amacrine cell bodies labeled. The two upper tiers however, where rod bipolar and horizontal cell somas reside, were strongly stained. Higher magnification of this region sometimes allowed resolution of membrane- versus cytosol-associated staining and we could see that the stain appeared stronger at the plasma membrane (Fig. 7B). In the outer plexiform layer, staining separated into two bands; a stronger band at the interface with the inner nuclear layer (where horizontal cells send their lateral processes), and a fainter one above it. Photoreceptor inner segments were also stained. The staining pattern did not change with eccentricity.
Figure 7. GAT3 is expressed in the OPL, in the upper tiers of the INL, and in the IPL.
A. Rabbit (rb) anti-GAT3 stains photoreceptor inner segments, OPL, somas located high in the INL, IPL, and NFL. In the OPL, two strata appear stained (arrows) with the lower one being more intense.
B. Higher magnification of the INL shows a bipolar cell soma with its primary dendrite. GAT3 stain associates mainly with the plasma membrane. The thick dendrite permits resolving the strong membrane-associated staining (arrowheads) from the weak cytosolic stain in the middle.
C. Staining pattern of guinea pig (gp) anti-GAT3 resembles that of rabbit anti-GAT3.
D–E. Controls for double staining in F–H. Retinas were incubated either with rabbit anti-GAT3 followed by anti-guinea pig conjugated to Alexa 488 (D) or with guinea pig anti-GAT3 followed by anti-rabbit conjugated to Cy3. Neither secondary antibody recognized the wrong species. Note that contrast was greatly enhanced to enable high sensitivity.
F–H. Double staining with both GAT3 antibodies. Every structure in INL and IPL that stains with the rabbit antibody (red) also stains with the guinea pig antibody (green). NFL, nerve fiber layer.
We verified that this staining was GAT3-specific by using a second antibody that was raised in guinea pig against 115 amino acids of the C-terminus (Jursky & Nelson, 1999a). Labeling with this antibody gave a staining pattern similar to that of the previous antibody (Fig. 7C). Moreover, double-staining the same section with both antibodies showed that every cell and cell compartment that stained with one antibody also stained with the other (Fig. 7F–H). Control experiments verified that the secondary antibodies did not cross react with the inappropriate primary antibodies (Fig. 7D, E). These results suggest that the staining we observe for GAT3 is genuine. In subsequent experiments we used the antibody raised in rabbit.
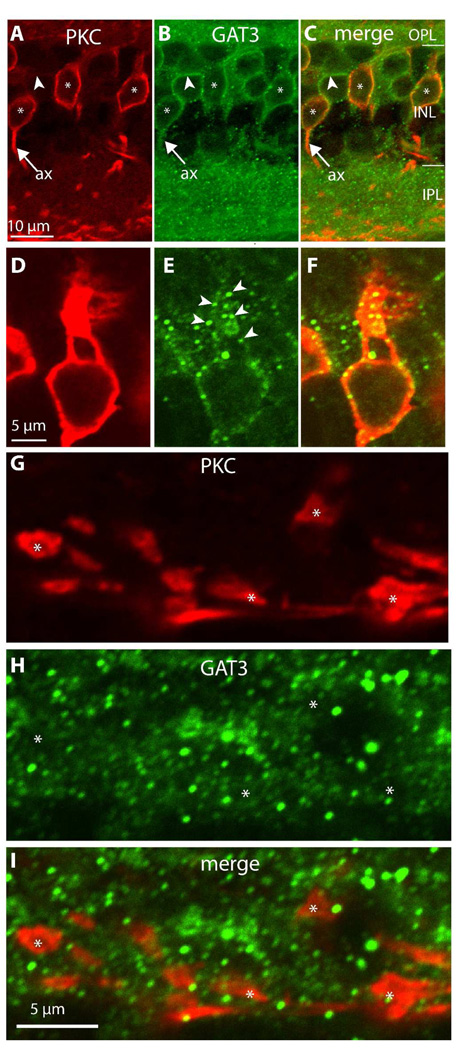
To test if rod bipolar cells in particular express GAT3, we used anti-PKC to mark these cells and found that 72 out of 75 PKC-positive bipolar somas stained for GAT3, suggesting that all rod bipolar cells express GAT3 (Fig. 8A–C). In rat, staining for GAT3 appears in Muller cell processes that wrap bipolar and photoreceptor (Guo et al., 2009), so a concern was raised that the staining we see is around the rod bipolar cells rather than within it. We are convinced this is not the case because we do not see radial processes crossing all layers which is the signature morphology of Muller cells; Muller end feet remain unstained; faint staining can be seen within the rod bipolar cell and around its nucleus (e.g., Fig 7B and Fig 8E); and finally, occasionally when two adjacent somas are stained, it is possible to see the membrane of each cell while the space in between, where Muller cells cross through, is devoid of stain (see the starred cells in figure 10 below). We further ensured that the GAT3-staining is within the bipolar cells and not in Muller cells by recording the staining intensities of PKC and GAT3 stained retinas along several levels of the INL (9 images, 3 levels each). Such intensity profiles showed that the two stains peak precisely at the same pixel, suggesting GAT3 is within the rod bipolar cell (Supplemental Figure 2). Within a rod bipolar cells, the primary dendrites stained for GAT3, but the dendritic tips did not (Fig. 8D–F). Occasionally the initial axons were stained, but their axon terminals were always devoid of staining (Fig 8G–I).
Figure 8. Rod bipolar cells express GAT3.
Double staining for PKC and GAT3.
A–C. Somas (*) and occasionally initial axons (ax) of rod bipolar cells, identified by strong PKC-staining (red), stain for GAT3 (green). Certain GAT3-labeled cells were negative for PKC (arrowhead lies inside the cell and points to the stained membrane).
D–F. Higher magnification of PKC-positive and GAD65-positive cell shows that the primary dendrite is stained. Note that the stain is restricted to clusters along the dendrite’s plasma membrane (arrowheads) (imaged under 100x).
G–I. Rod bipolar axon terminals (*) do not stain for GAT3 (imaged under 60x zoom 4).
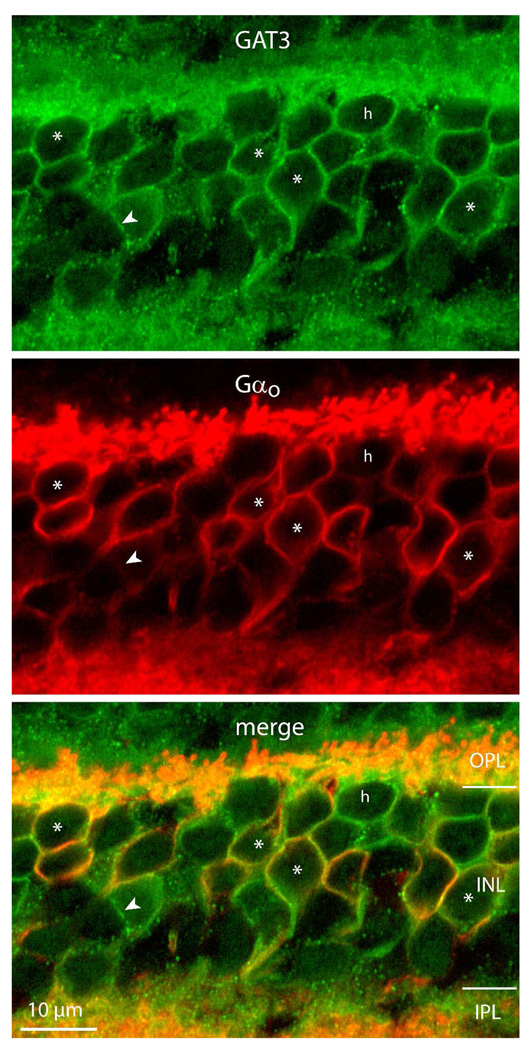
Figure 10. ON cone bipolar cells also express GAT3.
Double labeling for GAT3 and Gαo (marks ON bipolar cells). The two proteins colocalize in most ON bipolar somas (*). There are certain GAT3-positive cells that do not stain for Gαo; those that are located in the upper tier of the INL are likely horizontal cells (h), those in the middle tier (arrowheads) may be ON bipolar cells weakly stained for Gαo or OFF bipolar cells. Müller cells reside between the ON bipolar cells and amacrine cells appeared unstained (imaged under 100x).
Horizontal cells and ON bipolar cells also express GAT3
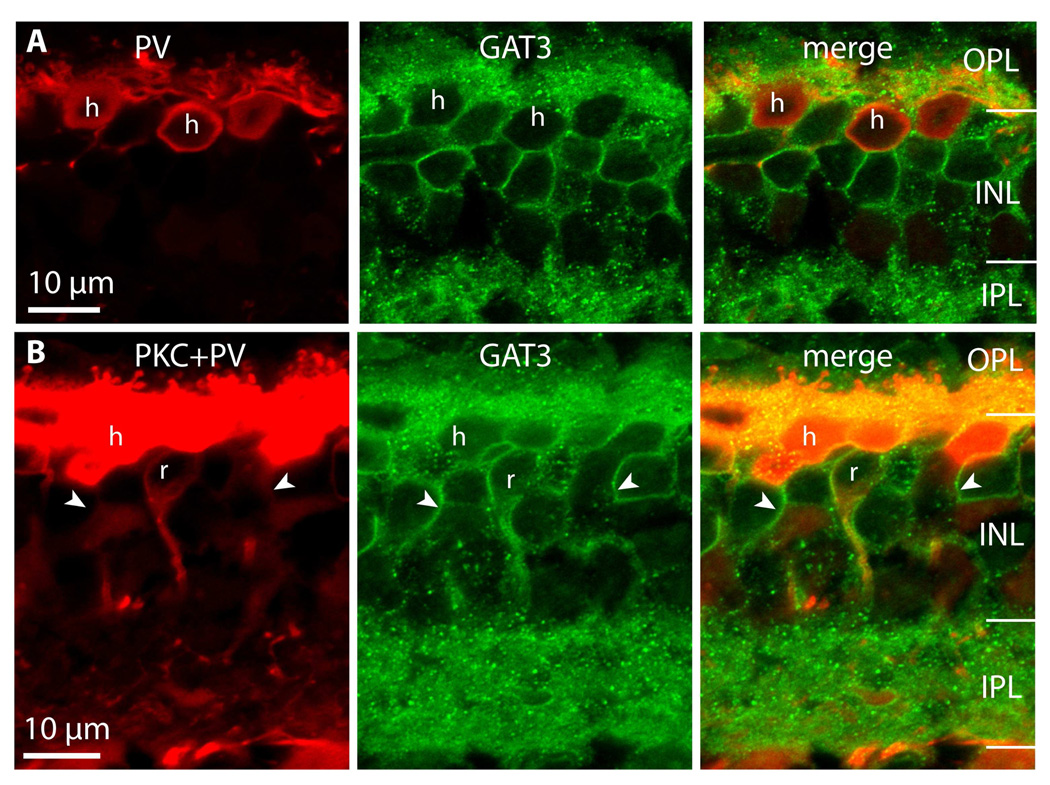
Although all rod bipolar cells (PKC-positive) stained for GAT3, not all GAT3-positive cells were rod bipolar cells (arrowheads in Fig. 8B). Since these GAT3-positive somas lay high in the outer plexiform layer, they could be horizontal cells or another type of bipolar cell. To determine which, we marked horizontal cells with an antibody against parvalbumin and found that most somas and processes in the outer plexiform layer that stained for parvalbumin also stained for GAT3 (Fig. 9A). Thus we confirm that horizontal cells express GAT3. To determine if rod bipolar and horizontal cells account for all GAT3-stained cells, we triple labeled for PKC, PV (both in red), and GAT3. This triple stain revealed GAT3-labeled cells that were neither rod bipolar cells nor horizontal cells (Fig. 9B, arrowheads). Labeling with anti-Gαo, which marks ON bipolar cells, showed that many of these cells were ON bipolar cells (Fig. 10). As with horizontal cells, certain sections of their cell membrane stained weakly or not at all. We did find however that there were a few cells that were only GAT3-positive. This may result from incomplete somatic staining with anti-Gαo or from the existence of other cell types that express GAT3 in monkey retina.
Figure 9. Horizontal cells express GAT3.
A. Double labeling for parvalbumin (PV, red) and GAT3 (green). Horizontal cell somas (h) stain for GAT3. (Imaged under 100x)
B. Triple staining for PKC+PV (red) and GAT3 (green). GAT3 labels both horizontal cells (h) and rod bipolar cells (r), but certain GAT3-positive cells belong to neither of these cell types (arrowhead lies inside the cell and points to the stained membrane) (imaged under 10x zoom 2).
GABAA receptors lie in close proximity to PKC-stained dendrites
Since the dendrites of rod bipolar cells stain for GAT3 but their axon terminals do not, we speculated that the dendrites release GABA. If so, GABAA receptors should lie postsynaptic to these dendrites. We could not assess the proximity of GABAA receptors to rod bipolar dendrites by co-staining for GAT3 and GAD65 since both antibodies were raised in mouse and our control experiments showed cross reaction. Also, other antibodies against GABAA receptors did not reveal staining in monkey OPL. So, we double labeled for PKC and GABAA receptor and carefully looked at the location of the staining.
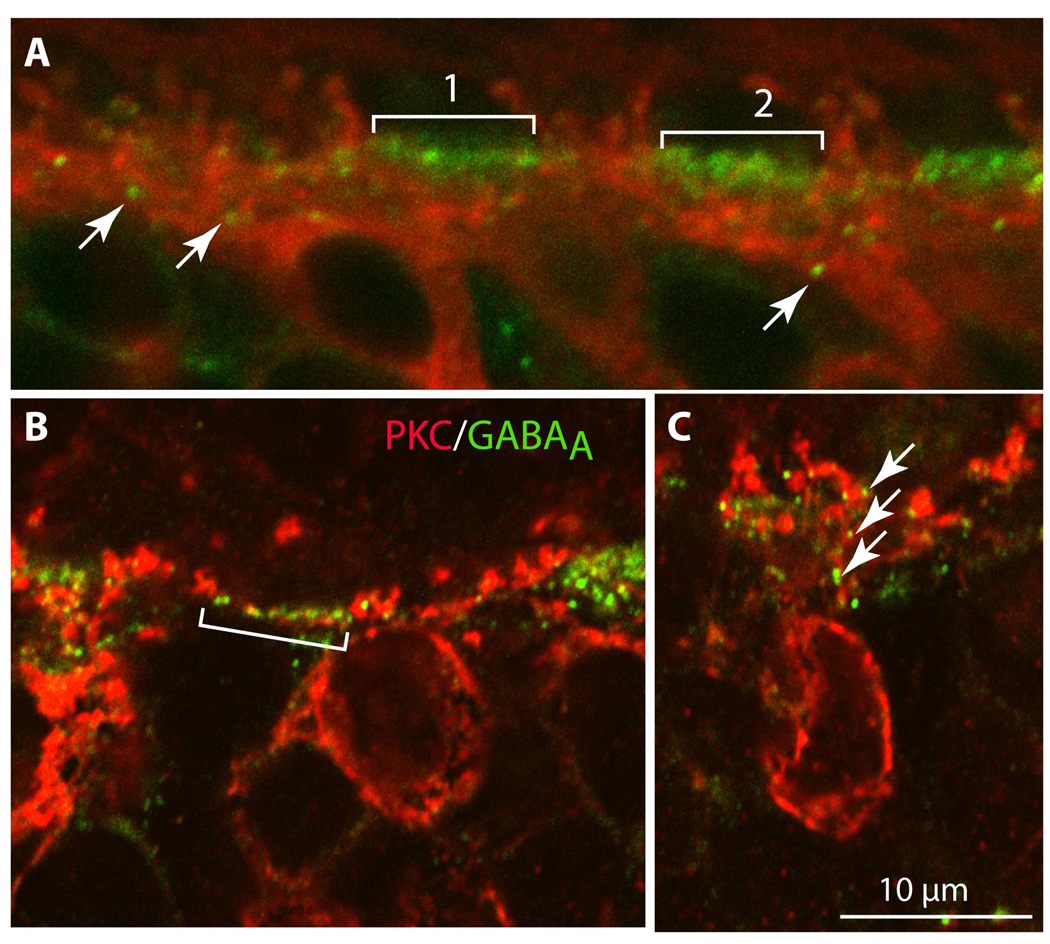
GABAA receptors are known to cluster just beneath cone pedicles, localizing to cone bipolar dendrites (Vardi & Sterling, 1994; Haverkamp et al., 2000). Since rod bipolar dendrites are not expected in the vicinity of cones, they should not appose these GABAA puncta. Double labeling for PKC and GABAA receptor showed that, indeed, in many regions of the outer plexiform layer, the PKC-stained dendrites that ascended to rod spherules passed between GABAA clusters (Fig. 11A). However, there were numerous examples of GABAA puncta intermingled with PKC-stained dendrites within a GABAA cluster. These PKC-positive dendrites could belong to DB4 or midget ON bipolar cells (Sulaiman et al, 2009); an example of a few PKC-stained dendrites is shown under pedicle 2 in Fig. 11A. We also observed GABAA puncta along an ascending primary dendrite of a PKC-stained cell (Fig. 11A–C); from the intensity and location of the staining, this dendrite appears to belong to a rod bipolar cell. However, this sighting was rare. In summary, our experiments suggest that rod bipolar dendrites occasionally appose GABAA receptors, but we currently lack the tools to determine whether these appositions represent unconventional synapses.
Figure 11. GABAA receptors are positioned in close proximity to PKC-stained dendrites in the OPL.
Double staining for PKC (red) and the α1 subunit of the GABAA receptor (green). In the first bracket in A, a string of GABAA receptor puncta (green) is flanked by red ascending rod bipolar dendrites that do not come in close proximity to them. In the second bracket, it is possible to see some red dendrites threading their way between the green puncta; these may be the dendrites of DB4 or other ON cone bipolar cells. In B, GABAA puncta (green in the bracket) are assembled in a row and are interspersed with red dots that appear to be a laterally ascending bipolar cell dendrite. In C, GABAA puncta (arrows) lie in close proximity to an ascending rod bipolar dendrite (imaged under 60x zoom 3).
DISCUSSION
Bipolar cells express GABAergic markers
We demonstrate here that, consistent with their immunoreactivity for GABA (Martin and Grünert, 1992), monkey rod bipolar cells express GAD65 and GAT3. The expression pattern of GAT3 is likely genuine because: a) GAT3-transfected HEK cells were stained while untransfected HEK cells were not stained by the anti-GAT3; b) two different antibodies against this protein gave specific staining in HEK cells; c) both antibodies gave identical staining in retina; and d) the staining in retina was associated with the plasma membrane. Since GABAergic markers have been found in the bipolar cells of many species (including lower vertebrates and mammals), GABA transmission by bipolar cells may be a common mechanism in retinal processing. If so, one would expect that the GABA-containing bipolar cell across species is a similar type. However, in salamander, the presumed GABAergic bipolar cells belong to several types of ON and OFF cells (Yang, 1997). In cat, they belong to two types of OFF cells (Kao et al., 2004), and in monkey, they are rod bipolar cells, and possibly DB4 cone bipolar cells. These differences suggest that the function of GABA in bipolar cells is species-specific. Possibly, bipolar cells release GABA tonically, and the particular cell type that engages in this release depends on time of activity of the species: in monkey, a diurnal species, the release is mediated by ON bipolar cells; in cat, a nocturnal species, by OFF bipolar cells; while in salamander, a crepuscular species, by ON and OFF bipolar.
If bipolar cells do release GABA, which cell compartment do they use for this release? In salamander, axon terminals of the GABAergic bipolar cells contain more conventional synapses than other axon terminals, and application of high potassium to bipolar dendrites elicits not only excitatory but also inhibitory postsynaptic potentials in some ganglion cells, suggesting that release occurs from the axon terminal (Yang & Wang, 1999; Yang et al., 2003). In monkey, the bipolar dendrites make better candidates because GAT3, which may serve to transport GABA out of the cells (see discussion on horizontal cells), was found there but was absent from the axon terminals. Similarly in cat, GABA-containing bipolar cells were well stained for VGAT in their dendrites (Kao et al., 2004). Precedents for transmitter release from dendrites have been found in the past (Zilberter et al., 1999; Isaacson, 2001; Ludwig & Pittman, 2003). GABA may be released from monkey bipolar dendrites after a long period of light adaptation, when the cells are continuously depolarized and accumulate sodium, exactly the conditions that lead to reverse GAT3 action. What such release onto cone bipolar cells might do is difficult to speculate. Alternatively, rod bipolar cells may release GABA for autofeedback, in which case their dendrites would sense it with the GABAC receptor that is slow to desensitize. Indeed GABAC receptor expressed by goldfish bipolar cell axon terminals was shown to be the major sensor of a tonically released GABA (Jones and Palmer, 2009). There though, the mechanism of tonic GABA release was neither from vesicle nor through a reverse action of GAT. The effect of tonic GABA release in bright light, coupled with a non-desensitizing receptor, would be to clamp the rod bipolar potential near ECl. Since rod bipolar cells are predicted to have a relatively high ECl (Vardi et al., 2000; Satoh et al., 2001; Varela et al., 2005), their membrane potential would stay at a depolarized level appropriate for a saturated cell.
Shift in GAD65 expression along different eccentricities
The expression of GAD65 in the outer retina varies with eccentricity. Horizontal cell staining in the parafovea is relatively strong and decreases with eccentricity, while bipolar cell staining is weak and increases with eccentricity. Furthermore, Müller cells, that are unstained in most of the retina, become dominantly labeled at eccentricities farther than 8 mm. The shift in GAD65 expression in horizontal cells agrees with the gradient in GABA-immunoreactivity, where staining is strongest near the fovea, and becomes undetectable beyond 6 mm eccentricity (Grünert & Wässle, 1990). A similar trend is present in rabbit where GAD65 and GABA staining decrease as one proceeds ventrally from the visual streak (Johnson & Vardi, 1998). Possibly GABA’s function in the outer plexiform layer varies with eccentricity. In central vision, where spatial resolution is best, GABA released by horizontal cells onto bipolar cells contributes to the surround inhibition, whereas at farther eccentricities, GABA released from rod bipolar cells provides tonic inhibition. Whether or not Müller cells express GABA markers other than GAD65 (and certain GATs) is unknown, but the notion that Müller cells properties vary with eccentricity is supported by their differential expression of Kir potassium channels (Skatchkov et al., 2001).
Possible mechanisms for GABA release by horizontal cells
After almost three decades of studying retinal horizontal cell function, it remains unclear if and how horizontal cells release GABA. Evidence to support GABA release by monkey horizontal cells includes immunoreactivity to: GABA (Grünert & Wässle, 1990), the GAD65 isoform of the GABA synthesizing enzymes (Vardi et al., 1994), the vesicular GABA transporter, VGAT (Haverkamp et al., 2000), and the plasma membrane GABA transporter, GAT3. Our results for GAT3 localization differ from those of Haverkamp et al. where they did not detect GAT3 in monkey horizontal cells (Haverkamp et al 2000). However their negative results may be due to inadequate fixation or to differences in antibody affinity. GAT3 was also undetected in horizontal cells of rat and mouse (Johnson et al., 1996; Guo et al., 2009), consistent with lack of GABA-staining in these rodents. Further support for horizontal cells being GABAergic comes from findings that three subunits of the ionotropic GABA receptors (α1, β2/3, and rho1) concentrate just below the cone pedicle, sandwiched between horizontal cell processes and their tips (Vardi et al., 1992; Vardi & Sterling, 1994; Haverkamp et al., 2000).
Assuming horizontal cells do release GABA, what could be the release mechanism? The ultrastructure of horizontal cell terminals in most species does not reveal typical aggregates of synaptic vesicles (Stell, 1967; Lasansky, 1980), and in lower vertebrates, the release occurs in a Ca2+-independent manner, suggesting a carrier mechanism (Yazulla & Kleinschmidt, 1983; Ayoub & Lam, 1984; Schwartz, 1987; Attwell et al., 1993). GABA transporters may take up or extrude GABA depending on their reversal potential and that in turn depends on intracellular and extracellular concentrations of GABA, Na+, and Cl− (Richerson & Wu, 2003). Under most physiological conditions, vesicular release of GABA increases its extracellular concentration and GAT, whose reversal potential is around or above the resting membrane potential, takes up GABA and brings it into the cell. However when a neuron is depolarized or contains a relatively high intracellular Na+ concentration, GAT reverses its action to transport Na+, Cl−, and GABA out of the cell (Cammack & Schwartz, 1993; Wu et al., 2006). Such action has been suggested to occur not only in horizontal cells but also in amacrine cells. For example, in chick retina, a major component of the GABA release was reduced by inhibiting GAT1 in the absence of extracellular calcium (Andrade da costa et al 2000; Calaza et al 2006; Maggesissi et al., 2009).
It is possible that horizontal cells use GAT3 to release GABA during long periods of darkness when Na+ constantly flows in through the glutamate receptors and the horizontal cell is relatively depolarized. Horizontal cells also exhibit an unusually high intracellular chloride concentration (Miller & Dacheux, 1983; Djamgoz & Laming, 1987; de la Villa et al., 2003) that can support GABA efflux. An estimate (in mM) of [GABA]i = 0.5; [GABA]o = 0.0001; [Na+]i = 20; [Na+]o = 150; [Cl−]i = 30; [Cl−]i = 135 (modified from Richerson and Wu, 2003 for a dark-adapted horizontal cell) gives a reversal potential of ∼-80 mV. Since this potential is much lower than the horizontal cell membrane potential, under most conditions, horizontal cells would release GABA. The analysis above does not exclude the possibility that horizontal cells also release GABA via a vesicular mechanism. Human horizontal cells do show classical vesicles in the tips of their processes (Linberg & Fisher, 1988), and evidence is mounting that horizontal cells express certain synaptic vesicle proteins, including the vesicular GABA transporter VGAT (Haverkamp et al., 2000; Cueva et al., 2002; Jellali et al., 2002; Kao et al., 2004; Hirano et al., 2005; 2007). Thus both vesicular and transport mechanisms might be engaged in GABA release.
Supplementary Material
ACKNOWLEDGEMENTS
We thank Rukmini Rao for reading and editing the manuscript, Dan Jurow for technical assistance in the initial phase of the project; Nathan Nelson for donating the guinea pig anti-GAT3, and Robert Edwards for donating anti-VGAT. Supported by NIH EY11105 (to Noga Vardi) and EY08124 (to Peter Sterling).
Reference List
- Agardh E, Bruun A, Ehinger B, Ekström P, Van Veen T, Wu J-Y. Gamma-aminobutyric acid- and glutamic acid decarboxylase-immunoreactive neurons in the retina of different vertebrates. J.Comp.Neurol. 1987a;258:622–630. doi: 10.1002/cne.902580411. [DOI] [PubMed] [Google Scholar]
- Agardh E, Ehinger B, Wu J-Y. GABA and GAD-like immunoreactivity in the primate retina. Histochem. 1987b;86:485–490. doi: 10.1007/BF00500621. [DOI] [PubMed] [Google Scholar]
- Andrade da Costa BL, de Mello FG, Hokoc JN. Transporter-mediated GABA release induced by excitatory amino acid agonist is associated with GAD-67 but not GAD-65 immunoreactive cells of the primate retina. Brain Res. 2000;863:132–142. doi: 10.1016/s0006-8993(00)02111-9. [DOI] [PubMed] [Google Scholar]
- Attwell D, Barbour B, Szatkowski M. Nonvesicular release of neurotransmitter. Neuron. 1993;11:401–407. doi: 10.1016/0896-6273(93)90145-h. [DOI] [PubMed] [Google Scholar]
- Ayoub GS, Lam DMK. The release of gamma-aminobutyric acid from horizontal cells of the goldfish (Carassius auratus) retina. J.Physiol. 1984;355:191–214. doi: 10.1113/jphysiol.1984.sp015414. [DOI] [PMC free article] [PubMed] [Google Scholar]
- Brecha N, Karten HJ, Schenker C. Neurotensin-like and somatostatin-like immunoreactivity within amacrine cells of the retina. Neurosci. 1981;6(7):1329–1340. doi: 10.1016/0306-4522(81)90191-3. [DOI] [PubMed] [Google Scholar]
- Calaza KC, Gardino PF, de Mello FG. Transporter mediated GABA release in the retina: role of excitatory amino acids and dopamine. Neurochem Int. 2006;49:769–777. doi: 10.1016/j.neuint.2006.07.003. [DOI] [PubMed] [Google Scholar]
- Cammack JN, Schwartz EA. Ions required for the electrogenic transport of GABA by horizontal cells of the catfish retina. J Physiol. 1993;472:81–102. doi: 10.1113/jphysiol.1993.sp019938. [DOI] [PMC free article] [PubMed] [Google Scholar]
- Casini G, Brecha NC. Colocalization of vasoactive intestinal polypeptide and GABA immunoreactivities in a population of wide-field amacrine cells in the rabbit retina. Vis.Neurosci. 1992;8:373–378. doi: 10.1017/s0952523800005113. [DOI] [PubMed] [Google Scholar]
- Chaudhry FA, Reimer RJ, Bellocchio EE, Danbolt NC, Osen KK, Edwards RH, Storm-Mathisen J. The vesicular GABA transporter,VGAT, localizes to synaptic vesicles in sets of glycinergic as well as GABAergic neurons. J.Neurosci. 1998;18:9733–9750. doi: 10.1523/JNEUROSCI.18-23-09733.1998. [DOI] [PMC free article] [PubMed] [Google Scholar]
- Cueva JG, Haverkamp S, Reimer RJ, Edwards R, Wässle H, Brecha NC. Vesicular gamma-aminobutyric acid transporter expression in amacrine and horizontal cells. J.Comp.Neurol. 2002;445:227–237. doi: 10.1002/cne.10166. [DOI] [PMC free article] [PubMed] [Google Scholar]
- de la Villa P, Varela C, Rivera L, Blanco R. GABA induced depolarization in horizontal cells of the mammalian retina. Association for Research in Vision and Ophthalmology abstract 2006; 2003. [Google Scholar]
- Dhingra A, Jiang M, Wang T-L, Lyubarsky A, Savchenko A, Bar-Yehuda T, Sterling P, Birnbaumer L, Vardi N. Light response of retinal ON bipolar cells requires a specific splice variant of Gαo. J.Neurosci. 2002;22:4878–4884. doi: 10.1523/JNEUROSCI.22-12-04878.2002. [DOI] [PMC free article] [PubMed] [Google Scholar]
- Dhingra A, Lyubarsky A, Jiang M, Pugh EN, Jr, Birnbaumer L, Sterling P, Vardi N. The light response of ON bipolar neurons requires Gαo. J.Neurosci. 2000;20:9053–9058. doi: 10.1523/JNEUROSCI.20-24-09053.2000. [DOI] [PMC free article] [PubMed] [Google Scholar]
- Djamgoz MB, Laming PJ. Micro-electrode measurements and functional aspects of chloride activity in cyprinid fish retina: extracellular activity and intracellular activities of L- and C-type horizontal cells. Vision Res. 1987;27:1481–1489. doi: 10.1016/0042-6989(87)90157-x. [DOI] [PubMed] [Google Scholar]
- Freed . GABAergic circuits in the mammalian retina. In: Mize RR, Marc RE, Sillito AM, editors. Progress in Brain Research. Elsevier Science Publishers; 1992. pp. 107–131. [DOI] [PubMed] [Google Scholar]
- Greferath U, Grünert U, Fritschy JM, Stephenson A, Möhler H, Wässle H. GABAA receptor subunits have differential distributions in the rat retina: In situ hybridization and immunohistochemistry. J.Comp.Neurol. 1995;353:553–571. doi: 10.1002/cne.903530407. [DOI] [PubMed] [Google Scholar]
- Greferath U, Grünert U, Müller F, Wässle H. Localization of GABAA receptors in the rabbit retina. Cell Tissue Res. 1994;276:295–307. doi: 10.1007/BF00306115. [DOI] [PubMed] [Google Scholar]
- Greferath U, Grünert U, Wässle H. Rod bipolar cells in the mammalian retina show protein kinase C-like immmunoreactivity. J.Comp.Neurol. 1990;301:433–442. doi: 10.1002/cne.903010308. [DOI] [PubMed] [Google Scholar]
- Grünert U, Martin PR. Rod bipolar cells in the Macaque monkey retina: Immunoreactivity and connectivity. J.Neurosci. 1991;11:2742–2758. doi: 10.1523/JNEUROSCI.11-09-02742.1991. [DOI] [PMC free article] [PubMed] [Google Scholar]
- Grünert U, Martin PR, Wässle H. Immunocytochemical analysis of bipolar cells in the macaque monkey retina. J.Comp.Neurol. 1994;348:607–627. doi: 10.1002/cne.903480410. [DOI] [PubMed] [Google Scholar]
- Grünert U, Wässle H. GABA-like immunoreactivity in the macaque monkey retina: A light and electron microscopic study. J.Comp.Neurol. 1990;297:509–524. doi: 10.1002/cne.902970405. [DOI] [PubMed] [Google Scholar]
- Guo C, Stella SL, Jr, Hirano AA, Brecha NC. Plasmalemmal and vesicular gamma-aminobutyric acid transporter expression in the developing mouse retina. J Comp Neurol. 2009;512:6–26. doi: 10.1002/cne.21846. [DOI] [PMC free article] [PubMed] [Google Scholar]
- Haverkamp S, Grünert U, Wässle H. The cone pedicle, a complex synapse in the retina. Neuron. 2000;27:85–95. doi: 10.1016/s0896-6273(00)00011-8. [DOI] [PubMed] [Google Scholar]
- Hirano AA, Brandstatter JH, Brecha NC. Cellular distribution and subcellular localization of molecular components of vesicular transmitter release in horizontal cells of rabbit retina. J Comp Neurol. 2005;488:70–81. doi: 10.1002/cne.20577. [DOI] [PMC free article] [PubMed] [Google Scholar]
- Hirano AA, Brandstatter JH, Vila A, Brecha NC. Robust syntaxin-4 immunoreactivity in. 2007 doi: 10.1017/S0952523807070198. [DOI] [PMC free article] [PubMed] [Google Scholar]
- Isaacson JS. Mechanisms governing dendritic gamma-aminobutyric acid (GABA) release in the rat olfactory bulb. Proc.Natl.Acad.Sci.U.S.A. 2001;98:337–342. doi: 10.1073/pnas.021445798. [DOI] [PMC free article] [PubMed] [Google Scholar]
- Jellali A, Stussi-Garaud C, Gasnier B, Rendon A, Sahel JA, Dreyfus H, Picaud S. Cellular localization of the vesicular inhibitory amino acid transporter in the mouse and human retina. J Comp Neurol. 2002;449:76–87. doi: 10.1002/cne.10272. [DOI] [PubMed] [Google Scholar]
- Johnson J, Chen TK, Rickman DW, Evans C, Brecha NC. Multiple gamma-aminobutyric acid plasma membrane transporters (GAT-1, GAT-2, GAT-3) in the rat retina. Journal of Comparative Neurology. 1996;375:212–224. doi: 10.1002/(SICI)1096-9861(19961111)375:2<212::AID-CNE3>3.0.CO;2-5. [DOI] [PMC free article] [PubMed] [Google Scholar]
- Johnson MA, Vardi N. Regional differences in GABA and GAD immunoreactivity in rabbit horizontal cells. Vis.Neurosci. 1998;15:743–753. doi: 10.1017/s0952523898154135. [DOI] [PubMed] [Google Scholar]
- Jonas P, Bischofberger J, Sandkuhler J. Co-release of two fast neurotransmitters at a central synapse. Science. 1998;281:419–424. doi: 10.1126/science.281.5375.419. [DOI] [PubMed] [Google Scholar]
- Jones SM, Palmer MJ. Activation of the tonic GABAC receptor current in retinal bipolar cell terminals by nonvesicular GABA release. J Neurophysiol. 2009;102:691–699. doi: 10.1152/jn.00285.2009. [DOI] [PMC free article] [PubMed] [Google Scholar]
- Jursky F, Nelson N. Developmental expression of the neurotransmitter transporter GAT3. J Neurosci.Res. 1999a;55:394–399. doi: 10.1002/(SICI)1097-4547(19990201)55:3<394::AID-JNR14>3.0.CO;2-E. [DOI] [PubMed] [Google Scholar]
- Jursky F, Nelson N. Developmental expression of the neurotransmitter transporter NTT4. J Neurosci.Res. 1999b;55:24–35. doi: 10.1002/(SICI)1097-4547(19990101)55:1<24::AID-JNR4>3.0.CO;2-O. [DOI] [PubMed] [Google Scholar]
- Kao Y-H, Lassová L, Sterling P, Vardi N. Evidence that two types of retinal bipolar cell use both glutamate and GABA. J.Comp.Neurol. 2004;478:207–218. doi: 10.1002/cne.20221. [DOI] [PubMed] [Google Scholar]
- Koulen P, Sassoè-Pognetto M, Grünert U, Wässle H. Selective clustering of GABAA and glycine receptors in the mammalian retina. J.Neurosci. 1996;16:2127–2140. doi: 10.1523/JNEUROSCI.16-06-02127.1996. [DOI] [PMC free article] [PubMed] [Google Scholar]
- Lasansky A. Lateral contacts and interactions of horizontal cell dendrites in the retina of the larval tiger salamander. J.Physiol. 1980;301:59–68. doi: 10.1113/jphysiol.1980.sp013188. [DOI] [PMC free article] [PubMed] [Google Scholar]
- Linberg KA, Fisher SK. Ultrastructural evidence that horizontal cell axon terminals are presynaptic in the human retina. J.Comp.Neurol. 1988;268:281–297. doi: 10.1002/cne.902680211. [DOI] [PubMed] [Google Scholar]
- Ludwig M, Pittman QJ. Talking back: dendritic neurotransmitter release. Trends Neurosci. 2003;26:255–261. doi: 10.1016/S0166-2236(03)00072-9. [DOI] [PubMed] [Google Scholar]
- Martin PR, Grünert U. Spatial density and immunoreactivity of bipolar cells in the Macaque monkey retina. J.Comp.Neurol. 1992;323:269–287. doi: 10.1002/cne.903230210. [DOI] [PubMed] [Google Scholar]
- Massey . Cell types using glutamate as a neurotransmitter in the vertebrate retina. In: Osborne NN, Chader G, editors. Progress in retinal research. Volume 9. London: Pergamon Press; 1990. pp. 399–425. [Google Scholar]
- Massey SC, Miller RF. Glutamate receptors of ganglion cells in the rabbit retina: Evidence for glutamate as a bipolar cell transmitter. J.Physiol. 1988;405:635–655. doi: 10.1113/jphysiol.1988.sp017353. [DOI] [PMC free article] [PubMed] [Google Scholar]
- Maggesissi RS, Gardino PF, Guimaraes-Souza EM, Paes-de-Carvalho R, Silva RB, Calaza KC. Modulation of GABA release by nitric oxide in the chick retina: different effects of nitric oxide depending on the cell population. Vision Res. 2009;49:2494–2502. doi: 10.1016/j.visres.2009.08.004. [DOI] [PubMed] [Google Scholar]
- Miller RF, Dacheux RF. Intracellular chloride in retinal neurons: measurement and meaning. Vision Res. 1983;23:399–411. doi: 10.1016/0042-6989(83)90087-1. [DOI] [PubMed] [Google Scholar]
- Mills SL, Massey SC. AII amacrine cells limit scotopic acuity in central macaque retina: a confocal analysis of calretinin labeling. Journal of Comparative Neurology. 1999;411:19–34. [PubMed] [Google Scholar]
- Mosinger J, Yazulla S, Studholme KM. GABA-like immunoreactivity in the vertebrate retina: a species comparison. Exp.Eye Res. 1986;42:631–644. doi: 10.1016/0014-4835(86)90052-7. [DOI] [PubMed] [Google Scholar]
- Nusbaum MP, Blitz DM, Swensen AM, Wood D, Marder E. The roles of co-transmission in neural network modulation. Trends Neurosci. 2001;24:146–154. doi: 10.1016/s0166-2236(00)01723-9. [DOI] [PubMed] [Google Scholar]
- O'Malley DM, Sandell JH, Masland RH. Co-release of acetylcholine and GABA by the starburst amacrine cells. J.Neurosci. 1992;12:1394–1408. doi: 10.1523/JNEUROSCI.12-04-01394.1992. [DOI] [PMC free article] [PubMed] [Google Scholar]
- Pourcho RG, Owczarzak MT. Distribution of GABA immunoreactivity in the cat retina: A light- and electron-microscopic study. Vis.Neurosci. 1989;2:425–435. doi: 10.1017/s0952523800012323. [DOI] [PubMed] [Google Scholar]
- Richerson GB, Wu Y. Dynamic equilibrium of neurotransmitter transporters: not just for reuptake anymore. J Neurophysiol. 2003;90:1363–1374. doi: 10.1152/jn.00317.2003. [DOI] [PubMed] [Google Scholar]
- Röhrenbeck J, Wässle H, Boycott BB. Horizontal cells in the monkey retina: Immuocytochemical staining with antibodies against calcium binding proteins. Eur.J.Neurosci. 1989;1:407–420. doi: 10.1111/j.1460-9568.1989.tb00349.x. [DOI] [PubMed] [Google Scholar]
- Röhrenbeck J, Wässle H, Heizmann CW. Immunocytochemical labelling of horizontal cells in mammalian retina using antibodies against calcium-binding proteins. Neurosci.Lett. 1987;77:255–260. doi: 10.1016/0304-3940(87)90508-8. [DOI] [PubMed] [Google Scholar]
- Salio C, Lossi L, Ferrini F, Merighi A. Neuropeptides as synaptic transmitters. Cell Tissue Res. 2006;326:583–598. doi: 10.1007/s00441-006-0268-3. [DOI] [PubMed] [Google Scholar]
- Satoh H, Kaneda M, Kaneko A. Intracellular chloride concentration is higher in rod bipolar cells than in cone bipolar cells of the mouse retina. Neurosci.Lett. 2001;310:161–164. doi: 10.1016/s0304-3940(01)02120-6. [DOI] [PubMed] [Google Scholar]
- Schwartz E. Depolarization without calcium can release gamma-aminobutyric acid from a retinal neuron. Science. 1987;238:350–355. doi: 10.1126/science.2443977. [DOI] [PubMed] [Google Scholar]
- Skatchkov SN, Thomzig A, Eaton MJ, Biedermann B, Eulitz D, Bringmann A, Pannicke T, Veh RW, Reichenbach A. Kir subfamily in frog retina: specific spatial distribution of Kir 6.1 in glial (Muller) cells. NeuroReport. 2001;12:1437–1441. doi: 10.1097/00001756-200105250-00028. [DOI] [PubMed] [Google Scholar]
- Slaughter MM, Miller RF. An excitatory amino acid antagonist blocks cone input to sign-conserving second-order retinal neurons. Science. 1983;219:1230–1232. doi: 10.1126/science.6131536. [DOI] [PubMed] [Google Scholar]
- Stell WK. The structure and relationships of horizontal cells and photoreceptor-bipolar synaptic complexes in goldfish retina. Am.J Anat. 1967;121:401–423. doi: 10.1002/aja.1001210213. [DOI] [PubMed] [Google Scholar]
- Sulaiman P, Fina M, Vardi N. Ret-PCP2 localizes with PKC in a subset of primate ON bipolar cells. JCN. doi: 10.1002/cne.22266. (in press) [DOI] [PMC free article] [PubMed] [Google Scholar]
- Thind KK, Goldsmith PC. Glutamate and GABAergic neurointeractions in the monkey hypothalamus: a quantitative immunomorphological study. Neuroendocrinology. 1995;61:471–485. doi: 10.1159/000126870. [DOI] [PubMed] [Google Scholar]
- Vaney DI, Young HM. GABA-like immunoreactivity in NADPH-diaphorase amacrine cells of the rabbit retina. Brain Res. 1988;474:380–385. doi: 10.1016/0006-8993(88)90455-6. [DOI] [PubMed] [Google Scholar]
- Vardi N. Alpha subunit of Go localizes in the dendritic tips of ON bipolar cells. J.Comp.Neurol. 1998;395:43–52. [PubMed] [Google Scholar]
- Vardi N, Auerbach P. Specific cell types in cat retina express different forms of glutamic acid decarboxylase. J.Comp.Neurol. 1995;351:374–384. doi: 10.1002/cne.903510305. [DOI] [PubMed] [Google Scholar]
- Vardi N, Kaufman DL, Sterling P. Horizontal cells in cat and monkey retina express different isoforms of glutamic acid decarboxylase. Vis.Neurosci. 1994;11:135–142. doi: 10.1017/s0952523800011172. [DOI] [PubMed] [Google Scholar]
- Vardi N, Masarachia P, Sterling P. Immunoreactivity to GABAA receptor in the outer plexiform layer of the cat retina. J.Comp.Neurol. 1992;320:394–397. doi: 10.1002/cne.903200310. [DOI] [PubMed] [Google Scholar]
- Vardi N, Matesic DF, Manning DR, Liebman PA, Sterling P. Identification of a G-protein in depolarizing rod bipolar cells. Vis.Neurosci. 1993;10:473–478. doi: 10.1017/s0952523800004697. [DOI] [PubMed] [Google Scholar]
- Vardi N, Sterling P. Subcellular localization of GABAA receptor on bipolar cells in macaque and human retina. Vision Res. 1994;34:1235–1246. doi: 10.1016/0042-6989(94)90198-8. [DOI] [PubMed] [Google Scholar]
- Vardi N, Zhang LL, Payne JA, Sterling P. Evidence that different cation chloride cotransporters in retinal neurons allow opposite responses to GABA. J.Neurosci. 2000;20:7657–7663. doi: 10.1523/JNEUROSCI.20-20-07657.2000. [DOI] [PMC free article] [PubMed] [Google Scholar]
- Varela C, Blanco R, de l, V Depolarizing effect of GABA in rod bipolar cells of the mouse retina. Vision Res. 2005 doi: 10.1016/j.visres.2005.03.020. [DOI] [PubMed] [Google Scholar]
- Walker MC, Ruiz A, Kullmann DM. Monosynaptic GABAergic signaling from dentate to CA3 with a pharmacological and physiological profile typical of mossy fiber synapses. Neuron. 2001;29:703–715. doi: 10.1016/s0896-6273(01)00245-8. [DOI] [PubMed] [Google Scholar]
- Wässle H, Chun M-H. GABA-like immunoreactivity in the cat retina: Light microscopy. J.Comp.Neurol. 1989;279:43–54. doi: 10.1002/cne.902790105. [DOI] [PubMed] [Google Scholar]
- Wu Y, Wang W, Richerson GB. The Transmembrane Sodium Gradient Influences Ambient GABA Concentration by Altering the Equilibrium of GABA Transporters. J Neurophysiol. 2006;96:2425–2436. doi: 10.1152/jn.00545.2006. [DOI] [PubMed] [Google Scholar]
- Yang C-Y. γ-Aminobutyric acid transporter-mediated current from bipolar cells in tiger salamander retinal slices. Vision Res. 1998;38:2521–2526. doi: 10.1016/s0042-6989(98)00100-x. [DOI] [PubMed] [Google Scholar]
- Yang C-Y, Wang H-H. Anatomical and electrophysiological evidence for GABAergic bipolar cells in tiger salamander retina. Vision Res. 1999;39:3653–3661. doi: 10.1016/s0042-6989(99)00112-1. [DOI] [PubMed] [Google Scholar]
- Yang C-Y, Yazulla S. Glutamate-, GABA-, and GAD-immunoreactivities co-localize in bipolar cells of tiger salamander retina. Vis.Neurosci. 1994;11:1193–1203. doi: 10.1017/s0952523800006994. [DOI] [PubMed] [Google Scholar]
- Yang CY. L-glutamic acid decarboxylase- and gamma-aminobutyric acid-immunoreactive bipolar cells in tiger salamander retina are of ON- and OFF-response types as inferred from Lucifer Yellow injection. J Comp Neurol. 1997;385:651–660. [PubMed] [Google Scholar]
- Yang CY, Zhang J, Yazulla S. Differential synaptic organization of GABAergic bipolar cells and non-GABAergic (glutamatergic) bipolar cells in the tiger salamander retina. J.Comp.Neurol. 2003;455:187–197. doi: 10.1002/cne.2157. [DOI] [PubMed] [Google Scholar]
- Yazulla S, Kleinschmidt J. Carrier-mediated release of GABA from retinal horizontal cells. Brain Res. 1983;263:63–75. doi: 10.1016/0006-8993(83)91201-5. [DOI] [PubMed] [Google Scholar]
- Zilberter Y, Kaiser KM, Sakmann B. Dendritic GABA release depresses excitatory transmission between layer 2/3 pyramidal and bitufted neurons in rat neocortex. Neuron. 1999;24:979–988. doi: 10.1016/s0896-6273(00)81044-2. [DOI] [PubMed] [Google Scholar]
Associated Data
This section collects any data citations, data availability statements, or supplementary materials included in this article.


