Abstract
A computational model of oxygen transport from red blood cells to mitochondria with subsequent reaction to water is presented. This computational model consists of a five region convection-diffusion-reaction mathematical model which is solved using a standard numerical time-split method. The unique feature of this mathematical model is the treatment of the red blood cells and the plasma as two separate flows. The numerical method is second order accurate overall. This computational model is useful for analyzing residue data from positron emission tomography or data from multiple indicator dilution curves.
Keywords: Convection-diffusion-permeation-reaction modeling, Numerical solutions to partial differential equations, Water transport in heart, Blood-tissue exchange kinetics, Erythrocyte precession, Oxygen metabolism, Positron emission tomography
1. Introduction
Many models for oxygen transport from blood into tissue have been investigated [1–7], but they are mainly concerned with steady state and do not allow for transient solutions. Also, the models are over-simplified and neglect certain critical aspects of the oxygen transport system. The models of Federspiel and Sarelius [3], Federspiel and Popel [4] and of Groebe and Thews [7] take into account that hemoglobin comes in discrete packages in the red cell, a factor which Hellums [8] identified in his 1977 paper as being critical at low hematocrits. However, even these studies like those before them give a first approximation only, since they are concerned with steady state situations. The study of steady state solutions does allow one to gain much understanding of complex situations, as reviewed by Popel [9], but there is a practical need for transient solutions for analyzing experimental data.
In contrast to those, Rose and Goresky [10] developed a model which assumes that hemoglobin is homogeneously distributed in the capillary. Their model was used for describing the transient change in 18O-oxygen by analysis of coronary venous dilution curves following an arterial bolus injection of 18O-labeled oxygen molecules. They concluded that the permeability for oxygen diffusion from capillary into tissue was low relative to that for diffusion across slices of tissue. However, it is possible that the inhomogeneous distribution of the oxygen carrier hemoglobin leads to an extra impediment to oxygen transport [11]. The impediment to oxygen transport does depend on the capillary hemocrit, which will determine the distance between red blood cells. Furthermore, the speed of dissociation of oxygen from the hemoglobin molecule, intraerythrocyte diffusion, membrane permeation, permeation through the endothelial cells and diffusion through the interstitial fluid may all together play a very significant role under normal circumstances.
A similar model by Deussen and Bassingthwaighte [12] advances the field by accounting for the tracer water produced by metabolism of the tracer oxygen. This model, like that of Rose and Goresky, uses linear conductance parameters for the membrane permeability-surface area products and intracellular transformation or clearance. Like theirs, it considers the blood as a “hemoglobin solution,” so that all of the sequential resistance's beginning with release from the binding site on hemoglobin, are lumped together as a single capillary wall conductance or permeability-surface area product, PSc. It is a multicapillary model, allowing accounting for intraorgan flow heterogeneity. The Deussen–Bassingthwaighte model in addition allows axial diffusion parallel to the flow path. Its most important development is not the diffusion, but the transformation of 15O-oxygen to 15O-water, making it a dual species model; it is therefore useful for analyzing 15O-water residue or 15O-water or 3H-water outflow curves, 15O-oxygen, 18O-water, 17O-oxygen, or 11C-carbon monoxide and other solutes that may or may not undergo a single transformation. This model has been applied to studies on the positron emitting tracers mentioned, but has a particularly strong potential for providing estimates of regional oxygen consumption from a sequence of positron emission tomographic (PET) images. The first role of the model proposed here is to extend this capability.
There is a need to calculate local flow and oxygen consumption in an organ from residue curves of 15O-oxygen obtained with PET scans. Compartmental models have been used to analyze PET data on tracer oxygen residue curves for the brain [13,14]. Since oxygen is metabolized to water, and the oxygen label in water and molecular oxygen cannot be discerned, the washout of water must be modeled as well. This new axially distributed model accounts for oxygen transport and metabolism using linearized approximations for hemoglobin and myoglobin binding, but considers radial diffusion within each region to be instantaneous. It accounts for a separation between erythrocytes and plasma and for the more rapid velocity of erythrocytes than plasma, a feature whose importance can now be evaluated. The lumped mixing chamber tracer-kinetic models commonly used for PET detection of labeled water residue curves suffer a severe limitation under certain circumstances because of the compartmental assumption [15], and this distributed model being more anatomically realistic avoids this pitfall.
Thus, the second purpose is to develop a physiologically and anatomically reasonable model, with the inflow-to-capillary discontinuity in concentrations implicit in the compartmental modeling, and to capture its essence in a robust, accurately computable model.
2. Model
We idealize the geometry of a capillary-tissue exchange unit and model the flowing regions and the tissue as axisymmetric cylindrical elements as shown in Fig. 1. The red blood cells are idealized as a separate homogeneous flowing region contained within the plasma region. Since we assume axisymmetric, we only have to solve five one-dimensional partial differential equations.
Fig. 1.
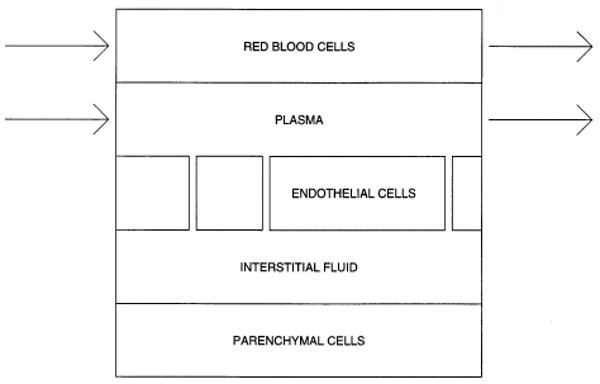
Capillary-tissue exchange unit.
The five region red blood cell model (rbc model) consists of the following set of partial differential equations. The notation is consistent with Bassingthwaighte et al. [16]. The concentrations, C, for O2 are given by the solutions to
and the concentrations for H2O are given by the solutions to an analogous set of equations but in which there is a positive production term GiCi from the flux of oxygen tracer being transformed to water tracer.
where C refers to O2 and C* refers to H2O. The subscripts are rbc for red blood cells, p for plasma, ec for endothelial, isf for interstitial fluid, and pc for parenchymal cells.
For notational convenience, we define the following constants for the ratios of regional volumes of distribution to the plasma space:
Also, the following rate constants are defined again relative to the plasma space:
where the ki's refer to O2 and the 's refer to H2O. The rate constants for this model are symmetric, kij = kji etc., which would not be the case for generalized nonlinear transporters on the membranes.
The known inputs, constant over time to the model are: whole blood flow Fblood in units of ml g−l min−1, length of capillary L in units of cm, the total volume Vcap of the capillary in units of ml, the red blood cell virtual volume ratio , various permeability-surface area products PS in units of ml g−l min−1, reaction rates G in units of ml g−l min−1, flow rates F in units of ml g−l min−1, and diffusion coefficients D in units of cm2 s−1. The small vessel hematocrit is lower than the larger vessel hematocrit (and the rbc velocities higher than plasma velocities in small vessels), so we account for this at the capillary level only, using the hematocrit ratio Hctratio (Hctratio = Hctcap/HctLV), where the large vessel hematocrit is HctLV. Normally, the hematocrit is physiologically less than 1 and rbc velocity greater than 1, so that the time for exchange between rbc and tissue is reduced compared to that for solutes carried only in the plasma. Other parameters that are needed are calculated from these inputs. These are:
where [Hgb] is the concentration of hemoglobin, and f(pO2) is the functional relationship between O2 saturation and O2 partial pressure. The functional relationship f(pO2) for the hemoglobin-containing erythrocytes and the myoglobin-containing myocytes or parenchymal cells are described in detail by Deussen and Bassingthwaighte [12]. They give methods for calculating the diffusion terms. The rbc and plasma velocities are urbc and up.
In matrix notation, the rbc model is
| (2.1) |
Boundary conditions for regions rbc and p are either
| (2.2) |
or
| (2.3) |
Boundary conditions for regions ec, isf, and pc are based on reflections at x=0 and x=L
cx(0,t) = 0, cx(L,t) = 0.
Initial conditions for all five regions are
c(x,0) = 0.
The matrices U, D, and K are
U = diagonal(urbc,up,0,0,0,urbc,up,0,0,0),
D = diagonal(Drbc,Dp,Dec,Disf,Dpc, ),
and
The first submatrix K11 is
The second submatrix is K12 = 0 and the third is
The fourth submatrix K22 is
To solve this system of equations, we split the main equation (2.1) into simpler subproblems, and solve each subproblem separately.
3. Numerical method
The following sections are a brief overview of a standard time-split method used in the red-blood cell five-region convection-diffusion-reaction model. Our aim is to give enough detail of the numerical methods to show our claim of second order accuracy.
We begin with a simple example that highlights the necessary error analysis required for an understanding of time-split methods. We follow with a section on the error analysis for our diffusion-convection-reaction equation. We discuss the boundary condition corrections that arise in our time-split method in the next section. Finally, we discuss the numerical methods used to solve each of the subproblems. More complete discussions of standard and widely used time-split methods can be found in LeVeque [17,18], Strikwerda [30], and Yanenko [31].
3.1. A time-split method for the convection-reaction equation
Consider the following Cauchy problem for the convection-reaction equation in one dimension:
| (3.4) |
where U and K are constant. This equation is of the general form
ct = A(c),
where A depends on c and its spatial derivatives. To determine the solution at a later time, we use the exact solution operator
| (3.5) |
For the case we are looking at t does not appear explicitly, so the solution operator only depends on the time elapsed:
S(t1,t0) = S(t1 − t0).
If we use a two-level difference scheme, we have
| (3.6) |
where Q(k) is an approximation to S(k), and k is the temporal step size. Eq. (3.6) is the difference analogue to
| (3.7) |
The method (3.6) is accurate of order p if, for smooth functions c, the local truncation error (Q(k) − S(k))c is O(kp + 1) as k → 0 with some fixed relation between k and h, where h is the spatial step size. For example, the time step equals (Vp/Fp)/Nseg and the space step is L/Nseg, where Nseg is the number of axial segments into which the capillary-tissue unit is divided.
We can derive the exact solution operator for the convection-reaction equation for the case when c∈ℝr and therefore U,K∈ ℝr×r
| (3.8) |
We can expand the solution in a Taylor series about the point (x,t) to get
| (3.9) |
Thus we have for Eq. (3.8), the solution operator
| (3.10) |
Consider Eq. (3.8) again, but now split into two subproblems
| (3.11) |
| (3.12) |
Each of these subproblems has an exact solution operator. By a similar derivation for S(k) above, we can derive ones for (3.11) and (3.12) to get for (3.11), S1(k) = exp(− kU ∂x), and for (3.12), S2(k) = exp(kK).
The time split method is based on the fact that
| (3.13) |
when k is small. In some cases, this splitting is exact. For example, for ct = cxx + cyy and c a scalar, . Then for a natural splitting, we have and , and S(k) = S2(k)S1(k). For systems of equations, the splitting (3.13) is not in general exact.
To see the splitting error, we look at
| (3.14) |
It can be verified that the splitting is exact only if the matrices K and U commute.
For the four region model in Bassingthwaighte et al. [16]
| (3.15) |
| (3.16) |
Therefore, we see KU – UK ≠ 0. So the local error on smooth solutions is O(k2) and hence, the splitting (3.11 – 3.12) is only first order accurate.
We can increase the order of the splitting to O(k3) by using Strang splitting. Previously, to advance the solution one step in time
| (3.17) |
where Q1(k) is the approximation to S1(k), Q2(k) is the approximation to S2(k), and Cn is the approximation to c at time tn. If we now use
| (3.18) |
the O(k2) terms drop out of Eq. (3.14) and we are left with a local truncation error that is O(k3) which makes our splitting accurate to O(k2). In Eq. (3.18), we show taking a half step with Q1 followed by a whole step with Q2, followed by another half step with Q1. When these steps are repeated over and over, the two half steps with Q1 can be combined into a single whole step to give
| (3.19) |
which takes the solution from time t0 to tn+1. This now looks almost like Eq. (3.17) except we have the half time steps with Q1 at the beginning and end rather than a whole time step at the beginning. We can know turn to the more complicated problem which includes diffusion.
3.2. A time-split method for the diffusion-convection-reaction equation
Consider the constant coefficient diffusion-convection-reaction equation for five regions, the first two of which have convection.
| (3.20) |
Boundary conditions for regions 1–2
c(0,t) = f(t),
cx(L,t) = 0.
Boundary conditions for regions 3–5
cx(0,t) = 0,
cx(L,t) = 0.
Initial conditions for regions 1–5
| (3.21) |
We can solve this problem using the following time-split scheme:
| (3.22) |
| (3.23) |
| (3.24) |
We can then approximate Eqs. (3.22), (3.23) and (3.24) by finite differences to get
| (3.25) |
| (3.26) |
| (3.27) |
where Q1, Q2, and Q3 are the finite difference approximations to the operators in Eqs. (3.22), (3.23) and (3.24). To time step with Strang splitting as in Eq. (3.18), we use
| (3.28) |
For the four-region model without red blood cells [27] which is discussed further in the section on model utility, the error was
| (3.29) |
The truncation error for the time split method of Eqs. (3.25), (3.26) and (3.27) can be represented as the sum of the trunctation errors in each subproblem plus the splitting error:
| (3.30) |
Previously, this has been
| (3.31) |
For the proposed five-region rbc model, this error would be
| (3.32) |
The methods chosen to solve the convection subproblem and the reaction subproblem would be such that p and q would be at least equal to 2. This would give an overall truncation error of O(k2 + h2), which would be an improvement over the error for the four-region model of O(k + h2).
3.3. Intermediate boundary conditions for the subproblems
For the splitting scheme given in Eqs. (3.22), (3.23) and (3.24), we solve exactly each of the subproblems
| (3.33) |
| (3.34) |
| (3.35) |
However, we need to use modified boundary conditions for each subproblem, and not the boundary conditions for the original problem (3.20).
For the convection subproblem (3.33), we need to specify boundary conditions c†(0,tn+1). We start by expanding c†(0,tn+1) in a Taylor Series about the point c(0,tn) to get
| (3.36) |
We use Eq. (3.33) to replace to get
| (3.37) |
We also have for the initial conditions c†(x,tn) = c(x,tn) which we can use to replace all the c†(0,tn) terms and their derivatives to get
| (3.38) |
Now we can use the original p.d.e. (3.20) to replace the Ucx term to get
| (3.39) |
Since
we can simplify Eq. (3.39) to get
| (3.40) |
We see from this expression that we have a modified form of the boundary condition which includes a correction for diffusion and reaction.
Now consider the diffusion equation subproblem (3.34). If we solve this equation by a stable implicit method like Crank–Nicolson, we need modified boundary conditions at time tn+1. The initial conditions will be c††(x,tn) = c†(x,tn+1). To derive the appropriate boundary conditions, we proceed as before. We have
| (3.41) |
Using the subproblem (3.34) to replace the first time derivative, we get
| (3.42) |
Our initial conditions allow us to substitute for
| (3.43) |
Now we can use Eq. (3.40) to replace c†(0,tn+1) to get
| (3.44) |
From Eq. (3.40), we can differentiate twice with respect to x to get
This expression can then be substituted for in Eq. (3.44) to give
This expression simplifies to
| (3.45) |
With the modified boundary conditions (3.40) and (3.45) and the fact that the initial conditions for Eq. (3.35) are c†††(x,tn) = c††(x,tn+1), we are now able to solve each of the subproblems separately.
3.4. Numerical methods for the subproblems
By splitting the problem into three subproblems, we can use different numerical methods to solve each subproblem. We use a combination of exact and random choice for the convection subproblem, Crank–Nicolson for the diffusion subproblem, and an o.d.e solver that automatically chooses between Adams–Moulton and Gear's method for the reaction subproblem.
3.4.1. Convection
Since the convection subproblem (3.33) is two separate one-way wave equations, we can select the Δt and Δx such that we can use the exact solution for one of the regions. We choose the normally slower region, that of the plasma, for the exact solution, and use Δx = L/Nseg and Δt = Δx/up. To update the solution in the plasma region, we just do a shift
For j = 0, we use the modified boundary condition as given by Eq. (3.40). In the rbc region, which is the higher velocity region, we use the random choice method as described by Colella [19]. To update the solution at the next time step tn+1, we use
where is the solution to the Riemann problem and an+1 is a van der Corput sampling sequence (see Ref. [19] for complete details). Since we assume that the fast rbc velocity urbc, is in the range up ≤ urbc ≤ 2up, gets updated by either or . For example, if urbc = 1.2up, then three out of four times and one out of four times . The overall velocity would then average out to
urbc = (u p + up + up + 2up)/4 = 125up.
Further modifications have to be made to the boundary conditions. When the updating is , we only need to specify which is given by Eq. (3.40). However, when the updating is , we need to specify both and . For , we would use Eq. (3.40) as before. For , we to correct the time step in Eq. (3.40), given by k, which is too large. The actual time increment is between 0 and k/2 depending on the speed urbc. If urbc = up, then the random choice method would only need the boundary condition for . If urbc = 2up, then the time increment used in Eq. (3.40), would have to be changed from k to k/2. For values of urbc between these limits, the time increment in Eq. (3.40) would be scaled appropriately.
3.4.2. Diffusion
We solve the diffusion subproblem by using a standard Crank-Nicolson approach. The details and the code may be requested from the authors. This allows us to use standard linear algebra libraries [29] to solve the resulting linear system of equations.
3.4.3. Reaction
To solve the reaction subproblem, we use the ordinary differential equation solver SDRIV2 from Kahaner et al. [20]. This solver allows for the dynamic switching between Adams–Moulton and Gear's method depending on the stiffness of the problem. The accuracy of the solution is chosen so that the errors from solving the reaction subproblem are not greater than the other errors in Eq. (3.30).
3.4.4. Boundary conditions at tn+1
After the subproblems are solved, we have for j = 2,…,N − 1. For , we just use either Eq. (2.2) or Eq. (2.3). If urbc > up, then we also need to correct . Whatever material is flowing in from the boundary undergoes not only convection, but also reaction and diffusion. needs to be corrected for one time step's worth of reaction and diffusion, using Eq. (3.40) and Eq. (3.45), otherwise conservation of mass will be violated. Without this correction, the solution ends up having too much material flowing in from the boundary during those updating steps when both and are updated from the boundary.
4. Results
4.1. Model behavior
Figs. 2 and 3 show the results from the rbc model with the splitting scheme given in Eqs. (3.22), (3.23) and (3.24). The numerical values for the parameters are listed in the legend of Fig. 2. These values were choosen to test the numerical method. Fitting the model to experimental data is given in the next section.
Fig. 2.
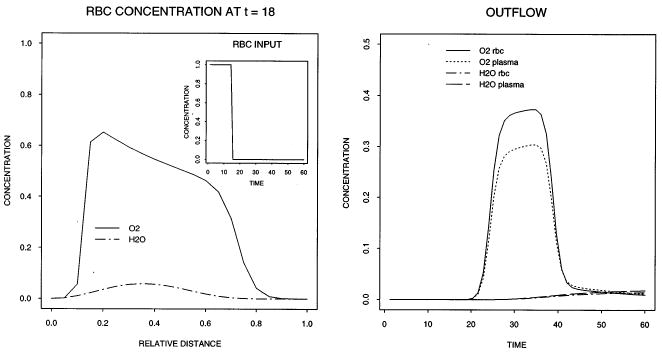
Concentration–time profiles in the input (left panel insert), outflow (right panel), and concentration–space profile in the rbc region at t = 18 s (left panel). The following values were used for the parameters: Fblood = 2.5 ml g−l min−1, L = 0.1 cm, Vcap = 1.0 ml g−l, HctLV = 0.6, Hctratio = 1.0, θrbc = 1.0, PSrbc = 5.0 ml g−lmin−1, ml g−lmin−1, other PSi = 1.0 ml g−lmin−1, other θi = 1.0, Vec = 0.02 mlg−l, Visf = 0.15 ml g−l, Vpc = 0.55 ml g−l, Grbc = Gp = 0.0 ml g−lmin−1, Gec= Gisf = Gpc = 2.0 ml g−l min−1, all Di = 10−6 cm2s−1, Nseg = 20, and an input pulse of unit height into the rbc of width 15 s.
Fig. 3.
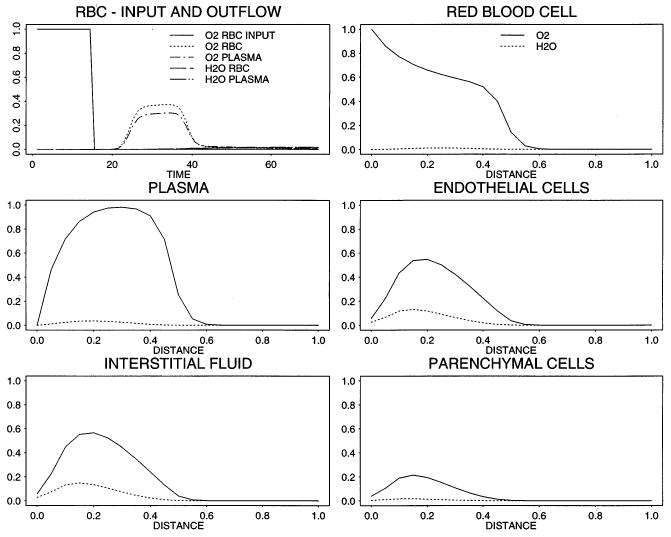
Concentration–time profiles in the input, outflow, and relative concentration profiles for O2 (solid line) and the reaction product H2O (dashed line) in all five regions at t= 12 s. (Parameters are the same as given in the legend of Fig. 2).
Fig. 2 shows in the left panel the position of the tracer oxygen and tracer water concentration distance profiles at t = 18 s, just 3 s after the input function drops to zero. Because of the unrealistically large value of 1.0 ml g−1 chosen for Vcap, the capillary transit time is Vcap/Fblood = 24 s, so the bolus front is only 3/4 of the way along the capillary. The front of the pulse at x/L = 0.75 is blunted, more so than is the trailing edge, as expected. The outflow curves reveal the separation in concentrations of erythrocytes and plasma, due to the resistance at the red cell membrane and the loss of oxygen from plasma into tissue.
Fig. 3, using the same parameters, illustrates the profiles in the five regions at 12 s, just as the pulse front reaches the capillary midpoint. As was also evident in Fig. 2, there are finite concentrations of oxygen beyond the mean bolus front because of the axial diffusion. The relative magnitude of the the oxygen concentration in the plasma as compared to the concentration in red blood cells is due to the artificially high values for PSrbc used for testing. The concentrations of tracer water, produced by oxygen consumption, are highest in the interstitium because the production by transformation was occurring in endothelial cells and interstitium, consuming most of the substrate oxygen before it reached the parenchymal cells.
To calculate an overall order of accuracy of the rbc model, we look at the error in output concentrations for several values of Nseg. Fig. 4 shows the output concentration profiles in both the red blood cell region and the plasma region for the cases Nseg = 5, 10, 20, 40, 80, 160, 320. The 2-norm of the output concentrations is shown in Table 1. We can see that as Nseg increases, the error becomes progressively smaller. If we assume asymptotic error
Fig. 4.
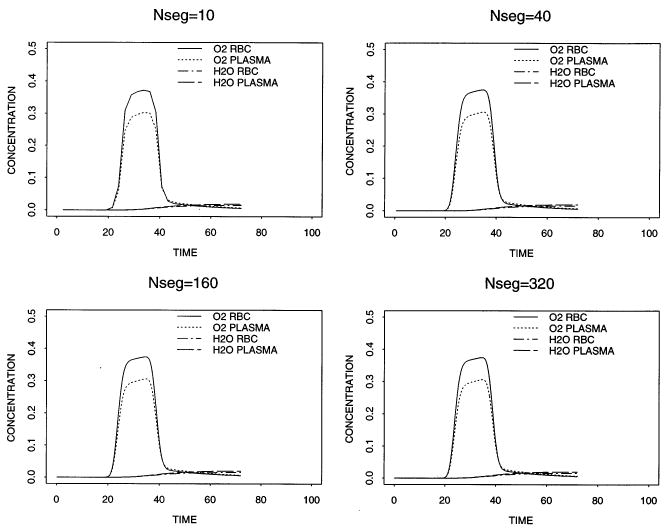
Concentration profiles of O2 and H2O in the outflow of the red blood cell region and the plasma region for Nseg = 10, 40, 160, 320.
Table 1.
Errors from the rbc model for Nseg = 5, 10, 20, 40, 80, 160, 320
| Nseg | ||
|---|---|---|
| 5 | 5.970 × 10⁻⁴ | |
| 10 | 1.165 × 10⁻⁴ | |
| 20 | 2.381 × 10⁻⁴ | |
| 40 | 3.057 × 10⁻⁵ | |
| 80 | 7.529 × 10⁻⁶ | |
| 160 | 6.099 × 10⁻⁷ |
is valid then the overall order p, from a least squares fit of a straight line to the log-transformed 2-norm of the error is 1.85.
4.2. Applications
Fig. 5 shows the results of fitting the model to experimental data. The pair of 15O-concentration–time curves were recorded at the inflow and outflow to an isolated blood-perfused rabbit heart preparation. The perfusate was 20% hematocrit with erythrocytes suspended in standard Krebs-Henseleit physiological saline. A bolus of 1.4 ml of blood containing 15O-oxygen was injected into the inflow stream via a switching arrangement and the radioactivity in the inflow and outflow recorded via flow-through plastic scintillation detectors for the β + -emissions were counted over 1 s intervals. For the analysis, the input to the blood-tissue exchange model was the observed upstream dilution curve. The flow used for the modeling was the measured flow. The endothelial cells were assumed to have a negligible contribution to the waveform and the consumption of oxygen and so those parameters were set to zero. Consequently, the estimates of PSg represent the sum of permeation through interendothelial clefts plus permeation across the endothelial cells. The volumes of distribution were estimated from the water spaces in cach region, for example, from the steady-state tracer estimates of Gonzalez and Bassingthwaighte [21], modified to provide for the binding of oxygen by hemoglobin in red blood cells and by myoglobin in the myocytes (parenchymal cells). Values for PSrbc were set to high values in accord with the observations of Forster et al. [22]. The ratio of small vessel to large vessel hematocrit, Hctratio, was set to 0.98 for this solution. The axial diffusion coefficients in all regions were set to an arbitrarily high value of 10−4 cm2 s−1 to degrade axial gradients to some extent as would diffusional exchanges between capillary-tissue units with offset beginnings and endings. The adjustable or free parameters were therefore only PSg and PSpc for water and oxygen, and the consumption or transformation parameter, Gpc, for oxygen within myocytes.
Fig. 5.
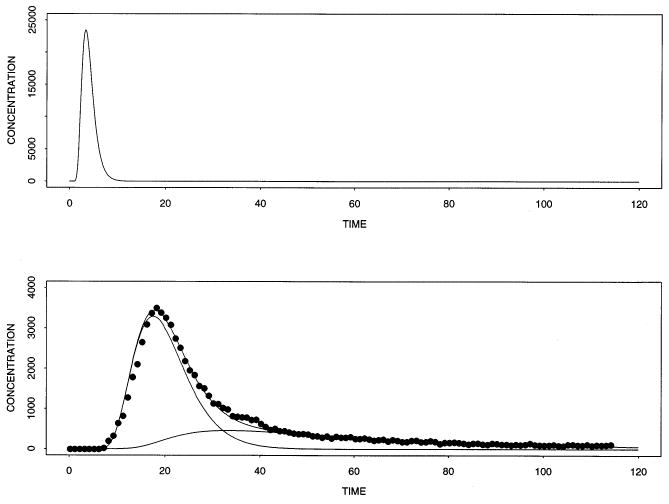
Outflow concentration-time curves for experimental data on 15O-tracer in the effluent from an isolated perfused heart followed bolus injection and model. Upper panel: Input concentration-time curve for 15O-oxygen in blood. Lower panel: Outflow dilution curve for 15O-oxygen (dots) recorded via a flow-through positron detector system. Three curves from the model solution are shown, for product 15O-water (lowest curve), for 15O-oxygen (middle curve), and their sum (upper curve) fitted to the data. The parameters for fitting the data were obtained from the data from prior statistics or by adjustment. Experimental parameters were Fblood = 0.71 ml g−l min−1, L = 0.1 cm, Vcap = 0.07 ml g−l, Vec = 0.02 ml g−l, Visf= 0.15 ml g−l, Vpc = 0.55 ml g−l, PSg − O2 = 40 ml g−1 min−1, HctLV = 0.2, Hctratio = 0.98, θrbc−O2 =24.0, θpc = 2 [12], θrbc − H2O = 0.65, PSrbc − O2 =100.0 ml g−1 min−1, PSpc − O2 = 50.0 ml g−1 min−1, ml g−1 min−1, ml g−1 min−1, ml g−1 min−1, Gpc = 0.4 ml g−lmin−1, Di = 10−4 cm2 s−1, and Nseg = 30.
Fig. 6 shows the pronounced effect of the differing velocities between plasma and red blood cells. In this figure, we see for a Hctratio = 0.7, the velocity in the plasma is up = 0.01573 cm s−1 and for the red blood cells the velocity is urbc= 0.02415 cm s−1. As the Hctratio increases, these two velocities become more nearly equal until at Hctratio = 1.0, they are the same. The values of the other parameters are the same as those used in Fig. 5 except all the PSi = 0. Erthrocyte precession exacerbates early tracer loss from erythrocytes into tracer-free plasma (left curves). This does not occur when both travel at the same velocity (the rightmost curve).
Fig. 6.
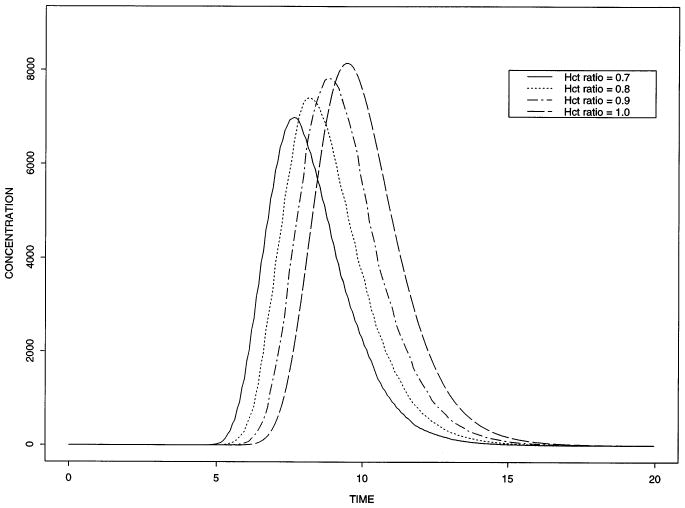
Outflow concentration–time curves for oxygen within red blood cells for various hematocrit ratios. For these solutions, the PS's are all zcro, so the curves represent intravascular transport only. Whcn erythrocytes travel faster than plasma, more tracer oxygen is lost into the tracer-free plasma (the curves to the left).
Fig. 7 shows the simulated effect of various hemoglobin binding values on Xenon transfer. The various values of the partition coefficient θrbc were chosen to be similar to that found experimentally. See for example, Carlin and Chien [23] or Goresky et al. [24]. Higher θrbc, equivalent to higher partitioning into erythrocytes, gives curves closer to erythrocyte curves, low θrbc gives waterlike curves. The change of θ changes the blood-tissue partition coefficient. Because the PS's used for these solutions are so high, the tracer is virtually flow-limited in its exchange. This means that they will be almost superimposed on each other by time scaling each relative to its own mean transit time [25,26], which is a simple but revealing test for flow-limited blood-tissue exchange.
Fig. 7.
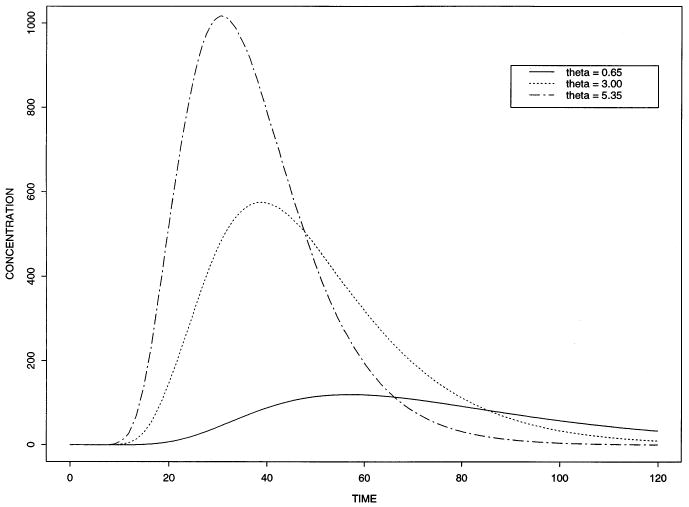
Outflow concentration-time curves for the model with different hemoglobin binding. High values of θrbc, meaning higher affinity to hemoglobin (as, for example, Xenon), produce curves closer to those for erythrocytes. Low θrbc produces water-like curves. For this fit, we used Fblood = 0.71 ml g−lmin−1, L = 0.1 cm, Vcap = 0.07 ml g−l, Vec = 0.02 ml g−l, Visf = 0.15 ml g−l, Vpc = 0.55 ml g−l, HctLV = 0.4, Hctratio = 0.8, θrbc = 0.65, 3.0, 5.35, PSrbc= 100.0 ml g−lmin−1, PSecl = 1000.0 ml g−lmin−1, PSeca = 1000.0 ml g−lmin−1, PSg = 100.0 ml g−lmin−1, PSpc = 100.0 ml g−lmin−1, Grbc = Gp = Gec= Gisf = Gpc = 0.0 ml g−lmin−1, Di = 10−4 cm2 s−1, Nseg = 10. The input curve is the same as that used in Fig. 5.
4.3. Model utility
The numerical methods are designed for high accuracy. Related models to which this model can be reduced, e.g., those of Bassingthwaighte et al. [27], with three regions and Bassingthwaighte et al. [16], with four regions, are apparently accurate also, since they can be fitted very closely by this model and have been tested against analytical models. The analytical models, either three-region ([28], water model) or four-region [16], are not at all accurate at long times: the latter, for example, requires two convolution integrations and one double convolution integration, all containing slowly convergent Bessel functions. Thus, we regard this new model as a standard for accuracy.
A main reason for the numerical strategy is that the scheme lends itself to further developments in treating nonlinear systems. For solutes at finite chemical levels, where the linearization due to the use of tracers at effectively zero chemical concentrations is no longer valid, then the PS's and G's and even the volumes of distribution become concentration-dependent. In this more demanding situation, the basic numerical method can be anticipated to work well.
5. Conclusions
We have developed a second order accurate computational model of oxygen transport and reaction from red blood cells to mitochondria. Our model treats the flow of red blood cells and the flow of plasma separately. The model is useful for analyzing residue data from positron emission tomography or outflow data from multiple indicator dilution experiments.
Acknowledgments
We would like to thank Joseph Chan and Gary Raymond for their helpful discussions concerned with the development of this model. Research has been supported by NIH grants RR 1243 (Simulation Resource Facility: http://nsr.bioeng.washington.edu/) and HL38736 and by training grant T32 HL07403. Work supported by NIH grants HL38736 and RR1243.
References
- 1.Krogh A. The number and distribution of capillaries in muscles with calculation of the oxygen pressure head necessary for supplying the tissue. J Physiol (Lond) 1919;52:409–415. doi: 10.1113/jphysiol.1919.sp001839. [DOI] [PMC free article] [PubMed] [Google Scholar]
- 2.Gutierrez G. The rate of oxygen release and its effect on capillary O2 tension: a mathematical analysis. Respir Physiol. 1986;63:79–96. doi: 10.1016/0034-5687(86)90032-0. [DOI] [PubMed] [Google Scholar]
- 3.Federspiel WJ, Sarelius IH. An examination of the contribution of red cell spacing to the uniformity of oxygen flux at the capillary wall. Microvasc Res. 1984;27:273–285. doi: 10.1016/0026-2862(84)90059-1. [DOI] [PubMed] [Google Scholar]
- 4.Federspiel WJ, Popel AS. A theoretical analysis of the effect of the particulate nature of blood on oxygen release in capillaries. Microvasc Res. 1986;32:164–189. doi: 10.1016/0026-2862(86)90052-x. [DOI] [PMC free article] [PubMed] [Google Scholar]
- 5.Ellsworth ML, Popel AS, Pittman RN. Assessment and impact of heterogeneties of convective oxygen transport parameters in capillaries of striated muscle: experimental and theoretical. Microvasc Res. 1988;35:341–362. doi: 10.1016/0026-2862(88)90089-1. [DOI] [PMC free article] [PubMed] [Google Scholar]
- 6.Groebe K, Thews G. Theoretical analysis of oxygen supply to contracted skeletal muscle. Adv Exp Med Biol. 1986;200:495–514. doi: 10.1007/978-1-4684-5188-7_62. [DOI] [PubMed] [Google Scholar]
- 7.Groebe K, Thews G. Effects of red cell spacing and red cell movement upon oxygen release under conditions of maximally working skeletal muscle. Adv Exp Med Biol. 1989;248:175–185. doi: 10.1007/978-1-4684-5643-1_22. [DOI] [PubMed] [Google Scholar]
- 8.Hellums JD. The resistance to oxygen transport in the capillaries relative to that in the surrounding tissue. Microvasc Res. 1977;13:131–136. doi: 10.1016/0026-2862(77)90122-4. [DOI] [PubMed] [Google Scholar]
- 9.Popel AS. Theory of oxygen transport to tissue. Crit Rev Biomed Eng. 1989;17:257–321. [PMC free article] [PubMed] [Google Scholar]
- 10.Rose CP, Goresky CA. Limitations of tracer oxygen uptake in the canine coronary circulation. Circ Res. 1985;56:57–71. doi: 10.1161/01.res.56.1.57. [DOI] [PubMed] [Google Scholar]
- 11.Groebe K, Thews G. Role of geometry and anisotropic diffusion for modeling pO2 profiles in working red muscle. Respir Physiol. 1990;79:255–278. doi: 10.1016/0034-5687(90)90131-h. [DOI] [PubMed] [Google Scholar]
- 12.Deussen A, Bassingthwaighte JB. Modeling 15O-oxygen tracer data for estimating oxygen consumption. Am J Physiol Heart Circ Physiol. 1996;270:H1115–H1130. doi: 10.1152/ajpheart.1996.270.3.H1115. [DOI] [PMC free article] [PubMed] [Google Scholar]
- 13.Mintun MA, Raichle ME, Martin WRW, Herscovitch PP. Brain oxygen utilization measured with O-15 radiotracers and positron emission tomography. J Nucl Med. 1984;25:177–187. [PubMed] [Google Scholar]
- 14.Huang SC, Phelps ME. Error in parameter estimates with variations in flow: measurement of oxygen utilization with positron-emission tomography. Circulation. 1985;72(Suppl IV):77–80. [PubMed] [Google Scholar]
- 15.Larson KB, Markham J, Raichle ME. Tracer-kinetic models for measuring cerebral blood flow using externally detected radiotracers. J Cereb Blood Flow Metab. 1987;7:443–463. doi: 10.1038/jcbfm.1987.88. [DOI] [PubMed] [Google Scholar]
- 16.Bassingthwaighte JB, Wang CY, Chan IS. Blood-tissue exchange via transport and transformation by capillary endothelial cells. Circ Res. 1989;65:997–1020. doi: 10.1161/01.res.65.4.997. [DOI] [PMC free article] [PubMed] [Google Scholar]
- 17.LeVeque RJ, Oliger J. Numerical methods based on additive splittings for hyperbolic partial differential equations. Math Comput. 1983;40:469–497. [Google Scholar]
- 18.LeVeque RJ. Intermediate boundary conditions for time-split methods applied to hyperbolic partial differential equations. Math Comput. 1986;47:37–54. [Google Scholar]
- 19.Colella P. Glimm's method for gas dynamics. SIAM J Sci Stat Comput. 1982;3(1) [Google Scholar]
- 20.Kahaner D, Moler C, Nash S. Numerical Methods and Software. Prentice-Hall; New Jersey: 1989. [Google Scholar]
- 21.Gonzalez F, Bassingthwaighte JB. Heterogeneities in regional volumes of distribution and flows in the rabbit heart. Am J Physiol Heart Circ Physiol. 1990;258:H1012–H1024. doi: 10.1152/ajpheart.1990.258.4.H1012. [DOI] [PMC free article] [PubMed] [Google Scholar]
- 22.Forster RE, Goodwin CW, Itada N. A new approach to the measurement of mean tissue pO2. In: Grote J, et al., editors. Oxygen Transport to Tissue II. Plenum Press; New York: 1976. pp. 41–46. [DOI] [PubMed] [Google Scholar]
- 23.Carlin R, Chien S. Partition of xenon and iodoantipyrine among erythrocytes, plasma, and myocardium. Circ Res. 1977;40:497–504. doi: 10.1161/01.res.40.5.497. [DOI] [PubMed] [Google Scholar]
- 24.Goresky CA, Schwab AJ, Rose CP. Xenon handling in the liver: red cell capacity effect. Circ Res. 1988;63:767–778. doi: 10.1161/01.res.63.4.767. [DOI] [PubMed] [Google Scholar]
- 25.Goresky CA. A linear method for determining liver sinusoidal and extravascular volumes. Am J Physiol. 1963;204:626–640. doi: 10.1152/ajplegacy.1963.204.4.626. [DOI] [PubMed] [Google Scholar]
- 26.Bassingthwaighte JB. Physiology and theory of tracer washout techniques for the estimation of myocardial blood flow: flow estimation from tracer washout. Prog Cardiovasc Dis. 1977;20:165–189. doi: 10.1016/0033-0620(77)90019-6. [DOI] [PMC free article] [PubMed] [Google Scholar]
- 27.Bassingthwaighte JB, Chan IS, Wang CY. Computationally efficient algorithms for convection-permeation-diffusion models for blood-tissue exchange. Ann Biomed Eng. 1992;20:687–725. doi: 10.1007/BF02368613. [DOI] [PubMed] [Google Scholar]
- 28.Rose CP, Goresky CA, Bach GG. The capillary and sarcolemmal barriers in the heart: an exploration of labeled water permeability. Circ Res. 1977;41:515–533. doi: 10.1161/01.res.41.4.515. [DOI] [PubMed] [Google Scholar]
- 29.Anderson E, Bai Z, Bischof C, Demmel J, Dongarra J, Du Croz J, Greenbaum A, Hammarling S, McKenney A, Ostrouchov S, Sorensen D. LAPACK Users Guide. second. SIAM; Philadelphia, PA: 1995. [Google Scholar]
- 30.Strikwerda JC. Finite Difference Schemes and Partial Differential Equations. Wadsworth and Brooks/Cole; Pacific Grove, CA: 1989. [Google Scholar]
- 31.Yanenko NN. The Method of Fractional Steps; the Solution of Problems of Mathematical Physics in Several Variables. Springer; Berlin: 1971. [Google Scholar]


