Elevated glucose levels result in enhanced generation of proinflammatory leukotrienes by mouse bone marrow cells and by retinal glial and microvascular endothelial cells. Leukotrienes may contribute to chronic inflammation in diabetic retinopathy.
Abstract
Purpose.
Evidence suggests that capillary degeneration in early diabetic retinopathy results from chronic inflammation, and leukotrienes have been implicated in this process. The authors investigated the cellular sources of leukotriene biosynthesis in diabetic retinas and the effects of hyperglycemia on leukotriene production.
Methods.
Retinas and bone marrow cells were collected from diabetic and nondiabetic mice. Mouse retinal glial cells and retinal endothelial cells (mRECs) were cultured under nondiabetic and diabetic conditions. Production of leukotriene metabolites was assessed by mass spectrometry, and Western blot analysis was used to quantitate the expression of enzymes and receptors involved in leukotriene synthesis and signaling.
Results.
Bone marrow cells from nondiabetic mice expressed 5-lipoxygenase, the enzyme required for the initiation of leukotriene synthesis, and produced leukotriene B4 (LTB4) when stimulated with the calcium ionophore A23187. Notably, LTB4 synthesis was increased threefold over normal (P < 0.03) in bone marrow cells from diabetic mice. In contrast, retinas from nondiabetic or diabetic mice produced neither leukotrienes nor 5-lipoxygenase mRNA. Despite an inability to initiate leukotriene biosynthesis, the addition of exogenous leukotriene A4 (LTA4; the precursor of LTB4) to retinas resulted in robust production of LTB4. Similarly, retinal glial cells synthesized LTB4 from LTA4, whereas mRECs produced both LTB4 and the cysteinyl leukotrienes. Culturing the retinal cells in high-glucose concentrations enhanced leukotriene synthesis and selectively increased expression of the LTB4 receptor BLT1. Antagonism of the BLT1 receptor inhibited LTB4-induced mREC cell death.
Conclusions.
Transcellular delivery of LTA4 from marrow-derived cells to retinal cells results in the generation of LTB4 and the death of endothelial cells and, thus, might contribute to chronic inflammation and retinopathy in diabetes.
Early inflammatory changes in diabetic retinopathy include leukocyte adherence to the microvasculature (i.e., leukostasis), alterations in vascular permeability, and enhanced expression of proinflammatory molecules such as NF-κB, COX-2, iNOS, and ICAM1.1–6 It is hypothesized that this inflammatory state leads to damage to the retinal microvasculature, including degeneration of the capillaries with loss of the surrounding pericytes, hallmark findings in nonproliferative diabetic retinopathy.7–9 Recently, we implicated the leukotrienes, 5-lipoxygenase metabolites of arachidonic acid, as mediators of inflammation in diabetic retinopathy.10 In comparison to diabetic control mice, retinas from diabetic mice deficient in 5-lipoxygenase developed less capillary degeneration and loss of pericytes and less leukostasis, superoxide production, and activation of NF-κB.10
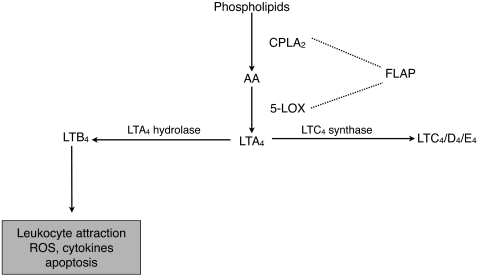
Synthesis of leukotrienes requires the sequential action of several enzymes11 (Fig. 1). Arachidonic acid is released by the calcium-dependent activation of cytosolic phospholipase A2α (cPLA2α). Arachidonic acid is then metabolized to 5-hydroperoxyeicosatetraenoic acid (5-HpETE) and, subsequently, to LTA4 by 5-lipoxygenase and its associated 5-lipoxygenase activating protein. The detection of LTA4 is complicated by its extremely short half-life (<3 seconds).12 Production of LTA4 is the first committed step in leukotriene biosynthesis. LTA4 is rapidly metabolized to LTB4 by LTA4 hydrolase or, alternatively, to LTC4 by LTC4 synthase, which requires conjugation with glutathione. LTC4 can be further metabolized to LTD4 and LTE4; collectively, these metabolites constitute the cysteinyl leukotrienes. Nonenzymatic hydrolysis of LTA4 can also occur with the formation of isomers of Δ6-trans-LTB4 and 5,6-diHETE. LTB4 is a known leukocyte attractant and binds to BLT1 and BLT2 receptors. Signaling through BLT1 has been linked to ROS generation, cytokine activation, and apoptosis.13–15 Activation of the cysteinyl leukotriene receptors CysLT1, CysLT2, and CysLTE mediates changes in vascular permeability and modulates inflammation.16–20 Leukotriene synthesis is increased in many inflammatory disease states, including asthma, colitis, arthritis, and CNS injury.16,21–26
Figure 1.
Synthesis of leukotrienes.
Although cells of the myeloid lineage are well-recognized sources of leukotriene production, an alternative synthetic pathway for leukotrienes involves transcellular metabolism.27,28 In this two-cell process of leukotriene synthesis, the donor cell (believed to be a bone marrow-derived cell, such as the neutrophil or the macrophage) generates LTA4, which then passes transcellularly to the recipient cell, where it is further metabolized to downstream leukotrienes, depending on the enzymatic repertoire of the recipient cell. In a model of neuronal ischemia in the brain, glial cells demonstrated the enzymatic capability to produce leukotrienes by transcellular biosynthesis.29 It is hypothesized that the local recipient cell generation of leukotrienes may cause focal areas of prolonged inflammation and tissue injury.27,28,30
We investigated the effects of chronic exposure to elevated glucose concentrations on the generation of leukotrienes by mouse bone marrow cells, retinal glial cells, and retinal microvascular endothelial cells as potential mediators of chronic inflammation and endothelial cell injury in the diabetic retina.
Methods
Materials
Bovine serum albumin, calcium chloride, calcium ionophore A23187, endothelial cell growth supplement, and magnesium chloride were purchased from Sigma-Aldrich (St. Louis, MO). Eicosanoid standards including [d4]LTB4 (≥97% atom D), [d4]prostaglandin E2 (PGE2; ≥98% atom D), [d8]5-hydroxyeicosatetraenoic acid ([d8]5-HETE; 98% atom D), [d4]thromboxane B2 (TXB2) (≥98% atom D), [d5]LTC4 (97% atom D), and LTB4 and LTA4 methyl ester were purchased from Cayman Chemical (Ann Arbor, MI). Dulbecco's modified Eagle's medium (DMEM), fetal bovine serum, and trypsin EDTA were purchased from Gibco-BRL (Gaithersburg, MD). Salts and solvents were purchased from Fisher Scientific (Pittsburgh, PA). Rabbit polyclonal β-tubulin, goat polyclonal BLT2 antibodies, and Western blotting luminol reagent were purchased from Santa Cruz Biotechnology (Santa Cruz, CA). Rabbit polyclonal BLT1 antibody was purchased from Imgenex Corporation (San Diego, CA). Chicken polyclonal GFAP antibody was supplied by Affinity Bio Reagents (Rockford, IL). Alexa Fluor 488 labeled-goat anti-rabbit secondary antibody was obtained from Molecular Probes (Eugene OR). Goat anti-chicken secondary antibody (Dylight 649) was purchased from Jackson ImmunoResearch Laboratories (West Grove, PA). DC protein assay kit, glycohemoglobin kit, and pure nitrocellulose membrane (0.45 μM) were obtained from Bio-Rad Laboratories (Hercules, CA). Scientific imaging film was purchased from Eastman Kodak Company (Rochester, NY). RBC lysis buffer was purchased from eBioscience (San Diego, CA). Goat serum and mounting medium (Vectashield) were obtained from Vector Laboratories (Burlingame, CA).
Animals
Wild-type C57BL/6 mice were purchased from Jackson Laboratories. When the mice were 20 to 25 g body weight (approximately 2 months of age), they were randomly assigned to become diabetic or remain as nondiabetic. All animal experiments were conducted in accordance with the ARVO Statement for the Use of Animals in Ophthalmic and Vision Research. Diabetes was induced by five sequential daily, intraperitoneal injections of a freshly prepared solution of streptozotocin in citrate buffer (pH 4.5) at 45 mg/kg body weight. By 2 weeks after injection, mice with random blood glucose levels higher than 250 mg/dL were maintained in the diabetic group. Insulin was given as needed to achieve slow weight gain without preventing hyperglycemia and glucosuria (typically 0–0.2 U NPH insulin subcutaneously, 0–3×/wk). The animals remained insulin-deficient but not grossly catabolic. The animals had free access to both food and water and were maintained under a 14 hours on/10 hours off light cycle. Food consumption and body weight were measured weekly. Glycated hemoglobin was measured to estimate the average level of hyperglycemia. Glycohemoglobin levels for diabetic animals were 12.8% ± 1.4% and 3.1% ± 0.2% for nondiabetic animals. Retinas were harvested at 3 months of diabetes duration.
Isolation of Mouse Bone Marrow
Mouse bone marrow cells were harvested from the femurs and tibiae of nondiabetic mice and diabetic mice at 3 months of diabetes duration. Briefly, the muscle tissue was dissected away. The tibia or femur was placed in a 0.5 mL Eppendorf tube with an 18-gauge hole at the bottom and a collection tube below. The bone marrow was collected by centrifugation at 1000 rpm for 30 seconds.30 Cells were suspended uniformly in HBSS by repeated gentle pipetting and were counted using a hemocytometer. Cell viability, as measured by trypan blue exclusion, was found to be greater than 99%.
Isolation of Circulating White Blood Cells
Mouse whole blood (500 μL) was collected by cardiac puncture into a vacutainer tube containing 3.6 mg K2 EDTA. Whole blood was mixed with 4 mL of 1× RBC lysis buffer and gently rocked for 5 minutes. The sample was centrifuged at 300g for 7 minutes to obtain a WBC pellet. RBC lysis was repeated as needed if any RBC remained in the pellet. After careful removal of the supernatant, the WBC pellet was washed with PBS and used for analysis of leukotriene production, as described.
Cell Culture
Retinal glial cells and mRECs were isolated and prepared as previously described.31,32 The purity of the cultures was assessed by flow cytometry. Retinal glial cells were shown to be 100% positive for glial fibrillary acidic protein, and PECAM-1 was not detected, excluding the presence of endothelial cells. mREC cultures were shown to be 100% PECAM-1 positive, and GFAP was not detected. Retinal glial cells or mRECs were grown in control medium (DMEM containing 10% serum and 5.5 mM glucose) or high-glucose medium (DMEM containing 10% serum and 25 mM glucose). Mannitol was used as an osmotic control for high glucose. In these experiments, medium contained 5 mM glucose and 20 mM mannitol instead of 25 mM glucose. Cells were cultured at 37°C in 5% CO2, and media were changed every other day for 5 days, at which time cells were confluent.
Western Blot Analysis
Mouse retinas or cultured retinal cells were sonicated in RIPA buffer (25 mM Tris, pH 7.4, 1 mM EDTA, 150 mM NaCl, 1% NP-40, 0.1% SDS, 0.5% deoxycholic acid, 1 mM phenylmethylsulfonyl fluoride, 1 μg/mL leupeptin, and 1 μg/mL aprotinin). Cultured retinal glial cells and mRECs were homogenized in buffer containing protease inhibitors (leupeptin, 1 μg/mL; aprotinin, 1 μg/mL; 1 mM, PMSF; 0.2 mM, Na3VO4). Protein content of retinal and cultured cell samples was quantified (Bio-Rad, Hercules, CA). Equivalent amounts of sample proteins were loaded, separated by SDS-PAGE, and transferred to nitrocellulose membranes. After overnight blocking in 5% nonfat dry milk, the blots were probed with primary antibodies for leukotriene B4 receptors (BLT1 and BLT2) and the species-specific secondary antibody. After extensive washing, protein bands were visualized by enhanced chemiluminescence and evaluated by densitometry. Membranes then were stripped and reprobed with antibody against tubulin to confirm equal protein loading. Densitometric analysis was performed using the public domain NIH image program developed at the National Institutes of Health with the Scion Image 1.63 program.
Reverse-Transcription PCR
Total RNA in cells grown in 100-mm Petri dishes was isolated using (RNeasy kit; Qiagen, Valencia, CA). For first-strand cDNA synthesis, 2 μg RNA was incubated for 50 minutes at 37°C in diethyl pyrocarbonate (DEPC)-treated water with 4 μL of 5× first-strand buffer, 1 μL dNTP mix (10 mM), 1 μL random primers, 1 μL RNase inhibitor (10 U/μL), 2 μL dithiothreitol (0.1 M), and 1 μL M-MLV reverse transcriptase according to the Invitrogen (Carlsbad, CA) kit protocol. PCR primer sequences were designed with primer quest tools (IDT, Coralville, IA). Primer sequences were as follows: BLT-1 forward, 5′-GAC AGC CAG GAC TAC ACA GAG AAA- 3′; BLT-1 reverse, 5′-GGA AAG CCA AAG GAT TCT TGA CCC-3′; β-actin forward, 5′-CAG AAG GAG ATT ACT GCT CTG GCT- 3′; β-actin reverse, 5′-GTG AGG GAC TTC CTG TAA CCA CTT- 3′; 5-lipoxygenase forward, 5′-ATGGATGGAGTGGAACCCCGG-3′; 5-lipoxygenase reverse, 5′-CTGTACTTCCTGTTCTAAACT-3′. All primers were synthesized by IDT. PCR was performed with 2 μL reverse transcription products in a total volume of 50 μL DEPC-treated water containing 10 μL 5× PCR buffer (HotStar HiFidelity; Qiagen) containing 7.5 mM MgSO4 and 10 mM dNTP, 1 μL (2.5 U) DNA polymerase (HotStar HiFidelity; Qiagen), and 1 μM each forward and reverse primer per tube. With the use of a Peltier thermal cycler (PTC-200; MJ Research, Waltham, MA), 35 PCR cycles were carried out at 95°C for 5 minutes, 94°C for 15 seconds, 57°C for 1 minute, and 72°C for 1 minute, and a final extension 72°C was performed for 10 minutes. Reaction products were separated on a 1% agarose gel, and bands were visualized using ethidium bromide (0.1%). The gel was scanned with an imaging system (Versa Doc, model 3000; Bio-Rad Laboratories).
Stimulation of Cells with Calcium Ionophore
Cells were treated with the calcium ionophore A23187 to mobilize calcium for activation of cPLA2α, which cleaves arachidonic acid from membrane phospholipids and makes it available for leukotriene synthesis. After removing the growth media from retinal glial cells or mRECs, HBSS (1 mL) with CaCl2 (2 mM) and MgCl2 (0.5 mM) was added to the cultures. Cells were treated with calcium ionophore A23187 dissolved in DMSO (0.5 μM final concentration in buffer) for 10 minutes. The media were collected, and the reaction was terminated by the addition of 1 mL ice-cold methanol containing labeled internal standards ([d4]LTB4, [d8]5-HETE, 2 ng each, and [d5]LTC4, [d4]PGE2, [d4]TXB2, 5 ng each). Samples were diluted with water to a final methanol concentration lower than 15% and then were extracted with a solid-phase extraction cartridge (Strata C18-E, 100 mg/1 mL; Phenomenex, Torrance, CA). The eluate (1 mL methanol) was dried down and reconstituted in 40 μL HPLC solvent A (8.3 mM acetic acid buffered to pH 5.7 with NH4OH) plus 20 μL solvent B (AcCN/methanol, 65/35, vol/vol).
Addition of Exogenous LTA4
LTA4 was obtained from the hydrolysis of LTA4 methyl ester, as previously described.33 After growth media were removed, the cells were incubated in 1 mL HBSS containing 0.1% bovine serum albumin and varied concentrations of LTA4 for 15 minutes at 37°C. For eicosanoid measurements, reactions were terminated by the addition of 1 mL ice-cold methanol containing labeled internal standards, and samples extracted after the protocol described. For leukotriene measurements from mouse retinas, whole retinas were isolated and immediately placed in 1 mL HBSS containing 1% bovine serum albumin. Varied concentrations of LTA4 were added for 15 minutes at 37°C, and the reaction was terminated by the addition of 1 mL ice-cold methanol. The retinas were homogenized before final extraction and analysis for leukotrienes.
Metabolite Separation and Analysis by Reverse-Phase HPLC and Electrospray Ionization Mass Spectrometry
An aliquot of each sample (25 μL) was injected into an HPLC system, and separation of the different metabolites was conducted using a C18 column (Gemini 150 × 2 mm, 5 μM; Phenomenex) eluted at a flow rate of 200 μL/min with a linear gradient from 45% to 98% of mobile phase B. Solvent B was increased from 45% to 75% in 12 minutes, increased to 98% in 2 minutes, and held at 98% for a further 11 minutes before re-equilibration at 45%. The HPLC system was directly interfaced into the electrospray source of a triple quadrupole mass spectrometer (Sciex API 3000; PE Sciex, Thornhill, ON, Canada) with which mass spectrometric analyses were performed in a negative ion mode using multiple reaction monitoring of the specific m/z transitions: 335→195 for LTB4 and Δ6—trans-LTB4 isomers, 335→115 for 5,6-diHETE isomers, 624→272 for LTC4, 495→177 for LTD4, 438→333 for LTE4, 319→115 for 5-HETE, 351→271 for PGE2 and PGD2, 369→169 for TXB2, 629→272 for [d5]LTC4, 327→116 for [d8]5-HETE, 339→197 for [d4]LTB4, 373→173 for [d4]TXB2, and 355→275 for [d4]PGE2. Quantitation was performed using a standard isotope dilution curve, as previously described.34
Immunofluorescence Staining of Retinal Sections
Paraffin-embedded sections of mouse retina (10 μm) were dried at 58°C overnight and deparaffinized by three washes with xylene. The sections were sequentially washed in 100%, 95%, 80%, and 70% alcohol before immersion in tap water for hydration. Tissue sections were then subjected to an antigen-retrieving protocol by which slides were treated with sodium citrate buffer (10 mM sodium citrate, 0.05% Tween 20, pH 6.0) and were microwaved for 15 minutes (three times, 5 minutes each). Tissue endogenous peroxides were quenched using 3.0% hydrogen peroxide for 10 minutes, and nonspecific binding sites were blocked using 1.5% normal goat serum for 60 minutes. Tissue sections were then incubated overnight with rabbit polyclonal antibody (1:100) for BLT1 and chicken polyclonal antibody (1:1000) for GFAP in PBS. Unbound primary antibodies were washed away using PBS containing 0.05% Tween 20 before incubation for 60 minutes with Alexa Fluor 488 labeled-goat anti-rabbit secondary antibody for the detection of BLT1 and labeled goat anti-chicken secondary antibody (Dylight 649; Jackson ImmunoResearch Laboratories) for the detection of GFAP. The sections were washed with PBS containing 0.05% Tween 20 and were mounted with mounting medium (Vectashield; Vector Laboratories) for fluorescence microscopy. Images were taken with a Nikon microscope and software (Eclipse 80i and NIS-Elements AR-3.0; Tokyo, Japan).
Cell Death Assay
Cells were cultured for 5 days in either 5 or 25 mM glucose and in the presence or absence of LTB4 (100 nM dissolved in ethanol). To some experimental dishes, the BLT1 antagonist U75302 (5 μM dissolved in DMSO) was added to the medium for the entire 5 days in culture. Control dishes received sham injections of DMSO and ethanol. Medium was exchanged every day with a fresh addition of LTB4 and U75302 to maintain the desired experimental conditions and to keep the final combined concentration of ethanol and DMSO <0.1%, vol/vol. Cell viability was measured by trypan blue exclusion assay. Briefly, an aliquot of cell suspension was diluted 1:1 (vol/vol) with 0.1% trypan blue, and the cells were counted with a hemocytometer. Cell death was defined as the percentage of blue-stained cells or dead cells versus the total number of cells. Approximately 200 to 400 cells were counted in each sample in duplicate.
Statistical Analysis
Data are expressed as mean ± SD. Because of the modest group sizes, the data were analyzed by the nonparametric Kruskal-Wallis test followed by the Mann-Whitney U test. P < 0.05 was considered statistically significant.
Results
Enhanced Leukotriene Production by Diabetic Mouse Bone Marrow Cells
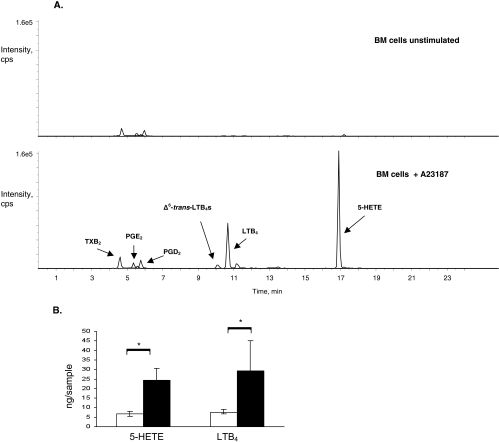
Bone marrow cells are known to produce leukotrienes on stimulation with agonists such as the calcium ionophore A23187.30,35,36 Indeed, unstimulated mouse bone marrow cells from diabetic or nondiabetic mouse did not produce leukotrienes, whereas mouse bone marrow cells stimulated with 0.5 μM A23187 produced 5-HETE and LTB4 (Fig. 2). As previously described, mouse bone marrow cells did not produce detectable amounts of cysteinyl leukotrienes.30 Small amounts of PGE2, PGD2, and TXB2 were also detected. Interestingly, when bone marrow cells from diabetic mice were similarly stimulated with calcium ionophore, 5-HETE and LTB4 production were increased more than threefold compared with that generated by stimulation of the nondiabetic bone marrow cells (Fig. 2B; 5-HETE, 6.7 ± 1.4 ng/sample from nondiabetic mice vs. 24.3 ± 6.2 ng/sample from diabetic mice; LTB4, 7.6 ± 1.0 ng/sample from nondiabetic mice vs. 29.3 ± 15.8 ng/sample from diabetic mice; both with P < 0.03).To determine whether the diabetes-induced increase in leukotriene production persisted after release from the bone marrow, circulating leukocytes were isolated and stimulated with calcium ionophore. Similarly, peripheral leukocytes from diabetic mice generated up to a sevenfold increase in 5-HETE production (e.g., 0.46 ng/sample from circulating leukocytes of a diabetic mouse vs. 0.06 ng/sample from circulating leukocytes of a nondiabetic mice) and up to a tenfold increase in LTB4 production (e.g., 0.6 ng/sample from circulating leukocytes of a diabetic mouse vs. 0.06 ng/sample from circulating leukocytes of a nondiabetic mouse).
Figure 2.
Leukotriene synthesis by mouse bone marrow cells. (A) Mass spectrometric analysis of methanol extracts of unstimulated mouse bone marrow cells produced trace amounts of eicosanoid metabolites, prostaglandins more than leukotrienes (upper tracing). When stimulated with the calcium ionophore A23187, mouse bone marrow cells produced 5-HETE and LTB4 (lower tracing). Prostaglandins, including prostaglandin E2 (PGE2), prostaglandin D2 (PGD2), and thromboxane B2 (TXB2), were also detected. (B) When stimulated with calcium ionophore, bone marrow cells from diabetic mice (black bars) produced significantly more 5-HETE and LTB4 than bone marrow cells from nondiabetic mice (white bars). Bone marrow samples were analyzed from four mice per group. *P < 0.03 in each case comparing diabetic and nondiabetic mice.
Metabolism of Exogenous LTA4 to LTB4 by the Mouse Retina
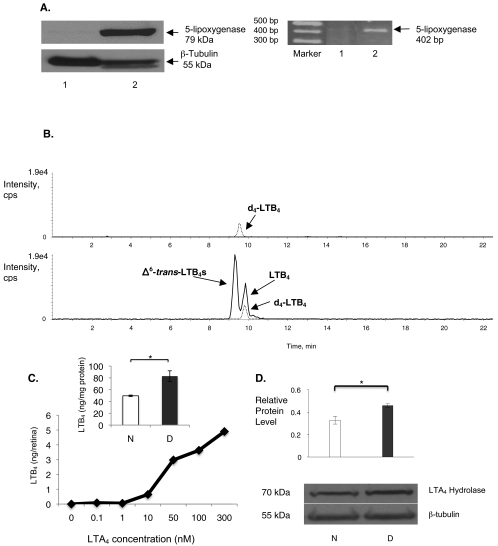
In contrast to observations in bone marrow cells, we did not detect 5-lipoxygenase by mRNA analysis of retinas (Fig. 3A). Accordingly, even when they were stimulated with calcium ionophore, methanol extracts from freshly isolated whole mouse retinas did not demonstrate the production of metabolites of 5-lipoxygenase after mass spectrometric analysis (Fig. 3B). To determine the ability to participate in leukotriene transcellular metabolism, we added LTA4 to freshly extracted retinas in bath culture. Providing LTA4 to mouse retinas, in the absence or presence of calcium ionophore, resulted in the production of LTB4 (Fig. 3B). This generation of leukotrienes was prevented by boiling the retina before adding LTA4, supporting the enzymatic production of leukotrienes. In addition, the generation of LTB4 proceeded in a dose-dependent fashion after the addition of LTA4 at various concentrations, including 0, 0.1, 1, 10, 50, 100, and 300 nM (Fig. 3C). Retinas from diabetic mice generated significantly more LTB4 after the addition of LTA4 than did those of nondiabetic mice (Fig. 3C, inset; P < 0.02). Metabolism of LTA4 to LTB4 requires the enzyme LTA4 hydrolase. Western blot analysis of whole retinal lysates of diabetic mice expressed significantly more LTA4 hydrolase than did those of nondiabetic mice (Fig. 3D; P < 0.001).
Figure 3.
Leukotriene synthesis by mouse retina. (A) Western blot analysis (left) and RT-PCR (right) analysis of mouse retina (lane 1) did not detect 5-lipoxygenase expression. As anticipated, 5-lipoxygenase was detected in mouse bone marrow cells (lane 2). Data are representative of the results in retinas isolated from six different mice. (B) Mass spectrometric analysis of methanol extracts of mouse retina did not detect leukotriene metabolites. Upper tracing: internal standard deuterated LTB4 ([d4]-LTB4). After the addition of LTA4 to the mouse retina, LTB4 was produced (lower tracing). Nonenzymatic generation of Δ6-trans-LTB4 was also detected. (C) Increasing the dose of exogenous LTA4 (0–300 nM) resulted in an increase in endogenous LTB4 production. The dose-response curve was generated using six retinas, with each retina receiving a different dose of LTA4. (C, inset) After the addition of 100 nM LTA4, LTB4 synthesis was increased in retinas from diabetic mice (D, black bar) compared with retinas from nondiabetic mice (N, white bar; n = 3 retinas per group; *P < 0.02). (D) By Western blot analysis, the expression of LTA4 hydrolase in retinas of diabetic mice (D, n = 6) was increased compared with that of nondiabetic mice (N, n = 6; *P < 0.001). The level of protein expression is depicted relative to the reference protein β-tubulin.
LTB4 Production by Mouse Retinal Glial Cells
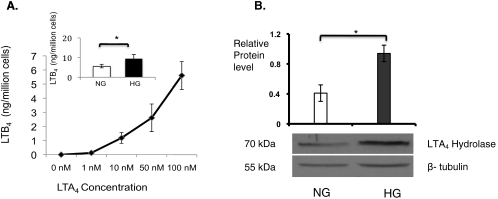
Because glial cells in the brain are known sources of eicosanoid generation, retinal glial cells (106 cells) were stimulated with calcium ionophore for 10 minutes at 37°C, followed by solid-phase extraction of lipids and RP-LC/MS/MS analysis. We did not detect LTB4 in retinal glial cell supernatants. When we provided exogenous LTA4 at various concentrations, including 0, 1, 10, 50, and 100 nM, retinal glial cells were able to convert LTA4 to LTB4 in a dose-dependent manner (Fig. 4A). Culturing retinal glial cells in high-glucose concentrations resulted in a 30% increase in the enzymatic conversion of LTA4 to LTB4 compared with glial cells cultured in physiologic glucose (Fig. 4A, inset; P < 0.02). Western blot analysis indicated that the LTA4 hydrolase expression level was twofold higher in retinal glial cells cultured in high-glucose conditions (Fig. 4B; P < 0.001). Cells cultured in media containing mannitol, used as an osmotic control, did not demonstrate increased generation of LTB4 (5.5 ± 0.3 ng/million cells in medium with physiologic glucose vs. 5.2 ± 0.8 ng/million cells in medium with mannitol) or LTA4 hydrolase expression (ratio of LTA4 hydrolase expression by retinal glial cells cultured in the presence of mannitol relative to LTA4 hydrolase expression by retinal glial cells cultured in the presence of physiologic glucose = 0.93).
Figure 4.
Leukotriene synthesis by mouse retinal glial cells. (A) Methanol extracts of mouse retinal glial cells were analyzed by mass spectrometry. Mouse retinal glial cells produced LTB4 in a dose-dependent manner after the addition of LTA4. (A, inset) After the addition of 100 nM LTA4, LTB4 synthesis was enhanced under conditions of high glucose (HG) compared with physiologic glucose (NG, n = 3; *P < 0.02). (B) Western blot analysis of retinal glial cell lysates demonstrated a high glucose (HG)-induced increase in expression of LTA4 hydrolase compared with the reference protein, β-tubulin, when compared with physiologic glucose (NG, n = 6; *P < 0.001).
LTB4 Production by Mouse Retinal Microvascular Endothelial Cells
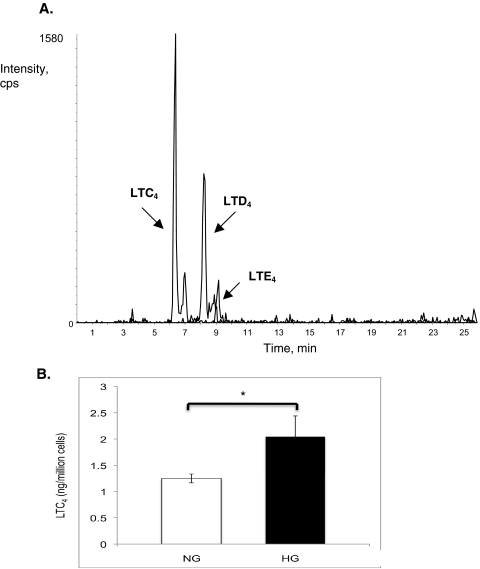
mRECs were also able to produce leukotrienes, but only when LTA4 was provided. In addition to synthesizing LTB4, mRECs synthesized cysteinyl leukotrienes (Fig. 5A). Adding 100 nM LTA4 to mREC under high-glucose concentrations resulted in the accelerated conversion of LTA4 to LTC4 (Fig. 5B; P < 0.03).
Figure 5.
Leukotriene synthesis by mouse retinal endothelial cells. (A) Methanol extracts from mouse retinal endothelial cells analyzed by mass spectrometry demonstrated production of the cysteinyl leukotrienes LTC4, LTD4, and LTE4. (B) After the addition of 100 nM LTA4, synthesis of LTC4 by mouse retinal endothelial cells was increased under high glucose (black bar) compared with physiologic glucose (white bar; n = 6; *P < 0.03).
High-Glucose Regulation of BLT1 Receptor Expression
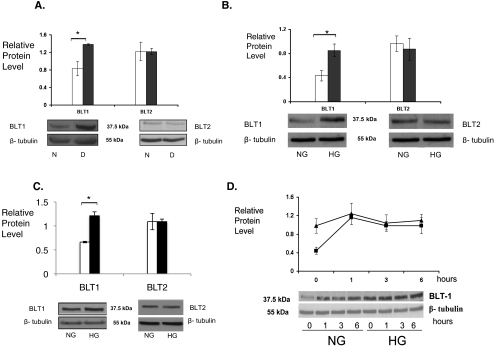
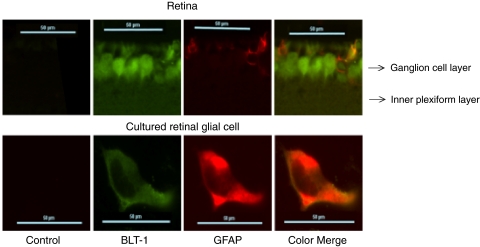
Previously, we reported a twofold increase in protein expression of BLT1 in diabetic mouse retinas compared with nondiabetic mouse retinas (Fig. 6A; P < 0.01). In contrast, BLT2 was expressed in the retina but was not enhanced by hyperglycemia. In retinal glial cells, high glucose levels significantly elevated the BLT1 receptor protein 33%, compared with glial cells grown in physiologic glucose (Fig. 6B; P < 0.005). BLT1 expression was unchanged in the presence of mannitol (ratio of BLT1 expression by retinal glial cells cultured in the presence of mannitol to BLT1 expression by retinal glial cells cultured in the presence of physiologic glucose = 1.0). mRECs also expressed BLT1 and BLT2 with a similar selective increase in BLT1 expression levels under high-glucose conditions (Fig. 6C; P < 0.005). To evaluate whether the BLT1 receptors expressed on retinal glial cells were functional LTB4 receptors, we investigated the effect of the ligand LTB4 (100 nM) on BLT1 expression. LTB4 addition resulted in an increase in the expression of BLT1 receptor protein in retinal glial cells (Fig. 6D). The peak expression of BLT1 stimulated by the addition of LTB4 was identical with that seen when cultured under high glucose conditions (Fig. 6D). As suggested by these in vitro experiments, BLT1 and the glial cell marker GFAP colocalized in cultured retinal glial cells and in retinal sections with the use of immunofluorescence (Fig. 7).
Figure 6.
High glucose increases BLT1 receptor expression. Western blot analysis of mouse retinas (A), mouse retinal glial cells (B), and mRECs (C) demonstrated a high glucose-induced increase in BLT1 expression, but not BLT2 expression (physiologic glucose: N or NG, white bars; high glucose: D or HG, black bars). For analysis of mouse retinas, six diabetic and six nondiabetic retinas were analyzed (BLT1; *P < 0.01). Experiments with cultured cells were conducted in triplicate. (BLT1; *P < 0.005 for mouse retinal glial cells and for mRECs). (D) Addition of LTB4 to retinal glial cells grown in physiologic glucose (NG) concentrations induced the expression of BLT1 (squares). Maximal expression of BLT1 under these conditions was similar to the increased expression of BLT1 seen under high-glucose (HG) conditions (triangles). The level of protein expression is depicted relative to the reference protein β-tubulin.
Figure 7.
Colocalization of BLT1 and the glial cell marker GFAP. Sections of mouse retina were analyzed for BLT1 and GFAP expression using immunofluorescence. Top: ganglion cell layer and the inner plexiform layer of the retina are shown. Left to right: lack of immunofluorescence detected in control sections stained with only secondary antibodies. BLT1 expression (green), followed by GFAP expression (red), and finally the color overlay demonstrating colocalization of BLT1 and GFAP in retinal glial cells. Bottom: similar results for a cultured retinal glial cell. Sections are representative of the results from eight retinal sections from four mice, and the cultured cell is representative of four different experiments.
BLT1-Mediated Endothelial Cell Death
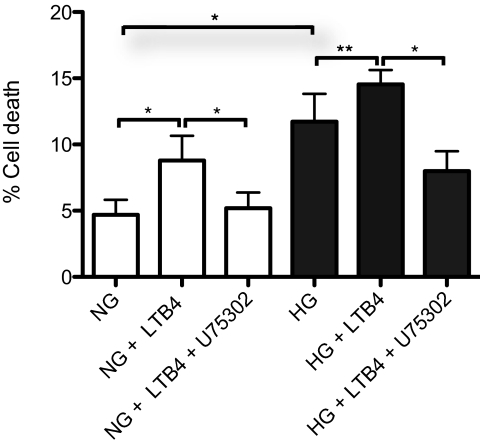
Our previous in vivo studies in mice suggested that metabolites of 5-lipoxygenase might mediate the diabetes-induced degeneration of retinal capillaries. The loss of capillaries may result from endothelial cell death. To investigate whether LTB4 and BLT1 mediate retinal microvascular endothelial cell death, mRECs were cultured for 5 days in media containing 100 nM LTB4. Under physiologic glucose conditions, LTB4 induced a twofold increase in mREC cell death (Fig. 8; P < 0.005). Treatment of mRECs with U75302, a BLT1 antagonist, inhibited LTB4-induced cell death (Fig. 8; P < 0.005). Although culturing in high glucose alone increased mREC cell death, LTB4 significantly augmented high glucose-induced cell death (HG vs. NG, P < 0.005; HG vs. HG + LTB4, P < 0.03), U75302 inhibited LTB4 and high glucose-induced cell death (Fig. 8; P < 0.005).
Figure 8.
BLT1 mediates retinal microvascular endothelial cell death. When cultured under physiologic glucose conditions, the addition of 100 nM LTB4 to mRECs increased mREC death, as determined by trypan blue exclusion assay (*P < 0.005). Inclusion of the BLT1 antagonist U75302 completely inhibited the effect of LTB4 on cell death (*P < 0.005). When mRECs were cultured under high-glucose conditions, an increase in cell death was noted, and the addition of LTB4 further increased the observed cell death (HG vs. NG, *P < 0.005; HG vs. HG + LTB4, **P < 0.03). U75302 treatment significantly reduced mREC cell death in the presence of high glucose and LTB4 (*P < 0.005). Data are the summary of six independent experiments.
Discussion
Leukotrienes are well-recognized mediators of inflammation.16,20,22,23 Using diabetic mice and cultured retinal cells, we demonstrated that marrow-derived cells from diabetic animals synthesize more LTB4 than do those from nondiabetic animals; the mouse retina, retinal glial cells, and mRECs require donor LTA4 for the synthesis of leukotrienes by transcellular metabolism; high-glucose conditions enhance leukotriene production by retinal glial cells; and high-glucose conditions increase BLT1 receptor expression in retinal glial cells and mREC, which may result in retinal microvascular endothelial cell death.
Our previous studies demonstrated that mice lacking 5-lipoxygenase were remarkably resistant to the development of the vascular histopathology of early diabetic retinopathy. The initial findings of an absence of 5-lipoxygenase expression and metabolite production by the retina or the retinal cells presented a dilemma regarding the source of leukotriene production. The predominant expression of 5-lipoxygenase in myeloid cells make these cells a likely source. The generation of leukotrienes could proceed via two scenarios and contribute to retinal abnormalities. First, myeloid-derived cells alone could produce the leukotrienes. Circulating leukocytes could generate the leukotrienes, which then have paracrine effects on the cells of the retinal vasculature. Additionally, we cannot exclude that some low-level generation of LTA4 may occur within the retina from a small number of adherent leukocytes that have migrated out of the microvasculature or other cells of the myeloid lineage (e.g., microglia) that are residents of the retina. Yet, in a second scenario, both leukocytes and retinal cells participate in transcellular metabolism of leukotrienes. Earlier observations that leukocytes adhere to the retinal microvasculature support the suggestion of cell-to-cell passage of leukocyte-derived LTA4 to the retinal cells, and our current results demonstrate the ability of the retina and retinal cells to synthesize leukotrienes after the delivery of LTA4.
There are several mechanisms by which elevated glucose may lead to increased leukotriene production. Our current findings of enhanced ionophore-stimulated production of LTB4 by mouse bone marrow cells under diabetic conditions suggests that elevated glucose levels may prime marrow-derived cells to generate LTA4 and LTB4. Furthermore, leukocytes have been shown to adhere more readily to the diabetic retinal microvasculature in mice, as described by our laboratory as well as by others.5,10,37 This suggests that diabetic conditions may facilitate the transfer of precursor LTA4 for transcellular biosynthesis of leukotrienes. Finally, we detected the increased expression of LTA4 hydrolase in the retina and retinal glial cells under elevated glucose conditions, suggesting enhanced ability to further metabolize leukotrienes.
The immunolocalization of BLT1 to glial cells in retinal slices is consistent with the Western blot detection of BLT1 in the whole retinal lysates and retinal glial cell cultures. Interestingly, BLT1 was also detected in other cells in the retinal ganglion cell layer. Rat neurons have been shown to participate in transcellular metabolism of leukotrienes.29 A similar pattern of expression of another inflammatory mediator, NF-κB, has been detected previously in the retinal ganglion cell layer, and NF-κB is thought to play an important role in the inflammatory response in the diabetic retina.10,38 In mice deficient in 5-lipoxygenase, cells in the retinal ganglion cell layer did not express a diabetes-induced increase in NF-κB expression as seen in diabetic wild-type mice. 10 This suggests that leukotrienes may play a role in NF-κB regulation in the diabetic retina.
Previously, it has been reported that cysteinyl leukotrienes are produced by retinal pericytes cocultured with leukocytes by transcellular metabolism.39 We now demonstrate the transcellular production of cysteinyl leukotrienes by mRECs. Based on these findings, we hypothesize that production of cysteinyl leukotrienes by microvascular endothelial cells, pericytes, and perhaps other cells alters microvascular permeability leading to the delivery of LTA4 to the surrounding glial cells, where the inflammatory signal is amplified. The increased retinal microvascular endothelial cell death observed after the addition of LTB4 suggests that the LTB4 produced may activate the BLT1 receptor on mRECs and trigger pathways that lead to capillary degeneration. Thus, the increased transcellular generation of leukotrienes under diabetic conditions may contribute to pathologic capillary degeneration in diabetic retinopathy. Further study of the intracellular cascades that participate in BLT1-mediated retinal microvascular endothelial cell death may reveal new therapeutic approaches to this sight-threatening disease.
Footnotes
Supported by National Eye Institute Grant K08EY16833 (RGK). Histology service was provided by the Case Western Reserve University Visual Science Research Center Core Facilities (P30EY11373).
Disclosure: R. Talahalli, None; S. Zarini, None; N. Sheibani, None; R.C. Murphy, None; R.A. Gubitosi-Klug, None
References
- 1.Antonetti DA, Barber AJ, Khin S, Lieth E, Tarbell JM, Gardner TW. Vascular permeability in experimental diabetes is associated with reduced endothelial occludin content: vascular endothelial growth factor decreases occludin in retinal endothelial cells. Penn State Retina Research Group Diabetes 1998;47:1953–1959 [DOI] [PubMed] [Google Scholar]
- 2.Antonetti DA, Lieth E, Barber AJ, Gardner TW. Molecular mechanisms of vascular permeability in diabetic retinopathy. Semin Ophthalmol 1999;14:240–248 [DOI] [PubMed] [Google Scholar]
- 3.Du Y, Miller CM, Kern TS. Hyperglycemia increases mitochondrial superoxide in retina and retinal cells. Free Radical Biol Med 2003;35:1491–1499 [DOI] [PubMed] [Google Scholar]
- 4.Gardner TW, Antonetti DA, Barber AJ, LaNoue KF, Nakamura M. New insights into the pathophysiology of diabetic retinopathy: potential cell-specific therapeutic targets. Diabetes Technol Ther 2000;2:601–608 [DOI] [PubMed] [Google Scholar]
- 5.Joussen AM, Poulaki V, Le ML, et al. A central role for inflammation in the pathogenesis of diabetic retinopathy. FASEB J 2004;18:1450–1452 [DOI] [PubMed] [Google Scholar]
- 6.Kowluru RA, Chan PS. Oxidative stress and diabetic retinopathy. Exp Diabetes Res 2007;2007:43603 [DOI] [PMC free article] [PubMed] [Google Scholar]
- 7.Aguilar E, Friedlander M, Gariano RF. Endothelial proliferation in diabetic retinal microaneurysms. Arch Ophthalmol 2003;121:740–741 [DOI] [PubMed] [Google Scholar]
- 8.Cogan DG, Kuwabara T. The mural cell in perspective. Arch Ophthalmol 1967;78:133–139 [DOI] [PubMed] [Google Scholar]
- 9.Engerman RL. Pathogenesis of diabetic retinopathy. Diabetes 1989;38:1203–1206 [DOI] [PubMed] [Google Scholar]
- 10.Gubitosi-Klug RA, Talahalli R, Du Y, Nadler JL, Kern TS. 5-Lipoxygenase, but not 12/15-lipoxygenase, contributes to degeneration of retinal capillaries in a mouse model of diabetic retinopathy. Diabetes 2008;57:1387–1393 [DOI] [PMC free article] [PubMed] [Google Scholar]
- 11.Murphy RC, Gijon MA. Biosynthesis and metabolism of leukotrienes. Biochem J 2007;405:379–395 [DOI] [PubMed] [Google Scholar]
- 12.Fitzpatrick FA, Morton DR, Wynalda MA. Albumin stabilizes leukotriene A4. J Biol Chem 1982;257:4680–4683 [PubMed] [Google Scholar]
- 13.Islam SA, Thomas SY, Hess C, et al. The leukotriene B4 lipid chemoattractant receptor BLT1 defines antigen-primed T cells in humans. Blood 2006;107:444–453 [DOI] [PMC free article] [PubMed] [Google Scholar]
- 14.Lundeen KA, Sun B, Karlsson L, Fourie AM. Leukotriene B4 receptors BLT1 and BLT2: expression and function in human and murine mast cells. J Immunol 2006;177:3439–3447 [DOI] [PubMed] [Google Scholar]
- 15.Pompeia C, Freitas JJ, Kim JS, Zyngier SB, Curi R. Arachidonic acid cytotoxicity in leukocytes: implications of oxidative stress and eicosanoid synthesis. Biol Cell 2002;94:251–265 [DOI] [PubMed] [Google Scholar]
- 16.Austen KF. The mast cell and the cysteinyl leukotrienes. Novartis Found Symp 2005;271:166–175; discussion 176–168, 198–169 [DOI] [PubMed] [Google Scholar]
- 17.Letts LG. Leukotrienes: role in cardiovascular physiology. Cardiovasc Clin 1987;18:101–113 [PubMed] [Google Scholar]
- 18.Maekawa A, Kanaoka Y, Xing W, Austen KF. Functional recognition of a distinct receptor preferential for leukotriene E4 in mice lacking the cysteinyl leukotriene 1 and 2 receptors. Proc Natl Acad Sci U S A 2008;105:16695–16700 [DOI] [PMC free article] [PubMed] [Google Scholar]
- 19.Osher E, Weisinger G, Limor R, Tordjman K, Stern N. The 5 lipoxygenase system in the vasculature: emerging role in health and disease. Mol Cell Endocrinol 2006;252:201–206 [DOI] [PubMed] [Google Scholar]
- 20.Peters-Golden M. Expanding roles for leukotrienes in airway inflammation. Curr Allergy Asthma Rep 2008;8:367–373 [DOI] [PubMed] [Google Scholar]
- 21.Crooks SW, Stockley RA. Leukotriene B4. Int J Biochem Cell Biol 1998;30:173–178 [DOI] [PubMed] [Google Scholar]
- 22.Cuzzocrea S, Rossi A, Mazzon E, et al. 5-Lipoxygenase modulates colitis through the regulation of adhesion molecule expression and neutrophil migration. Lab Invest 2005;85:808–822 [DOI] [PubMed] [Google Scholar]
- 23.Farooqui AA, Horrocks LA, Farooqui T. Modulation of inflammation in brain: a matter of fat. J Neurochem 2007;101:577–599 [DOI] [PubMed] [Google Scholar]
- 24.Huang XJ, Zhang WP, Li CT, et al. Activation of CysLT receptors induces astrocyte proliferation and death after oxygen-glucose deprivation. Glia 2008;56:27–37 [DOI] [PubMed] [Google Scholar]
- 25.Mathis S, Jala VR, Haribabu B. Role of leukotriene B4 receptors in rheumatoid arthritis. Autoimmun Rev 2007;7:12–17 [DOI] [PMC free article] [PubMed] [Google Scholar]
- 26.Sharma JN, Mohammed LA. The role of leukotrienes in the pathophysiology of inflammatory disorders: is there a case for revisiting leukotrienes as therapeutic targets? Inflammopharmacology 2006;14:10–16 [DOI] [PubMed] [Google Scholar]
- 27.Fabre JE, Goulet JL, Riche E, et al. Transcellular biosynthesis contributes to the production of leukotrienes during inflammatory responses in vivo. J Clin Invest 2002;109:1373–1380 [DOI] [PMC free article] [PubMed] [Google Scholar]
- 28.Folco G, Murphy RC. Eicosanoid transcellular biosynthesis: from cell-cell interactions to in vivo tissue responses. Pharmacol Rev 2006;58:375–388 [DOI] [PubMed] [Google Scholar]
- 29.Farias SE, Zarini S, Precht T, Murphy RC, Heidenreich KA. Transcellular biosynthesis of cysteinyl leukotrienes in rat neuronal and glial cells. J Neurochem 2007;103:1310–1318 [DOI] [PubMed] [Google Scholar]
- 30.Gijon MA, Zarini S, Murphy RC. Biosynthesis of eicosanoids and transcellular metabolism of leukotrienes in murine bone marrow cells. J Lipid Res 2007;48:716–725 [DOI] [PubMed] [Google Scholar]
- 31.Scheef E, Wang S, Sorenson CM, Sheibani N. Isolation and characterization of murine retinal astrocytes. Mol Vis 2005;11:613–624 [PubMed] [Google Scholar]
- 32.Su X, Sorenson CM, Sheibani N. Isolation and characterization of murine retinal endothelial cells. Mol Vis 2003;9:171–178 [PubMed] [Google Scholar]
- 33.Carrier DJ, Bogri T, Cosentino GP, Guse I, Rakhit S, Singh K. HPLC studies on leukotriene A4 obtained from the hydrolysis of its methyl ester. Prostaglandins Leukot Essent Fatty Acids 1988;34:27–30 [DOI] [PubMed] [Google Scholar]
- 34.Hall LM, Murphy RC. Electrospray mass spectrometric analysis of 5-hydroperoxy and 5-hydroxyeicosatetraenoic acids generated by lipid peroxidation of red blood cell ghost phospholipids. J Am Soc Mass Spectrom 1998;9:527–532 [DOI] [PubMed] [Google Scholar]
- 35.Mencia-Huerta JM, Razin E, Ringel EW, et al. Immunologic and ionophore-induced generation of leukotriene B4 from mouse bone marrow-derived mast cells. J Immunol 1983;130:1885–1890 [PubMed] [Google Scholar]
- 36.Stenke L, Lauren L, Reizenstein P, Lindgren JA. Leukotriene production by fresh human bone marrow cells: evidence of altered lipoxygenase activity in chronic myelocytic leukemia. Exp Hematol 1987;15:203–207 [PubMed] [Google Scholar]
- 37.Zheng L, Du Y, Miller C, et al. Critical role of inducible nitric oxide synthase in degeneration of retinal capillaries in mice with streptozotocin-induced diabetes. Diabetologia 2007;50:1987–1996 [DOI] [PubMed] [Google Scholar]
- 38.Zheng L, Szabo C, Kern TS. Poly(ADP-ribose) polymerase is involved in the development of diabetic retinopathy via regulation of nuclear factor-κB. Diabetes 2004;53:2960–2967 [DOI] [PubMed] [Google Scholar]
- 39.McMurdo L, Stephenson AH, Baldassare JJ, Sprague RS, Lonigro AJ. Biosynthesis of sulfidopeptide leukotrienes via the transfer of leukotriene A4 from polymorphonuclear cells to bovine retinal pericytes. J Pharmacol Exp Ther 1998;285:1255–1259 [PubMed] [Google Scholar]


