This study demonstrates the upregulation of EphB/ephrin-B signaling at the optic nerve head in a laser-induced mouse model of ocular hypertension. Reverse ephrin-B signaling is preferentially activated on morphologically preserved axons but not on axons exhibiting signs of reactivity plasticity.
Abstract
Purpose.
To use a laser-induced ocular hypertension (LIOH) mouse model to examine the optic nerve head (ONH) expression of EphB/ephrin-B, previously shown to be upregulated in glaucomatous DBA/2J mice. To relate ephrin-B reverse signaling with states of axonal response to disease.
Methods.
LIOH was induced unilaterally in CD-1 mice by laser photocoagulation of limbal and episcleral veins. Intraocular pressure (IOP) was measured with a tonometer. EphB/ephrin-B mRNA expression was assessed by in situ hybridization on eyecup cryosections and real-time PCR. Cell specific markers were used to identify the cellular origin of EphB/ephrin-B expression. Activation of ephrin-B signaling was investigated with a phosphospecific antibody on cryosections and retinal whole-mounts.
Results.
Upregulation of EphB/ephrin-B expression occurred early within a day of IOP elevation. A transient increase of phosphorylation-dependent ephrin-B (pEB) reverse signaling was observed in ONH axons, microglia, and some astrocytes. Morphologically unaffected retinal ganglion cell (RGC) axons differed from axons with reactive aberrant trajectories by exhibiting increased pEB activation, whereas pEB levels in morphologically affected axons were comparable to those of controls.
Conclusions.
An Eph-ephrin signaling network is activated at the ONH after LIOH in CD-1 mice, either before or coincident with the initial morphologic signs of RGC axon damage reported previously. Of note, ephrin-B reverse signaling was transiently upregulated in RGC axons at the ONH early in their response to IOP elevation but was downregulated in axons that had been damaged by glaucomatous injury and exhibited aberrant trajectories. Ephrin-B reverse signaling may mark RGC axons for damage or confer a protective advantage against injury.
Glaucoma is a major cause of blindness worldwide and is characterized by the progressive loss of retinal ganglion cells (RGCs). Although both clinical presentation and experimental data implicate the optic nerve head (ONH) as a likely site of RGC axon damage,1–3 the pathophysiological mechanisms are not fully understood. The deformation of collagen plates in the lamina cribrosa region of human and monkey ONH secondary to elevated intraocular pressure (IOP) has been proposed to cause compressive4 or ischemic5,6 axon injury. However, the development of glaucomatous RGC axon damage in mice,7 which do not have a collagenous lamina cribrosa, argues that additional factors may be involved. Substantial cellular and molecular changes have been observed in ONH axons, astrocytes, and microglia8,9 in glaucomatous animals, suggesting that axon-glia interactions may be involved in pathogenic mechanisms or may mediate tissue responses to glaucomatous injury.
Recent work has linked specific ONH upregulation of Eph and ephrin signaling molecules to the presence of RGC axon damage in DBA/2J glaucomatous mice.10 The Eph family of receptor tyrosine kinases and their ephrin ligands orchestrate not only developmental morphogenesis and axon guidance,11,12 they also function in adult processes such as synaptic plasticity, insulin secretion, and bone maintenance.13 Of note, Ephs and ephrins have been observed in a variety of central nervous system (CNS) abnormalities14,15 and have been demonstrated in transgenic mice to modulate axonal or glial responses after spinal cord and optic nerve injuries.16,17 In DBA/2J mice, EphB2 and ephrin-B2 upregulation was tightly associated with RGC axon pathology and was not detected in age-matched nonglaucomatous animals. However, it remains unclear whether Eph and ephrin upregulation are fundamental features of glaucoma across animal models and how the spatial and temporal characteristics of Eph/ephrin signaling relate to pathologic conditions of RGCs and their axons.
To better understand the potential role of Eph/ephrin signaling in glaucoma, we undertook a detailed analysis of Eph/ephrin expression, their cellular origin, and activation of signaling using a laser-induced ocular hypertension (LIOH) mouse model described previously.18 In this model, the onset of IOP elevation is under investigator control, thus allowing examination of the early pathologic events that impact RGCs and their axons. In mice subjected to LIOH, similar to DBA/2J mice, an early morphologic sign of glaucomatous damage is observed in RGC axons at the ONH. After laser treatment, axon response/damage at the ONH is present by 4 days, and by 7 days, two morphologically distinct populations of RGC axons can be observed. One population has yet to exhibit overt morphologic responses to glaucomatous damage and appears as structurally intact, straight axons through the ONH. The second population consists of axons that have already lost a distal segment and exhibit reactive plasticity characterized by abnormal looping and meandering trajectories of the proximal segment. Although all RGC axons at the ONH are potentially exposed to glaucomatous damage, the presence of these two clearly recognizable axon populations offers an opportunity to identify events specifically occurring within RGC axons early in the injury process, before overt morphologic responses.
In the present study, we describe EphB/ephrin-B mRNA upregulation and the presence of an ephrin-B reverse signaling network involving axons, microglia, and astrocytes at the ONH during early stages of disease. We further demonstrate that ephrin-B reverse signaling was preferentially associated with RGC axons that have yet to exhibit morphologic evidence of damage but was downregulated in RGC axons at later stages of injury that responded with reactive plasticity changes, including aberrant trajectories in the pre-lamina ONH region.
Materials and Methods
Animals
CD-1 mice were purchased from Charles River Laboratories (Wilmington, MA) and housed in animal facilities at the University of California, San Francisco (UCSF). All experiments were performed in animals 3 to 6 months of age under protocols approved by the UCSF Institutional Animal Care and Use Committee and in accordance with the ARVO Statement for the Use of Animals in Ophthalmic and Vision Research.
Laser-Induced Ocular Hypertension
Adult albino CD-1 mice were anesthetized with intraperitoneal injections of 90 mg/kg ketamine HCl and 6 mg/kg xylazine. Photocoagulation of limbal and three episcleral veins was induced unilaterally with a diode laser (532 nm; Lumenis, Santa Clara, CA) mounted on a slit lamp biomicroscope to obstruct aqueous outflow.18 The translimbal laser treatment (150-mW laser power, 0.2-second duration, 100-μm diameter spot size) was performed over 270° to 300°, sparing the nasal aspect and the long posterior ciliary arteries. Bacitracin antibiotic ointment was administered to the operative eye. Only one eye in each animal was treated once, and the contralateral eye served as control.
IOP Measurement
Mice were anesthetized with 90 mg/kg ketamine HCl and 6 mg/kg xylazine, and IOP in both eyes was measured with a rebound tonometer (TonoLab; Colonial Medical Supply, Franconia, NH) between 10 am and noon. Only eyes that exhibited IOP elevation above 21 mm Hg after laser treatment were selected for subsequent analysis. Mice with overt signs of ocular inflammation were euthanatized and excluded from the study.
Cryostat Section Preparation
Mice were injected intraperitoneally with overdoses of pentobarbital (>200 mg/kg) and were perfused transcardially with 4% paraformaldehyde (PFA) in 0.1 M phosphate-buffered saline (PBS; pH 7.4). Eyes were enucleated along with retrobulbar segment of the optic nerve. The anterior segment, lens, and vitreous were dissected away from the eyecup, consisting of the retina and optic nerve. The eyecups were then immersion-fixed in the same fixative at 4°C overnight, cryoprotected with 30% sucrose, and embedded in optimal cutting temperature (OCT) compound (Tissue-Tek; Sakura Finetek, Torrance, CA). Cryosections 10 μm in thickness were cut along the longitudinal axis through the ONH, mounted on slides (Super Frost Plus; Fisher Scientific, Springfield, NJ), and subjected to either immunostaining or in situ hybridization. For in situ hybridization, diethyl pyrocarbonate-treated PBS was used for all steps during sample processing to maximize preservation of RNA integrity.
Immunohistochemistry
Immunohistochemical studies were performed as previously described.18 Briefly, cryosections were washed with 0.1 M PBS and blocked with 10% normal donkey serum for 30 minutes at room temperature. For most experiments, tissue permeabilization was achieved by the inclusion of 0.1% Triton X-100 in the blocking solution. For detection of phospho-ephrin-B, however, Triton X-100 was omitted because detergent treatment had the tendency to extract this antigen from the membrane or to cause its lateral dispersion, resulting in a diminution of punctate staining. Tissue sections were instead permeabilized by incubation with methanol containing 20% dimethyl sulfoxide for 30 minutes at room temperature. After primary antibodies were incubated overnight at 4°C followed by PBS washes, secondary antibodies were applied for 1 hour at room temperature. Slides were counterstained with 4′,6-diamidino-2-phenylindole to label nuclei when appropriate and were mounted in 97% 2,2′-thiodiethanol (TDE; Sigma, St. Louis, MO).
The following primary antibodies were used: rabbit anti-tubulin β-III (1:500; Sigma), mouse anti-neurofilament (SMI312; 1:500; Covance Research Products, Denver, PA), rat anti-glial fibrillary acidic protein (GFAP; 1:200; Zymed, South San Francisco, CA), rabbit anti-S100 (1:200; Sigma), rabbit anti-Iba-1 (1:50; Wako Chemicals, Richmond, VA), rabbit anti-NG2 (1:400; Chemicon, Temecula, CA), rabbit anti-phospho-ephrin-B (1:100; Cell Signaling Technology, Beverly, MA), rat anti-CD11b (1:50; Serotec, Indianapolis, IN). Multicolor labeling was accomplished with secondary antibodies conjugated to tetramethyl rhodamine (TMR; 1:200; Invitrogen, Carlsbad, CA) or Cy3, Cy2, and Cy5 (1:200; Jackson ImmunoResearch, West Grove, PA). Confocal microscopy was performed on a laser scanning microscope (LSM5 Pascal; Carl Zeiss Meditec, Inc., Thornwood, NY), as previously described.18
Retinal Whole-Mount
Details of the retinal whole-mount protocol have been described elsewhere.18 Briefly, eyes were harvested from transcardially perfused animals. Anterior segment, lens, vitreous, and optic nerve were removed, and the whole retinas were gently freed from the sclera. The retinas were then flattened onto a small piece of Millipore (Billerica, MA) filter paper after four radial cuts were made and were postfixed in 4% PFA for 30 minutes to 1 hour. Permeabilization with 0.3% Triton X-100 and blocking with 10% normal donkey serum were carried out for 30 minutes each at room temperature, followed by primary and secondary antibody incubation. Retinas were mounted in 97% TDE and coverslipped.
In Situ Hybridization
Digoxigenin-labeled RNA probes specific for EphB2, EphB3, ephrin-B1, ephrin-B2, and ephrin-B3 were prepared as previously described.19 Probe hybridization was carried out at 60°C overnight and was detected with fluorescence microscopy after application of the TSA-plus fluorescein system (PerkinElmer Life Sciences, Wellesley, MA). Given that EphB2, EphB3, and ephrin-B3 demonstrated the most robust and reproducible upregulation, we focused our analysis using these probes. To identify the cellular origin of mRNAs, fluorescent in situ hybridization was followed by immunohistochemistry with cell type-specific antibody markers.
Experimental Controls
At least three pairs of eyes or ONHs were examined for every antibody marker or mRNA probe (summarized as n in figure legends). From each sample, at least three tissue sections were analyzed. In experiments comparing signal intensity between different treatment groups, all samples were processed in parallel and were imaged under identical microscope settings. Experiments in which the primary antibody was omitted served as negative controls.
Real-time Polymerase Chain Reaction
The ONH region was dissected from laser-treated and contralateral control eyes. Total RNA was isolated with a purification kit (RNeasy Micro Kit; Qiagen Valencia, CA). The amount of RNA was measured with a spectrophotometer (ND-1000 UV-Vis; NanoDrop Technologies, Wilmington, DE). At least 50 ng RNA was reverse-transcribed into cDNA with a cDNA synthesis kit (iScript Select; Bio-Rad, Hercules, CA). Sequence-specific primers for extracellular domains of mouse EphB2, EphB3, and ephrin-B3 were designed by Primer3 (www.primer3.com) and synthesized by Integrated DNA Technology (Coralville, IA). The following primer sequences were used to amplify EphB2, EphB3, and ephrin-B3, respectively: forward 5′-GAT GGT ACA TCC CCC ATC AG-3′, reverse 5′-ACG CAC CGA GAA CTT CAT CT-3′; forward 5′-GCT GGT GAG TTT GGG GAA GTG-3′, reverse 5′-GTG ACC CCA ATC CTT AGC AG-3′; and forward 5′-GAC GGC GGG CCA AGC CTT CGG AGA G-3′, reverse 5′-ATA GCC AGG AGG AGC CAA AGA G-3′. Glyceraldehyde-3-phosphate dehydrogenase (GAPDH) was used as a reference gene to normalize the level of mRNA expression of EphB2, EphB3, and ephrinB-3. Sequence-specific primers for mouse GAPDH were as follows: forward 5′-GCA CAG TCA AGG CCG AGA AT-3′, reverse 5′-GCC TTC TCC ATG GTG GTG AA-3′. Real-time PCR was performed with a real-time detection system (iCycler System MyiQ; Bio-Rad) according to the manufacturer's protocol. Briefly, cDNA and 1 mM MgCl2 were mixed with reagent (iQ SYBR Green Supermix; Bio-Rad) in a total volume of 20 μL. The thermo cycle was 95°C for 3 minutes followed by 40 cycles at 95°C for 10 seconds and 60°C for 1 minute. Real-time PCR was performed in triplicate. Melting-curve was created to verify the specificity of the product. The melting curve was established at 95°C for 1 minute followed by 55°C for 1 minute with 0.5°C increments for 80 cycles. Series dilutions were run for GAPDH to generate standard curves for each sample. PCR products were confirmed on 2% agarose gel. Data were obtained with optical system software (MyiQ; Bio-Rad). Because the expression of EphB/ephrin-B mRNAs was most concentrated in the ONH region based on in situ hybridization findings, a correction was performed to exclude the dilution effect on mRNA signals from the myelinated optic nerve segment carried over during dissection. Briefly, a dilution factor (DF) was calculated by dividing the total RNA of each sample by the amount of RNA used for quantitative PCR. A corrected Ct value was obtained by applying formula Ct (corrected) = Ct (read) − Log (DF)/log E, where E was the amplification efficiency. The corrected Ct was further normalized to GAPDH from the same sample. The relative expression level of EphB2, EphB3, and ephrin-B3 in experimental eyes was compared to contralateral untreated eyes by using the Pfaffl method.20
Quantification of pEB Expression
On whole-mounted retinas, one image from each quadrant adjacent to the optic disc was acquired using the 63× oil immersion lens on a confocal microscope. Fluorescence labeling of NF and pEB was assigned to the green channel and red channel, respectively. Quantification was carried out with graphics editing software (PhotoShop CS2; Adobe, San Jose, CA). First with the red channel masked, the green channel (NF) was used to visualize axon profiles and guide selection of regions of interest (ROIs). In each LIOH retina, three aberrant axon segments that deviated from the normal radial course were outlined and defined as ROIs. Within these “aberrant” ROIs, the mean fluorescence intensity in the red channel representing pEB was then quantified. Morphologically normal axons were tightly bundled, making it difficult to outline individual axons. The same ROI shapes used for aberrant axons in the same retina were, therefore, loaded and overlaid on healthy axon bundles to quantify their mean pEB intensity. Similarly, pEB levels in the contralateral control retina were determined with the same set of ROIs as its partner experimental eye. This protocol ensured that comparable sizes were analyzed for each condition (control, laser normal, and laser aberrant) in a pair of retinas from the same animal. Fluorescence intensities in each retinal pair were then averaged and normalized by the value of control. Six pairs of retinas were analyzed 7 days after laser photocoagulation, because this represented the earliest time point at which reactive plasticity was consistently and robustly present.
Statistical Analysis
RT-PCR results were analyzed by two-way analysis of variance (ANOVA) followed by post hoc Bonferroni multiple comparison test. The pEB quantification data were subjected to one-way ANOVA followed by Tukey's multiple comparison test. Statistical tests were performed using statistical software (Prism version 5; GraphPad, San Diego, CA), with a significance level set at P < 0.05. Values were reported as mean ± SEM.
Results
Upregulation of Eph and ephrin mRNAs at the Laser-Treated ONH
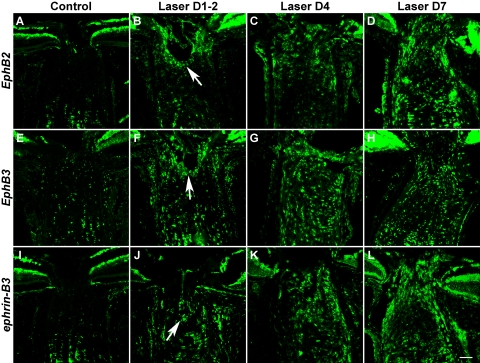
In a previous study in the DBA/2J inbred strain of glaucomatous mice,10 we identified a number of EphB and ephrin-B genes at the ONH whose specific upregulation appeared to be highly correlated with the presence of RGC axon loss. In the present study, we used fluorescent in situ hybridization (FISH) to determine whether EphB and ephrin-B genes were also upregulated after laser-induced experimental ocular hypertension in CD-1 mice. Results showed that EphB2, EphB3, and ephrin-B3 mRNAs were consistently upregulated at the ONH after laser treatment compared with a modest level of baseline expression in controls (Fig. 1). A few other family members, including ephrin-B1 and ephrin-B2, also demonstrated moderate but variable increases in expression (data not shown). The upregulation of EphB2, EphB3, and ephrin-B3 was observed as early as 1 to 2 days after laser treatment (Figs. 1B, 1F, 1J) and was initially most notable in the perivascular region of the pre-lamina ONH (Figs. 1B, 1F, 1J, arrows). At the later time points examined, EphB2, EphB3, and ephrin-B3 cells were found throughout the lamina region of the ONH. Their upregulation peaked around day 4 and persisted for at least 1 week. Although we did not systematically examine the expression profile at later time points, the upregulation was maintained for as long as 3 weeks in some LIOH samples (data not shown).
Figure 1.
Upregulation of Eph and ephrin mRNAs at the laser-treated ONH. FISH demonstrated that the mRNA levels of EphB2, EphB3, and ephrin-B3 were increased above baseline (A, E, I) at 1 to 2 days (B, F, J), 4 days (C, G, K), and 7 days (D, H, L) after treatment. The initial upregulation tended to occur around the ONH perivascular region (B, F, J, arrows). Scale bar, 50 μm. For each Eph and ephrin probe, FISH was repeated three times at each time point. An additional three or more FISH studies were performed with LIOH D4 samples. Subsequent FISH and antibody colabeling experiments to determine cellular identities all used D4 samples unless otherwise stated.
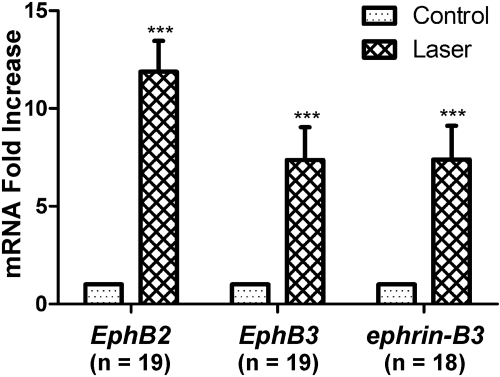
To examine the upregulation of EphB2, EphB3, and ephrin-B3 mRNAs more quantitatively, we performed real-time polymerase chain reaction (RT-PCR) on ONH tissues harvested 4 days after laser treatment and calculated their relative expression level compared with contralateral control samples (Fig. 2). EphB2, EphB3, and ephrin-B3 mRNA exhibited 11.9-fold, 7.4-fold, and 7.4-fold increases in experimental samples over control levels, respectively. Two-way ANOVA found no significant differences among the three mRNAs, suggesting that EphB2, EphB3, and ephrin-B3 were upregulated to comparable extents in the laser-treated ONH. In summary, quantitative RT-PCR findings were consistent with in situ hybridization results in supporting the upregulation of EphB/ephrin-B mRNAs after LIOH in CD-1 mice.
Figure 2.
RT-PCR analysis of EphB2, EphB3, and ephrin-B3 mRNA expression in ONH tissues of laser-treated and control eyes. The mRNA level of experimental samples was normalized to the contralateral untreated eye from the same animal. Nineteen pairs of eyes were used for the analysis of all three genes. One sample was lost in the ephrin-B3 experiment, resulting in a sample size of 18. ***P < 0.001.
ONH Expression of Ephs and ephrins in a Subset of Astrocytes
Eph/ephrin signaling has been shown to produce different outcomes, depending on the cellular context.21,22 Therefore, identification of the cell types that express these molecules is a necessary step in delineating their function. In the optic nerve, axons of RGCs are surrounded by astrocytes and microglia, which normally provide structural and homeostatic support to axons and are known to respond to traumatic injuries to the nerve.23
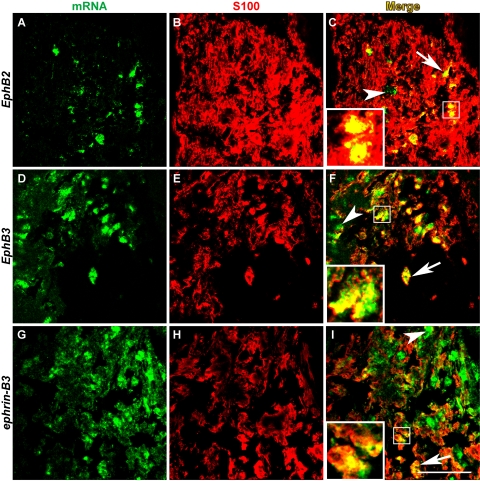
To determine the cellular origin of Eph/ephrin expression at the ONH after laser treatment, we performed immunohistochemistry using cell-specific antibodies after in situ hybridization to detect Eph and ephrin mRNAs. GFAP is a widely accepted intermediate filament marker for astrocytes, also used elsewhere in this study. However, because GFAP stained astrocytic processes most intensely but cell bodies only weakly, it did not colocalize well with the predominantly somatic in situ hybridization signal, even if the two shared a common cellular origin. To circumvent this problem, we resorted to double-labeling with S100, another well-established astrocyte antigen, which stains the soma of astrocytes more robustly than GFAP.24,25 The results showed that a subset of EphB2-, EphB3-, and ephrin-B3-expressing cells at the ONH were also positive for S100 (Figs. 3C, 3F, 3I, insets and arrows). Not all Eph/ephrin+ cells (green) colocalized with S100 (arrowheads), and not all S100+ cells (red) expressed Eph/ephrin mRNA. In summary, EphB2, EphB3, and ephrin-B3 were present in ONH astrocytes after laser treatment, though they did not account for all the cells that express these mRNAs. In turn, EphB2-, EphB3-, and ephrin-B3-expressing astrocytes represented only a subset of the astrocytes present at the ONH after laser treatment.
Figure 3.
Eph/ephrin mRNAs were expressed in a subset of ONH astrocytes. In situ hybridization of EphB2, EphB3, and ephrin-B3 mRNAs (A, D, G) was followed with immunohistochemistry using S100 (B, E, H) as a marker for astrocytes. In merged images (C, F, I), the colocalization of in situ hybridization signal with S100 was indicated by yellow pixels (arrows and insets). Some cells expressing Eph/ephrin mRNAs were not immunoreactive for S100 (arrowheads). Scale bar, 50 μm. n = 4 LIOH animals.
ONH Expression of Ephs and ephrins in Microglia
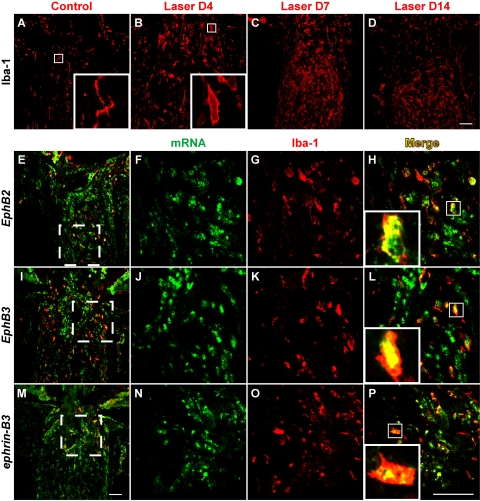
In a previous study, we found that ephrin-B2 expression in DBA/2J glaucomatous mice was colocalized with ONH microglia. We thus sought to address whether microglia activation also occurred at the ONH after IOP elevation induced by laser treatment and whether these cells contributed to the upregulation of Eph/ephrin. Our results demonstrated that the number of ONH cell labeled with the microglial marker Iba-126 increased dramatically after laser photocoagulation (Figs. 4A–D). These cells did not appear to bear ramified processes as in controls (Fig. 4A, inset) but were instead amoeboid in shape (Fig. 4B, inset), suggesting that they have undergone activation. We also corroborated these findings with two other commonly used microglial markers, CD11b and isolectin GSA-IB4 (data not shown). Double-labeling with EphB or ephrin-B in situ hybridization and Iba-1 immunohistochemistry (Figs. 4E–P) revealed that a subset of cells that expressed EphB2, EphB3, and ephrin-B3 mRNAs were of the microglial lineage (Figs. 4H, 4L, 4P). Conversely, most of the Iba-1+ microglial cells present at the ONH after laser treatment appeared to express EphB2, EphB3, and/or ephrin-B3.
Figure 4.
Microglia accumulation at the ONH after LIOH and expression of Eph/ephrin mRNAs. In the control optic nerve, microglia labeled with the Iba-1 antibody were present sparsely and appeared ramified (A, inset). After LIOH, an accumulation of microglia was observed (B–D), and these cells became more amoeboid in morphology (B, H, L, P, insets). Double-labeling of in situ hybridization (F, J, N) and Iba-1 immunostaining (G, K, O) demonstrated that most Iba-1+ microglia expressed EphB2 (E, H), EphB3 (I, L), or ephrin-B3 (M, P) mRNAs. (E, I, M) Low-magnification overviews in which higher magnification images were taken from the boxed regions. Scale bar (D, M, P), 50 μm. n = 4 LIOH animals.
ONH Expression of Ephs and ephrins in Ectopic NG2+ Cells
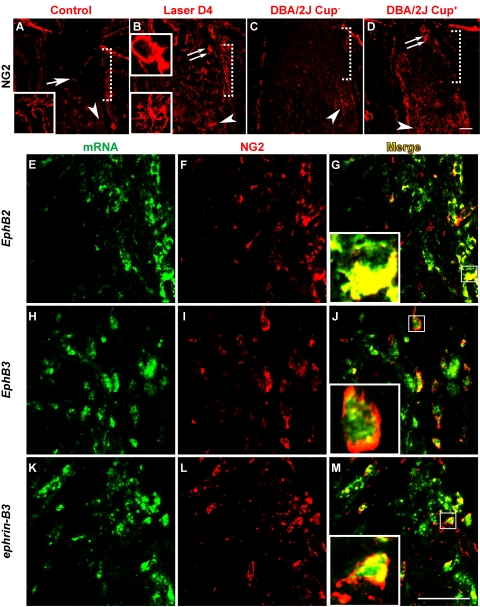
A well-recognized feature of the ONH is its lack of myelination and the specific exclusion of oligodendrocytes and NG2+ putative oligodendrocyte precursor cells.23 In the course of studies examining the cellular origin of EphB and ephrin-B mRNA expression, we found that this cellular exclusion was compromised in laser-treated CD-1 mice, which manifested as the presence of ectopic NG2+ cells in the ONH region. The proteoglycan NG2 is normally expressed by a population of stellate-shaped cells (Figs. 5A–D, arrowheads) in the myelinated portion of the optic nerve but are not found in the unmyelinated ONH region except for occasional staining of the vasculature (Fig. 5A, arrow). In LIOH, cells expressing NG2 were ectopically located within the ONH (Fig. 5B, double arrow) beginning around 4 days after laser treatment. This phenomenon was also observed in DBA/2J mice exhibiting signs of optic disc cupping (Fig. 5D, double arrow) but not in age-matched histologically normal controls (Fig. 5C), consistent with a link between the appearance of NG2+ cells and glaucomatous damage. NG2+ cells found at the ONH tended to be more amoeboid shaped (Fig. 5B, top inset; Figs. 5G, 5J, 5M, insets), unlike the NG2+ cells with ramified processes observed in the myelinated regions of the optic nerve (Figs. 5A, 5B, bottom insets). In situ hybridization and anti-NG2 double-labeling studies (Fig. 5E–M) showed that ectopic NG2 cells contributed in part to the expression of EphB2, EphB3, and ephrin-B3 mRNAs at the ONH (Figs. 5G, 5J, 5M).
Figure 5.
Ectopic NG2+ cells at the ONH expressed Eph/ephrin mRNAs. The NG2 marker labeled cells in the myelinated portion of optic nerve in all samples (A–D, arrowheads). In control CD-1 (A) and nonglaucomatous DBA/2J eyes without ONH cupping (C, DBA/2J Cup−), no substantial NG2 immunoreactivity was detected at the unmyelinated ONH (demarcated by the dotted square bracket), except for minor vascular staining (A, arrow). In laser-treated CD-1 (B) and DBA/2J exhibiting signs of glaucomatous ONH cupping (D, DBA/2J Cup+), cells expressing NG2 were ectopically located within the ONH (double arrow). NG2+ cells normally found in the myelinated optic nerve were stellate in morphology bearing ramified processes (A and B, bottom insets), whereas those ectopically present at the ONH tended to be more amoeboid in shape (B, top inset; G, J, M, inset). In situ hybridization of EphB2, EphB3, and ephrin-B3 mRNAs (E, H, K) was combined with anti-NG2 immunolabeling (F, I, L). Merged images (G, J, M) showed that ectopic NG2 signal at the ONH overlapped with a portion of EphB2-, EphB3-, and ephrin-B3-expressing cells. Scale bar (D, M), 50 μm. n = 4 LIOH animals.
We focused our colocalization studies 4 days after LIOH because early onset was an important characteristic of Eph/ephrin upregulation, consistent with potential roles in disease development. Similar patterns were also observed at later time points. We further examined additional cell-specific immunohistochemical markers, including PECAM-1 for endothelial cells,27 CD4 for T cells,28 and CD69 for activated lymphocytes.29 No CD4 or CD69 immunoreactivity was detected in laser-treated samples, indicating that T-cell infiltration was not a feature of the ONH glaucomatous changes induced by laser treatment. PECAM-1 exhibited the typical staining of microvasculature, which was similar between treatment and control and did not overlap with the pattern of Eph/ephrin mRNA expression (data not shown).
Together, these results indicate that there is broad-based cellular expression of EphB2, EphB3, and ephrin-B3 in multiple cell types, including astrocytes, microglia, and NG2+ cells at the ONH after experimental glaucoma induced by laser photocoagulation in CD-1 mice. This gene upregulation compared with untreated control is in part due to an increase in the number of Iba-1+ microglia and ectopically located NG2+ cells, possibly reflecting a disruption of the local cytoarchitecture. Although most Iba-1+ microglia and NG2+ cells express EphB2, EphB3, and ephrin-B3, only a subset of astrocytes upregulated these mRNAs after laser-induced ocular hypertension.
Upregulation of ephrin-B Reverse Signaling after Laser Treatment
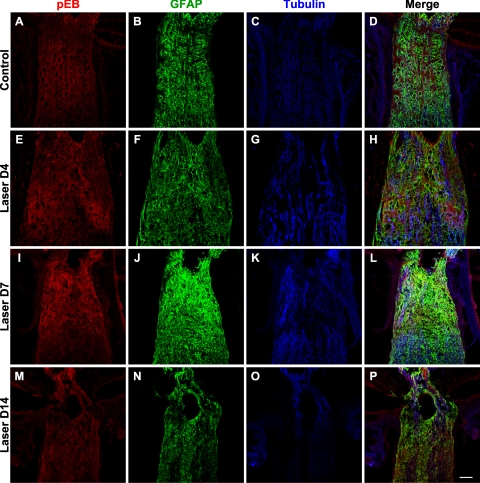
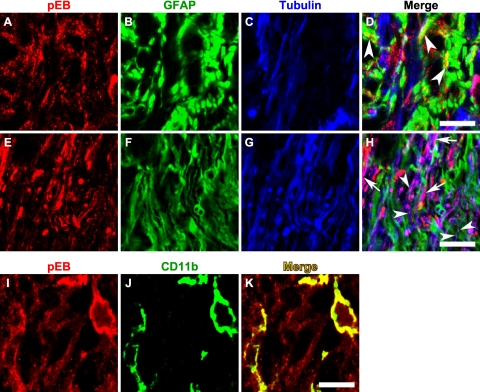
The Eph and ephrin system can engage in bidirectional signaling, sending information in the forward direction into Eph receptor expressing cells or in the reverse direction into ephrin ligand-expressing cells.13 In both cases, binding of Eph molecules with ephrins on an opposing cell leads to the clustering and subsequent tyrosine phosphorylation of Ephs and ephrins. Therefore, detection of phosphotyrosine residues on Eph/ephrin proteins serves as an indication of receptor activation and signaling. To determine whether the upregulation of Eph and ephrin mRNA observed in laser-treated eyes resulted in increased Eph and ephrin signaling, we examined ephrin-B activation using an antibody that specifically recognizes ephrin-B1, B2, and B3 proteins that are phosphorylated at tyrosine 324/329 but that does not bind to the nonphosphorylated forms of these proteins. Phospho-ephrin-B (pEB) was constitutively expressed at low levels at the control ONH (Fig. 6A). The pEB immunoreactivity was substantially enhanced between 4 and 7 days (Fig. 6E, I) after laser treatment and subsided after 2 weeks (Fig. 6M). Of note, pEB immunoreactivity was localized to discrete patches within the ONH. The relationship between pEB immunoreactivity and astrocytes (visualized using GFAP) as well as axons (visualized using tubulin) is presented at low magnification in Figure 6. High-magnification images taken from the lamina ONH (Fig. 7) revealed that the cellular identity of patches containing increased pEB immunoreactivity was heterogeneous. In some areas, pEB was colocalized mainly within RGC axons (Figs. 7E–H, arrowheads and arrows) or within microglia (Figs. 7I–K). In others, pEB colocalized substantially with astrocytes (Figs. 7A–D, arrowheads). On inspection at higher magnification, immunostaining of pEB appeared as puncta measuring 0.1 to 1 μm (Figs. 7D, 7H, arrowheads), consistent with the known clustering of Eph/ephrin receptor after activation.30 In addition, there were also larger pEB immunoreactive units that spanned the entire axon width and stretched over several microns in length (Fig. 7H, arrows), possibly reflecting the aggregation of EphB/ephrin-B signaling complexes into higher order clusters.12 The expression of ephrin-B protein by normal adult RGC axons has been previously demonstrated with in vivo EphB-Fc binding assays.10 Taken together, these results demonstrated that the upregulation of Eph and ephrin-B mRNA expression that occurred as early as 1 to 2 days after laser treatment led to increased Eph-ephrin signaling, and this signaling appeared to involve multiple cellular elements, including astrocytes, microglia, and RGC axons.
Figure 6.
Upregulation of phosphorylated ephrin-B (pEB) protein. A constitutive baseline expression of pEB was observed at the ONH of control samples (A). The intensity of immunoreactive signal was substantially increased at 4 days (E) and 7 days (I) after laser treatment and declined by 2 weeks (M). Colabeling of astrocytes with GFAP (B, F, J, N), axons with tubulin (C, G, K, O), and merged images (D, H, L, P) were presented at low magnification to provide a survey view of the spatial relationship between these markers. Scale bar, 50 μm. n = 3 sets of experiments.
Figure 7.
Expression of phospho-ephrin-B in astrocytes, axons, and microglia at the lamina ONH. Phospho-ephrin-B (A, E, I) was colabeled with GFAP for astrocytes (B, F), tubulin for axons (C, G), or CD11b for microglia (J). The expression of pEB was found to colocalize predominantly with astrocytes in some patches (D, arrowheads) and axons in others (H, arrowheads for small puncta and arrows for large puncta possibly reflecting high-order clusters). Microglia also expressed pEB (K). Scale bar, 10 μm.
Differentiation of Axons with Radial versus Aberrant Trajectories by ephrin-B Reverse Signaling
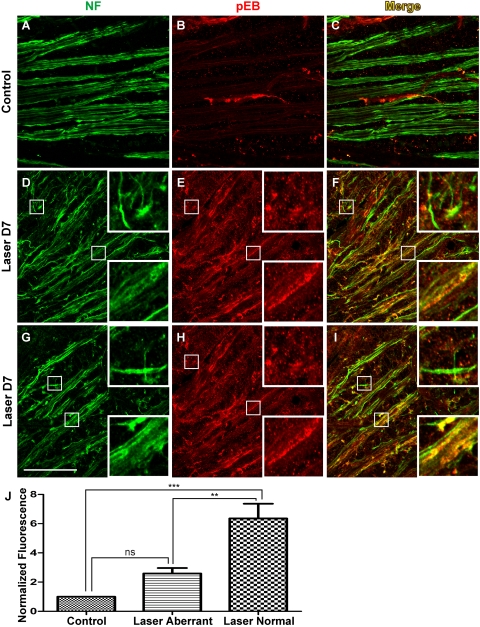
To better understand the potential basis of the heterogeneity of pEB signaling, particularly in RGC axons, we examined the relationship between pEB expression and axonal morphology. A feature of axon responses to IOP elevation in the pre-lamina ONH in CD-1 mice is the display of axonal reactive plasticity characterized by defasciculation, axonal enlargement, and aberrant meandering axon trajectories.18 However, at the population level, axons are heterogeneous because some exhibit morphologic characteristics of reactive plasticity, but others have yet to be affected and maintain their normal appearance. For example, at 7 days after laser treatment, a number of axons exhibited defasciculation and aberrant meandering trajectories (Figs. 8D, 8G, top insets), in contrast to the tightly bundled axons in control retinal whole-mounts (Fig. 8A). Concurrently, other axons did not display overt signs of damage and retained their radially directed course to the ONH (Figs. 8D, 8G, bottom insets). Immunohistochemical detection demonstrated marked enhancement of pEB expression in retinal whole-mounts harvested 7 days after laser treatment (Figs. 8E, 8H) compared with the control group (Fig. 8B), consistent with findings at the lamina ONH (Fig. 6). Of note however, the overall increase of pEB expression was observed mainly in axons that appeared morphologically normal, tightly bundled, and radially oriented (Figs. 8D–F, 8G–I, bottom insets). In contrast, most RGC axons with aberrant meandering or undulating trajectories that deviated from the normal radial course had no significant pEB expression above background (Figs. 8D–F, 8G–I, top insets). This apparent lack of pEB immunoreactivity may reflect a reduction in either total protein expression or ephrin-B reverse signaling. The level of pEB fluorescence was quantified in six pairs of retinas (Fig. 8J). In LIOH samples, the intensity of pEB on normal axon bundles was higher than in both the contralateral control and aberrant axon segments. In contrast, pEB expression by aberrant axons was not significantly different from axons in control retinas. In summary, after LIOH induction, ephrin-B reverse signaling appeared to be transiently increased in the population of RGC axons that have yet to exhibit overt morphologic signs of altered physiology, such as defasciculation and meandering or undulating trajectories.
Figure 8.
Heterogeneity of phospho-ephrin-B expression in the retinas of LIOH CD-1 mice. Retinal whole-mounts were processed for immunolabeling of pEB (B, E, H) and NF (A, D, G) to identify axons. Shown here are examples from one control retina (A–C) and two D7 LIOH retinas (D–F and G–I) processed in parallel. Significant upregulation of pEB was observed after laser treatment (E, H) compared with controls (B). In LIOH samples, axons that remained in tight radial bundles expressed high levels of pEB (D–F and G–I, bottom insets), whereas pEB was markedly lower in axons with aberrant trajectories (D–F and G–I, top insets). Scale bar, 50 μm. (J) Quantification of pEB expression. pEB fluorescence intensity on morphologically normal and aberrant axons in laser-treated retinas was determined and normalized to that of the contralateral control eye. Morphologically normal LIOH axons expressed pEB at higher levels than axons in untreated control retinas (normalized fluorescence value was significantly 1). Morphologically aberrant axons in the same samples did not significantly differ from control. **P < 0.01; ***P < 0.001. n = 6 LIOH animals.
Discussion
Shared Eph and ephrin Upregulation in Human Glaucoma and Animal Models
The present data in CD-1 LIOH agree with previous findings of EphB/ephrin-B upregulation in DBA/2J10 and in primate and human glaucomatous tissues,31 indicating that it may be a basic characteristic of disease. Intriguingly, distinct sets of Eph/ephrin molecules are expressed in CD-1 LIOH compared with previous reports, and the distribution of Eph/ephrin-expressing cells is relatively more dispersed compared with the focal pattern observed in DBA/2J. These distinctions might be attributed to differences in species, strain background, or stage of disease, or they could be a consequence of the different forms of glaucoma mimicked by the various models. The chronic progressive nature of DBA/2J glaucoma versus the more compressed time course of CD-1 LIOH could also underlie differences in the expression of particular family members. Nevertheless, the upregulation of Ephs and ephrins at the ONH in human glaucoma and three animal models of disease is consistent with a potential role of these molecules in modulating the development and progression of glaucoma.
Early Response of Eph/ephrin System after IOP Elevation
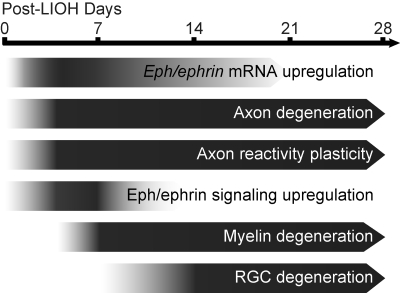
We have previously demonstrated that pathologic changes in RGC axons at the ONH occurred by day 4 after IOP elevation in CD-1 mice.18 Here we report that the upregulation of EphB2, EphB3, and ephrin-B3 mRNA was observed 1 to 2 days after LIOH; thus, its occurrence was coincident with, or possibly preceded, overt signs of axon damage, suggesting potential involvement early in axon response to IOP elevation. The increase of EphB/ephrin-B mRNA expression was reflected in a transient increase of phosphorylation-dependent ephrin-B reverse signaling between 4 and 7 days, involving astrocytes, microglia, and RGC axons. Drawing on data from this study and our previous characterization of the LIOH model,18 a summary figure (Fig. 9) illustrates where EphB/ephrin-B upregulation and signaling may fit into the approximate sequence of pathologic events after LIOH.
Figure 9.
Approximate timeline of pathologic events after LIOH. Eph/ephrin mRNA upregulation occurred around 1 to 2 days after laser treatment, coinciding with or preceding the earliest manifestation of axonal injury. By day 4, evidence of axon damage, degeneration, and reactive plasticity at the ONH were apparent. Phosphorylation-dependent ephrin-B signaling was transiently upregulated around this time and declined to baseline during the second week. Signs of myelin degradation were first detected after 1 week, and significant reduction of Brn-3b+ RGC density occurred after 2 weeks.
Broad-Based Axonal/Glial Network of Eph/ephrin Signaling
A notable finding in the present study is the expression of EphB2, EphB3, and ephrin-B3 in multiple ONH cell types, including microglia, astrocytes, and ectopic NG2+ cells. This shared upregulation suggests a common mechanism governing the response of multiple glial cell types to elevation in IOP and perhaps to other local ONH changes.
The upregulation of EphB/ephrin-B genes resulted in increased phosphorylated ephrin-B proteins in RGC axons, microglia, and astrocytes, indicating the enhancement of active ephrin-B–mediated reverse signaling. Although we did not directly examine EphB proteins because of the lack of specific antibodies, their presence is evidenced by the activation of ephrin-B. Adult RGC axons express both EphB and ephrin-B,10 rendering them competent to respond to the complementary receptor/ligand on neighboring cells.
Astrocytes32 and microglia33 have long been implicated in CNS injuries and neurodegenerative diseases. A number of studies reported the increased proliferation or altered gene expression profile of microglia in glaucoma,34–38 and inhibition of microglia activation could be neuroprotective in DBA/2J.39 However, most of these studies focused on the characterization of glaucomatous retina, whereas microglial response at the ONH has not been investigated before the present work. NG2+ cells have been shown to contribute to inhibitory scar formation after spinal cord lesion40,41 and have been shown to have stem cell potential in the adult CNS.42,43 Although one study examining NG2+ pericytes did not detect significant alteration in the glaucoma-susceptible DBA/2J retina,38 our observation of ectopic NG2+ cells warrants exploration of their involvement at the glaucomatous ONH. The mouse ONH is unmyelinated, and its axons are intimately associated with a dense meshwork of astrocytes.44 In this unique environment, glial cells have the potential to engage in reciprocal contact-dependent signaling and to exert direct effects on axons. Therefore, the activation of ephrin-B reverse signaling in multiple ONH cell types may reflect communication along the glia-glia, glia-axon, or axon-axon axes.
Transient ephrin-B Reverse Signaling in RGC Axons
The transient increase of axonal ephrin-B reverse signaling in CD-1 LIOH is of note for several reasons. First, the activation of ephrin-B reverse signaling is present in axons within both the lamina and the pre-lamina regions of the ONH, corresponding to the sites of the earliest detectable morphologic change both in the LIOH model and in DBA/2J glaucomatous mice.18,44 Second, ephrin-B reverse signaling is active during the first week after IOP elevation, coinciding with the initial appearance of apparent morphologic signs of axon damage and axon reactive plasticity. Third, ephrin-B reverse signaling appears to be active preferentially in RGC axons that are early in their response to glaucomatous injury rather than in axons that appear to be further along in the pathologic cascade, as evidenced by their morphologic reactive plasticity. To our knowledge, this is the first report to link the activated form of a signaling molecule with specific RGC axon response states in glaucomatous disease. It would be of interest to explore how the loss of reverse ephrin-B signaling affects the ultimate survival of RGC axons and their cell bodies after IOP elevation. Although Eph/ephrin signaling has been demonstrated to modulate the reactive state of glia,16 how it may also affect axonal integrity presents a challenging yet important question. It is unclear whether the aberrant axons with apparently low pEB expression were prevented from ephrin-B reverse signaling or whether they had previously undergone transient ephrin-B signaling and subsequently downregulated pEB expression. Moreover, whether ephrin-B signaling plays a protective role in promoting axon survival or contributes to axon injury and degeneration in glaucoma awaits further elucidation. Alternatively, ephrin-B signaling may not directly impact axon survival but may merely represent an epiphenomenon of an early axon response program triggered by glaucomatous insult. Even in this scenario, the early onset of ephrin-B reverse signaling and its ability to differentiate between morphologically distinct axon populations make pEB an attractive marker of axon injury states.
Acknowledgments
The authors thank Jacque Duncan for use of the laser equipment and Ronald Hurd for technical advice on TonoLab (Colonial Medical Supply).
Footnotes
Supported by National Eye Institute Grants EY016691 and EY02162, Research to Prevent Blindness, and That Man May See Foundation. DS is the recipient of a Research to Prevent Blindness Senior Scientific Investigator Award.
Disclosure: C.T. Fu, None; T. Tran, None; D. Sretavan, None
References
- 1.Anderson DR, Hendrickson A. Effect of intraocular pressure on rapid axoplasmic transport in monkey optic nerve. Invest Ophthalmol 1974; 13: 771–783 [PubMed] [Google Scholar]
- 2.Quigley HA, Addicks EM, Green WR, Maumenee AE. Optic nerve damage in human glaucoma, II: the site of injury and susceptibility to damage. Arch Ophthalmol 1981; 99: 635–649 [DOI] [PubMed] [Google Scholar]
- 3.Quigley HA, Addicks EM. Chronic experimental glaucoma in primates, II: effect of extended intraocular pressure elevation on optic nerve head and axonal transport. Invest Ophthalmol Vis Sci 1980; 19: 137–152 [PubMed] [Google Scholar]
- 4.Quigley HA, Addicks EM. Regional differences in the structure of the lamina cribrosa and their relation to glaucomatous optic nerve damage. Arch Ophthalmol 1981; 99: 137–143 [DOI] [PubMed] [Google Scholar]
- 5.Fechtner RD, Weinreb RN. Mechanisms of optic nerve damage in primary open angle glaucoma. Surv Ophthalmol 1994; 39: 23–42 [DOI] [PubMed] [Google Scholar]
- 6.Grieshaber MC, Flammer J. Blood flow in glaucoma. Curr Opin Ophthalmol 2005; 16: 79–83 [DOI] [PubMed] [Google Scholar]
- 7.Libby RT, Anderson MG, Pang IH, et al. Inherited glaucoma in DBA/2J mice: pertinent disease features for studying the neurodegeneration. Vis Neurosci 2005; 22: 637–648 [DOI] [PubMed] [Google Scholar]
- 8.Hernandez MR. The optic nerve head in glaucoma: role of astrocytes in tissue remodeling. Prog Retin Eye Res 2000; 19: 297–321 [DOI] [PubMed] [Google Scholar]
- 9.Tezel G, Wax MB. Glial modulation of retinal ganglion cell death in glaucoma. J Glaucoma 2003; 12: 63–68 [DOI] [PubMed] [Google Scholar]
- 10.Du J, Tran T, Fu C, Sretavan DW. Upregulation of EphB2 and ephrin-B2 at the optic nerve head of DBA/2J glaucomatous mice coincides with axon loss. Invest Ophthalmol Vis Sci 2007; 48: 5567–5581 [DOI] [PubMed] [Google Scholar]
- 11.Klein R. Eph/ephrin signaling in morphogenesis, neural development and plasticity. Curr Opin Cell Biol 2004; 16: 580–589 [DOI] [PubMed] [Google Scholar]
- 12.Pasquale EB. Eph receptor signalling casts a wide net on cell behaviour. Nat Rev Mol Cell Biol 2005; 6: 462–475 [DOI] [PubMed] [Google Scholar]
- 13.Pasquale EB. Eph-ephrin bidirectional signaling in physiology and disease. Cell 2008; 133: 38–52 [DOI] [PubMed] [Google Scholar]
- 14.Du J, Fu C, Sretavan DW. Eph/ephrin signaling as a potential therapeutic target after central nervous system injury. Curr Pharm Des 2007; 13: 2507–2518 [DOI] [PubMed] [Google Scholar]
- 15.Goldshmit Y, McLenachan S, Turnley A. Roles of Eph receptors and ephrins in the normal and damaged adult CNS. Brain Res Brain Res Rev 2006; 52– 327–345 [DOI] [PubMed] [Google Scholar]
- 16.Goldshmit Y, Galea MP, Wise G, Bartlett PF, Turnley AM. Axonal regeneration and lack of astrocytic gliosis in EphA4-deficient mice. J Neurosci 2004; 24: 10064–10073 [DOI] [PMC free article] [PubMed] [Google Scholar]
- 17.Liu X, Hawkes E, Ishimaru T, Tran T, Sretavan DW. EphB3: an endogenous mediator of adult axonal plasticity and regrowth after CNS injury. J Neurosci 2006; 26: 3087–3101 [DOI] [PMC free article] [PubMed] [Google Scholar]
- 18.Fu CT, Sretavan D. Laser-induced ocular hypertension in albino CD-1 mice. Invest Ophthalmol Vis Sci In press [DOI] [PMC free article] [PubMed] [Google Scholar]
- 19.Birgbauer E, Cowan CA, Sretavan DW, Henkemeyer M. Kinase independent function of EphB receptors in retinal axon pathfinding to the optic disc from dorsal but not ventral retina. Development 2000; 127: 1231–1241 [DOI] [PubMed] [Google Scholar]
- 20.Pfaffl MW. A new mathematical model for relative quantification in real-time RT-PCR. Nucleic Acids Res 2001; 29: e45. [DOI] [PMC free article] [PubMed] [Google Scholar]
- 21.Poliakov A, Cotrina M, Wilkinson DG. Diverse roles of eph receptors and ephrins in the regulation of cell migration and tissue assembly. Dev Cell 2004; 7: 465–480 [DOI] [PubMed] [Google Scholar]
- 22.Halloran MC, Wolman MA. Repulsion or adhesion: receptors make the call. Curr Opin Cell Biol 2006; 18: 533–540 [DOI] [PubMed] [Google Scholar]
- 23.Butt AM, Pugh M, Hubbard P, James G. Functions of optic nerve glia: axoglial signalling in physiology and pathology. Eye 2004; 18: 1110–1121 [DOI] [PubMed] [Google Scholar]
- 24.Himeda T, Watanabe Y, Tounai H, Hayakawa N, Kato H, Araki T. Time dependent alterations of co-localization of S100beta and GFAP in the MPTP-treated mice. J Neural Transm 2006; 113: 1887–1894 [DOI] [PubMed] [Google Scholar]
- 25.Ogata K, Kosaka T. Structural and quantitative analysis of astrocytes in the mouse hippocampus. Neuroscience 2002; 113: 221–233 [DOI] [PubMed] [Google Scholar]
- 26.Ito D, Imai Y, Ohsawa K, Nakajima K, Fukuuchi Y, Kohsaka S. Microglia-specific localisation of a novel calcium binding protein, Iba1. Brain Res Mol Brain Res 1998; 57: 1–9 [DOI] [PubMed] [Google Scholar]
- 27.Albelda SM, Muller WA, Buck CA, Newman PJ. Molecular and cellular properties of PECAM-1 (endoCAM/CD31): a novel vascular cell-cell adhesion molecule. J Cell Biol 1991; 114: 1059–1068 [DOI] [PMC free article] [PubMed] [Google Scholar]
- 28.Sattentau QJ, Weiss RA. The CD4 antigen: physiological ligand and HIV receptor. Cell 1988; 52: 631–633 [DOI] [PubMed] [Google Scholar]
- 29.Cosulich ME, Rubartelli A, Risso A, Cozzolino F, Bargellesi A. Functional characterization of an antigen involved in an early step of T-cell activation. Proc Natl Acad Sci U S A 1987; 84: 4205–4209 [DOI] [PMC free article] [PubMed] [Google Scholar]
- 30.Moeller ML, Shi Y, Reichardt LF, Ethell IM. EphB receptors regulate dendritic spine morphogenesis through the recruitment/phosphorylation of focal adhesion kinase and RhoA activation. J Biol Chem 2006; 281: 1587–1598 [DOI] [PubMed] [Google Scholar]
- 31.Schmidt J, Agapova OA, Yang P, Kaufman PL, Hernandez MR. Expression of EphrinB1 and its receptor in glaucomatous optic neuropathy. Br J Ophthalmol 2007; 91: 1219–1294 [DOI] [PMC free article] [PubMed] [Google Scholar]
- 32.Maragakis NJ, Rothstein JD. Mechanisms of disease: astrocytes in neurodegenerative disease. Nat Clin Pract Neurol 2006; 2: 679–689 [DOI] [PubMed] [Google Scholar]
- 33.Hanisch UK, Kettenmann H. Microglia: active sensor and versatile effector cells in the normal and pathologic brain. Nat Neurosci 2007; 10: 1387–1394 [DOI] [PubMed] [Google Scholar]
- 34.Yuan L, Neufeld AH. Activated microglia in the human glaucomatous optic nerve head. J Neurosci Res 2001; 64: 523–532 [DOI] [PubMed] [Google Scholar]
- 35.Sappington RM, Calkins DJ. Contribution of TRPV1 to microglia-derived IL-6 and NFκB translocation with elevated hydrostatic pressure. Invest Ophthalmol Vis Sci 2008; 49: 3004–3017 [DOI] [PMC free article] [PubMed] [Google Scholar]
- 36.Nakazawa T, Nakazawa C, Matsubara A, et al. Tumor necrosis factor-alpha mediates oligodendrocyte death and delayed retinal ganglion cell loss in a mouse model of glaucoma. J Neurosci 2006; 26: 12633–12641 [DOI] [PMC free article] [PubMed] [Google Scholar]
- 37.Ju KR, Kim HS, Kim JH, Lee NY, Park CK. Retinal glial cell responses and Fas/FasL activation in rats with chronic ocular hypertension. Brain Res 2006; 1122: 209–221 [DOI] [PubMed] [Google Scholar]
- 38.Inman DM, Horner PJ. Reactive nonproliferative gliosis predominates in a chronic mouse model of glaucoma. Glia 2007; 55: 942–953 [DOI] [PubMed] [Google Scholar]
- 39.Bosco A, Inman DM, Steele MR, et al. Reduced retina microglial activation and improved optic nerve integrity with minocycline treatment in the DBA/2J mouse model of glaucoma. Invest Ophthalmol Vis Sci 2008; 49: 1437–1446 [DOI] [PubMed] [Google Scholar]
- 40.Tan AM, Colletti M, Rorai AT, Skene JH, Levine JM. Antibodies against the NG2 proteoglycan promote the regeneration of sensory axons within the dorsal columns of the spinal cord. J Neurosci 2006; 26: 4729–4739 [DOI] [PMC free article] [PubMed] [Google Scholar]
- 41.Nishiyama A. Polydendrocytes: NG2 cells with many roles in development and repair of the CNS. Neuroscientist 2007; 13: 62–76 [DOI] [PubMed] [Google Scholar]
- 42.Horky LL, Galimi F, Gage FH, Horner PJ. Fate of endogenous stem/progenitor cells following spinal cord injury. J Comp Neurol 2006; 498: 525–538 [DOI] [PMC free article] [PubMed] [Google Scholar]
- 43.Yokoyama A, Sakamoto A, Kameda K, Imai Y, Tanaka J. NG2 proteoglycan-expressing microglia as multipotent neural progenitors in normal and pathologic brains. Glia 2006; 53: 754–768 [DOI] [PubMed] [Google Scholar]
- 44.Howell GR, Libby RT, Jakobs TC, et al. Axons of retinal ganglion cells are insulted in the optic nerve early in DBA/2J glaucoma. J Cell Biol 2007; 179: 1523–1537 [DOI] [PMC free article] [PubMed] [Google Scholar]


