Abstract
Measurements of protein abundance and quantitative assessment of multiple post-translational modifications (PTMs) within a single protein are increasingly called for to understand the control of protein activity, particularly in metazoan cells. General methods of wide applicability and precision/accuracy for quantitative estimation of protein post-translational regulation are lacking. Protein mass spectrometry has evolved from a high throughput qualitative technique to a potentially general quantitative tool but there are still serious limitations in dynamic range and coverage. To address some of these limitations we introduce a novel MS-based quantitative strategy, FLEXIQuant, (Full-Length Expressed Stable Isotope-labeled Proteins for Quantification), which can track changes in relative peptide abundances as a function of PTM, and determine absolute quantity of a protein from its lysate. We examined two subunits of the anaphase-promoting complex, CDC27 and APC5, as a test of our ability to monitor quantitatively, the PTM status of several peptides over time. We find evidence of differential regulation at different sites, a phenomenon we believe will be very widespread. FLEXIQuant proved itself to be capable of serving as a general quantitative tool.
Keywords: mass spectrometry, post-translational modification, full-length protein standard, stable isotope
Introduction
Protein function is often regulated by post-translational modifications (PTMs) which can result in several different protein isoforms. Mounting evidence suggests that combinations of such modifications are responsible for regulating and fine-tuning protein activity1, 2. To effectively understand the functional significance of protein modification, ideally one should be able to monitor quantitatively all modifications of a protein. Traditionally, quantification of isoforms used immunochemistry, which required previous knowledge of epitopes for antibody production. This inevitably resulted in significant time and cost to complete; furthermore identifying specific modifications can be very difficult and antibodies can be hard to generate. Thus a major challenge is to develop quantification strategies for protein isoforms that can be generally applied to a variety of modifications.
An exciting set of developments in mass spectrometry (MS) has been its extension as a qualitative tool for protein identification and PTM discovery to quantitative analyses. In quantitative MS, stable isotope-labeled (heavy) proteins/peptides serve as standards for relative quantification of the biological (light) proteins/peptides. Differential metabolic labeling3 and chemical derivatization4 of proteins/peptides using stable isotope-labeled growth media/amino acids or tags were developed as modifications of this basic design5–8. The incorporation of stable isotopes, such as 15N and 13C, into a protein does not change the physicochemical properties except for its mass. The relative differences in peptide/protein abundance in experimental samples can be determined by measuring and comparing the relative intensities of the light and heavy signals of a peptide in a mass spectrum 9–11.
For absolute quantification of protein synthetically derived stable isotope-labeled peptides, commonly referred to as isotope dilution or AQUA (absolute quantification) standards, are mixed with samples and their relative signal, as measured by the ion current, is used to measure the abundance of a given protein12–15. Due to the cost, the empirical nature of peptide design and the time involved to generate AQUA peptides, this approach is feasible for monitoring only a small number of peptides per protein. However, there is a serious question as to when one adds the standard. Adding the standard to an unfractionated mixture of proteins is ideal but the complexity of the sample may preclude it. The later the standard is added the more chance there is for losses of the protein of interest and inevitable errors in the quantification. This method, like antibody preparation assumes that for PTMs one has already qualitatively identified the peptide isoform. Therefore, a labeled standard should ideally represent the full-length protein as this would permit a complete survey and unbiased analysis of, for example, all detectable tryptic peptides.
The concept of full-length stable isotope-labeled protein standards was recently realized and preliminary studies showed significant improvements over the capabilities of the AQUA standard, including extended sequence coverage and reduction in costs16–18. The labeled protein is generally expressed recombinantly in bacterial culture; it is then extensively purified, quantified and added in defined amounts to the cell lysate harboring the biological variant16–18. Applications for the full-length standards include quantification of isoenzymes17 and signaling proteins18, and analysis of biomarkers16. These studies have extended the use of isotope dilution methods. However, these novel methods described are handicapped by several problems that prevent their widespread use, including lack of sensitivity towards low abundance proteins and their corresponding PTMs, and laborious generation and quantification of full-length internal standards.
In view of these needs, we expanded and improved upon previous bacterial strategies and developed a robust discovery tool - Full-Length Expressed Stable Isotope-labeled Proteins for Quantification (FLEXIQuant). With FLEXIQuant, eukaryotic protein standards are synthesized in a wheat germ extract (WGE) optimized for the rapid production of soluble standards19. The protein standard is tagged with a novel peptide (FLEX-peptide) allowing for absolute quantification of nanogram amounts of protein standards with no need for purification. Furthermore, FLEXIQuant is compatible with immunoprecipitative strategies permitting analysis of low abundant proteins, protein subpopulations, and protein complexes. To demonstrate the features of FLEXIQuant, we followed the quantitative changes in PTMs on human CDC27 and APC5, subunits of the anaphase-promoting complex (APC), in HeLa S3 cells in the presence of a microtubule poison that arrests cells in mitosis. We show that CDC27 undergoes differential rates of PTM with respect to APC5 in the prometaphase stage of mitosis, providing further evidence of dynamic regulation of PTMs11. We believe FLEXIQuant should enable the rapid and inexpensive identification and quantification of PTMs.
Materials and Methods
Chemicals and Reagents
All chemicals were purchased from Sigma-Aldrich unless specified otherwise. The FLEXIQuant peptide (FLEX-peptideL) TENLYFQGDISR was synthesized by Sigma Life Science and quantified by amino acid analysis (Molecular Biology Core Facilities, Dana-Farber Cancer Institute, Boston, MA).
Cloning and in vitro expression of full-length stable isotope-labeled proteins
The in vitro expression vectors pEU-E01-His-N1-FLEX and pEU-E01-His-C1-FLEX from Cell Free Sciences were modified via site-directed mutagenesis (QuikChange, Stratagene) to generate the FLEX-peptide (see Supplementary Table 1). Full-length CDC27 (gi:39645252) and APC5 (gi:33871658)20, were subcloned into pEU-E01-TEV-N1-AQUA (see Supplementary Table 1) and verified by DNA sequencing. The uncoupled in vitro transcription and translation experiments were carried out according to the manufacturer’s protocols (Cell Free Sciences, Wheat Germ Expression H Kit-NA). Briefly, 1.0 μg/μL of recombinant plasmid was added to the transcription reaction (10 uL total volume). The in vitro translation reaction was carried out in the presence of [13C,15N]-Arg/Lys (total reaction volume, 220 μL).
Immunoprecipitation of the APC subunits
HeLa S3 cells (ATCC) were synchronized and lysed as previously described21, however, cells were synchronized with a single thymidine block (2 mM, 20 hours) and then released for three hours before addition of 100 ng/mL nocodazole. Cells were harvested at various time points between 0 and 12 hours of nocodazole treatment (for details, see figures in the Results section). The approximate relative abundance of CDC27 in HeLa S3 lysates vs. wheat germ extracts were determined by Western blotting (see Supplementary Figure 1) using an antibody to the C-terminus of CDC27 (AF3.1, Santa Cruz). For immunoprecipitation of CDC27, HeLa S3 lysate (~10 mg/mL protein as determined by Bradford assay) and WGE/CDC27H were mixed to a final volume of 300 μL lysate such that the amount of CDC27L and CDC27H were approximately equivalent (see Supplementary Figure 1). The antibody was immobilized to Affi-Prep Protein A beads (Bio-Rad) - the beads (30 μL/300 μL lysate) were washed twice with six volumes buffer A (10 mM phosphate buffer (pH 7.4), 120 mM NaCl, 2.7 mM KCl, 0.1% Triton-X), twice with six volumes buffer B (10 mM phosphate buffer (pH 7.4), 120 mM NaCl, 300 mM KCl, 0.1% Triton-X), and then once more with buffer A. Cell lysates were pre-cleared by adding 10 μL of washed beads. Antibody was added to the remaining beads at equal volume; the final volume was adjusted to (70–75 μL) with buffer A. Pre-clearing and antibody-binding steps were done at 4 °C for two hours, while rotating. The antibody beads were then washed with buffers A and B as described above and the pre-cleared lysates were subsequently added. CDC27 immunoprecipitations were rotated for two hours and at 4 °C - all immunoprecipitaitons were done at 4 °C to minimize potential modification of the standard (CDC27H) by HeLa cell extract proteins. Beads were washed once more with buffers A and B as described above. The proteins were eluted from the beads by boiling in 75 μL Laemmli buffer (Bio-Rad) for 10 minutes, and 30 μL of each immunoprecipitate was loaded on an SDS-PAGE (4–12% Bis-Tris, NuPage, Invitrogen) for subsequent in-gel trypsin digestion22. The digests were resuspended in 20 μL loading buffer (5 % formic acid, 5 % acetonitrile).
For FLEXIQuant analysis of APC5 as a subunit of the APC, the APC was immunoprecipitated via CDC27 as described above (without the addition of the CDC27 protein standard). The labeled APC5 was batch-purified from WGE (220 μL extract) with 50 μL bed volume of Ni-sepharose (GE Healthcare). The binding, wash and elution buffers (in 20 mM phosphate buffer pH 7.0, 500 mM NaCl) consisted of 30, 60 and 500 mM imidazole, respectively. The binding step was done at 16 °C for one hour while shaking; the beads were washed twice (500 μL wash buffer); and the final volume of eluted APC5 was 200 μL, which was stored at −20 °C. The APC5 protein standard was mixed with the boiled/eluted APC sample, resolved by SDS-PAGE and in-gel trypsin digested.
Absolute quantitation of CDC27 using the FLEX-tagL standard
For absolute quantitation of the labeled CDC27, 20 μL of WGE/FLEXtagH-CDC27H was fractionated by SDS-PAGE and the area corresponding to the molecular weight of the protein was in-gel trypsinized. Peptides were resuspended in 20 μL of loading buffer. Solutions of 1 μM, 0.1 μM, and 0.01 μM of the FLEX-tagL peptide (900 μM stock, stored at −20 °C) were freshly prepared (diluted in loading buffer) for each spiking experiment. The FLEX-tagH-CDC27H peptides (4 μL) were mixed with each FLEX-tagL stock (1 μL), from which 4 μL were MS-analyzed. The absolute quantity of each CDC27 sample was determined by the relative ratios of the FLEX-tagL:FLEX-tagH monoisotopic peaks. For absolute quantitation of the biological/light CDC27, 20 μL of quantified WGE/FLEXtagH-CDC27H was mixed with 180 μL HeLa S3 lysate (from thymidine treated cells), immunoprecipitated and trypsinized as described above. The absolute quantity of CDC27 was determined by the average of the relative ratios of 21 isotopogolous peaks, at a cell state known to have no PTMs.
LC/MS analysis
All experiments were performed using an LTQ-Orbitrap mass spectrometer linked to a micro-autosampler and a nanoflow HPLC pump (both: Eksigent). The reversed phase columns were packed in-house by using Magic C18 particles (3 μm, 200 Å; Michrom Bioresource) and PicoTip Emitters (New Objective, Woburn, MA). The peptides were eluted with a 30 minute linear gradient and data acquired in a data dependent fashion, fragmenting the 6 most abundant peptide species. Buffer A was 0.2% formic acid, buffer B was acetonitrile/0.2 % formic acid, and loading buffer was 5% formic acid/5% acetonitrile.
Spectral analysis
MS/MS raw data were submitted to MASCOT, and searched against the human IPI database and a custom database containing also the sequences of the recombinant proteins for peptide identification. For quantification, the area under the appropriate selected ion chromatogram for each light and heavy monoisotopic peak was determined using Xcalibur (Thermo Scientific).
Statistics and Reproducibility
When measured in triplicate 95% of the peptides have a standard deviation of less than 12% (see Supplementary Figure 3). The median standard deviation between triplicate measurements of the same peptide is <6%. Taken as a group (making the assumption that all measurements are independent) the standard deviation of all the peptides used for normalization is 10%. When the replicate measurements are averaged the standard deviation of the normalization peptides as a group improves to 8%. Furthermore, the unmodified peptides are effectively measured 12 times (four times points and 3 measurements per time point) allowing us to accurately assess the error on individual peptides. For an individual peptide, the standard deviation was less than 14% for 95% of the peptides and the median standard deviation was 8%.
Results
Overview of the FLEXIQuant strategy
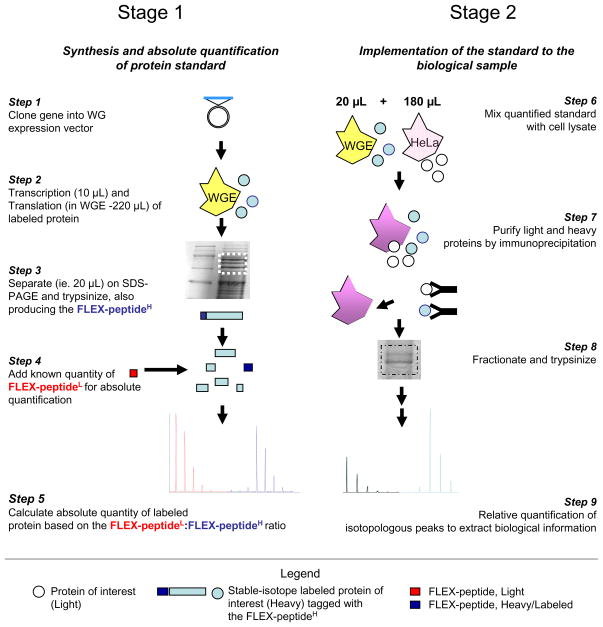
The workflow for FLEXIQuant, presented in Figure 1, comprises two fundamental stages: 1) the expression and quantification of the heavy full-length internal standard and 2) the detailed analysis of the protein of interest using the FLEXIQuant strategy.
Figure 1.
The FLEXIQuant workflow comprises two stages. Stage 1 (Steps 1 to 5): Absolute quantification of the in vitro synthesized full-length labeled. The gene of interest is cloned into the WG expression vector, which is then separately transcribed and then translated in WGE (Steps 1 and 2). A defined volume of WGE expressing the protein standard is prepared for MS analysis. A known amount of (light) AQUA peptide (FLEX-peptideL) is added prior to MS in order to quantify the protein standard via the FLEX-peptideH (Steps 3 and 4). The concentration of the protein standard in the WGE can then be calculated based on the relative peak ratios (Step 5). Stage 2 (Steps 6 to 9) - WGE and (HeLa) cell lysate are mixed; the heavy and light proteins are co-purified and trypsinized together, resulting in identical sample preparation for both protein species (Steps 6 to 8). The absolute quantity of the light protein and a relative peptide abundance analysis can then be determined by peak integration (Step 9).
STAGE 1
The gene of interest is cloned into a WG expression vector19 modified such that the gene can be fused with our novel FLEX-tag for purification and quantification (Step 1 and Figure 2a). The recombinant protein is transcribed/translated (IVT’ed) in a cell-free WGE system (Step 2) to which all amino acids are exogenously supplied including the relevant heavy isotopologs. The concentration of the heavy protein standard in the WGE is then determined by isotope dilution/AQUA utilizing the unique FLEX-peptide (Steps 3 to 5; Figure 2).
Figure 2.
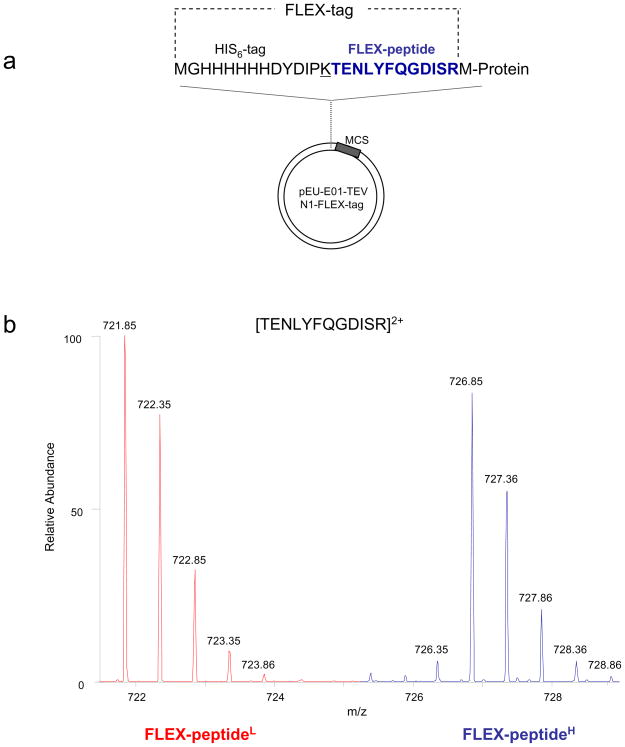
Design and implementation of the FLEXIQuant peptide (FLEX-peptide). (a) The wheat germ transcription/translation vector highlighting the FLEX-tag. A T14K substitution (underlined) was made to generate the N-terminal tryptic FLEX-peptide (blue) for absolute quantitation experiments. The gene of interest is cloned immediately after the arginine residue. (b) The peak profile for the light (red) and heavy (blue) FLEX-peptides. The light peak intensity corresponds to 100 fmoles of spiked peptide.
STAGE 2
For the absolute quantification and relative peptide abundance analysis of the endogenous protein of interest, a defined aliquot of the WGE expressing the quantified standard, (STAGE 1), is mixed with biological sample (Step 6). The protein of interest and its heavy standard are immunoprecipitated (Step 7), digested, and mass spectrometricly analyzed (Steps 8 and 9). Finally, the peak pairs are identified and their ratios are calculated to identify peptides whose relative abundances are reduced and to quantify the extents of these reductions. Relative peptide abundance analysis thus brings to light the identities of peptides/sequences e.g. harboring PTMs on their side chains (Step 9).
Implementation of the FLEXIQuant protocol
Step 1: Design of the FLEX-peptide
Each protein is tagged, N- or C-terminally, with the His6-tag and the artificial tryptic peptide, FLEX-peptide (TENLYFQGDISR, Figure 2). This peptide has a good response factor/ionization and detection efficiency and thus produces a strong MS signal23; moreover, it does not occur in the NRDB as of June 15, 2008 and thus is applicable to a wide range of organisms.
Steps 2 and 3: Protein Expression
To determine the practicality of the wheat germ system, we tested the expression of a number of eukaryotic proteins in the presence of 13C,15N-Arg and 13C,15N-Lys, ranging in molecular weight from 18 kDa (APC10) to 120 kDa (BubR1). Their expression was verified by Coomassie stain or by Western blotting using the anti-His6 epitope. All tested proteins were available within 1 day as full-length soluble proteins with sizable yields in the picomole range19, i.e. sufficient for tens of mass spectrometric experiments. The reaction volume can be scaled depending on the needs. We observed at least 97.5 % incorporation of the heavy amino acids into the proteins (see Supplemental Figure 2 for six different peptides from two proteins), indicating that at most 2.5 % of the light peptide signal intensity is background contribution.
Steps 3 to 5, Absolute quantification of the labeled standard using the FLEX-peptide
For absolute quantification of the heavy/labeled standard (CDC27H) a defined aliquot of the CDC27H-expressing WGE was separated by SDS-PAGE, the region of interest excised and subsequently trypsinized for absolute quantification by isotope dilution/AQUA as described before15. The concentration of the CDC27H in the WGE was determined to be 14.72 ± 1.4 nM corresponding to a total amount of 3.2 pmol in the original reaction volume. Once quantified, the protein standard can be stored −80 °C until further use, as the presence of the wheat germ-derived proteins prevents sample loss due to non-specific adsorption.
Steps 6 to 8, Sample preparation/protein purification
Since the protein standard is soluble in the WGE, it can be mixed with the biological sample for immunoprecipitation. In the case of CDC27, less than 15 % of our IVT reaction volume was added to mg amounts (protein weight) of HeLa cell extract containing the natural/light protein (CDC27L). Although not necessary, it can be advantageous to have approximate information about the abundance levels in the extract and the lysate. If this is the case, optional Western blotting experiments can be carried out. In this study, the absolute light:heavy peak ratios ranged from 0.2 to 1.5, thus differences up to five-fold in sister peak ratios were accurately quantified (Supplementary Figure 3). Relative peak ratio differences can be much larger (100-fold difference, for example 18), however, accurate peak integration is dependent on the absolute signal intensities of the peaks with respect to background noise, rather than their relative abundances. As such, the permissible mixing conditions for the WGE and cellular lysate will vary from protein to protein, depending on the ionization properties of the peptides and background noise of the sample. Once the relative abundances of the input proteins (from WGE and HeLa cell lysate) have been determined, the mixing ratio of the two protein sources can be standardized for future experiments (see Supplementary Figure 1). CDC27L and CDC27H were co-purified from the complex mixture of HeLa cell lysate and WGE. In the case of CDCD27, the N-terminal FLEX-tag did not interfere with the IP efficiency of the CDC27H, as compared to that of the CDC27L that is devoid of the tag (see Supplementary Figure 1). The immunoprecipitate was fractionated by SDS-PAGE, the region of interest excised, in-gel digested and analyzed by LC/MS on a high resolution LTQ-Orbitrap mass spectrometer.
Step 9, Absolute protein quantification
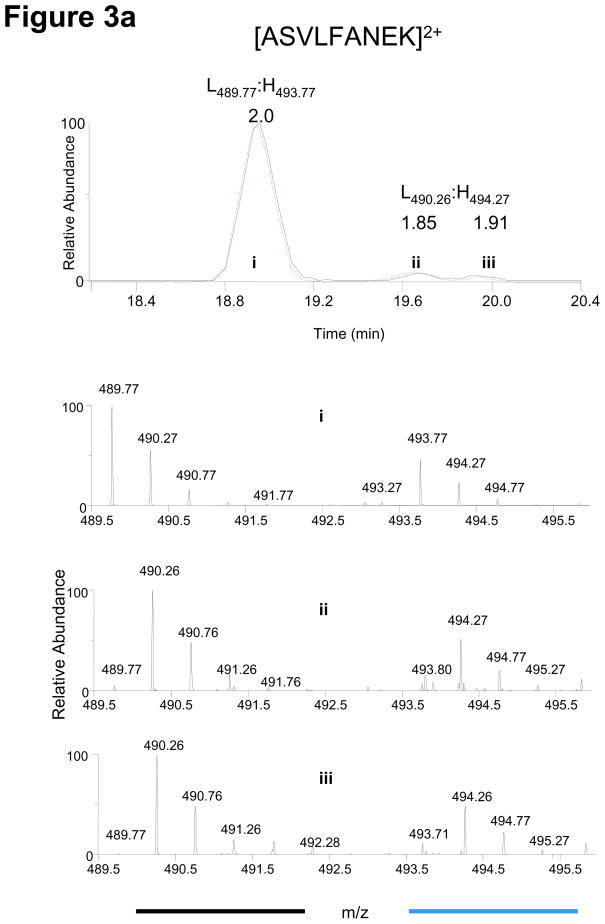
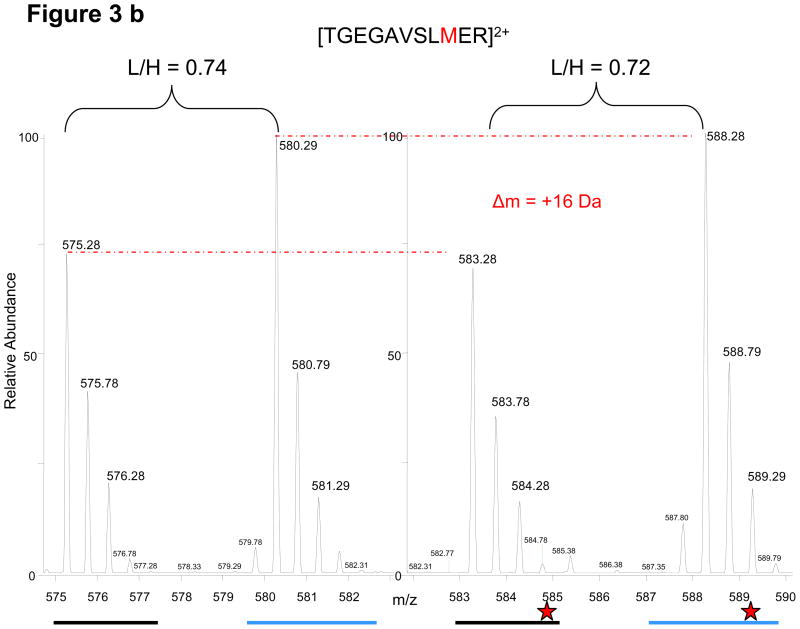
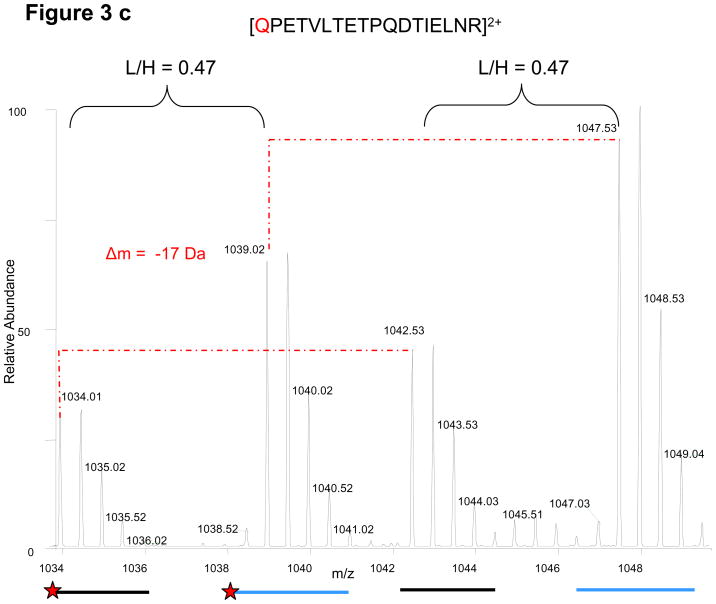
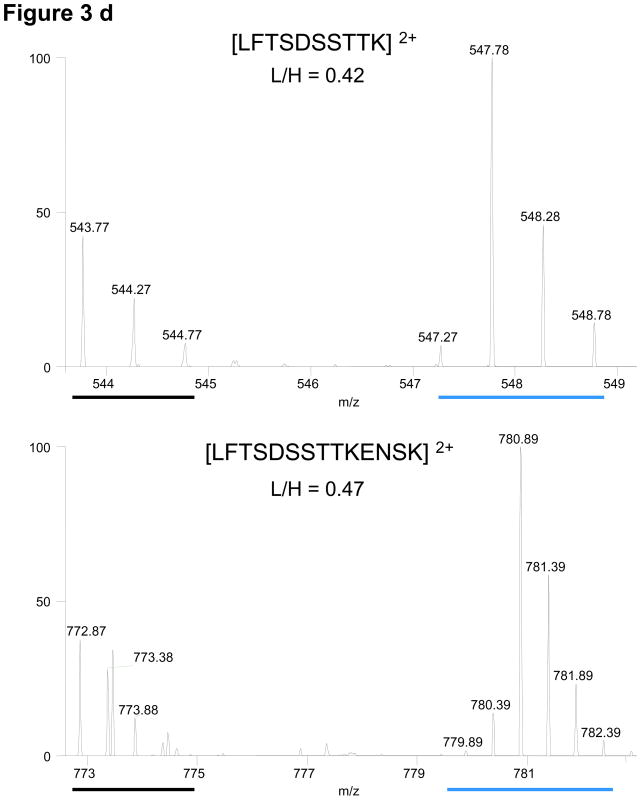
All isotopically-labeled peptides from the full-length protein can serve as stable internal standards for their respective light counterparts. Even stochastic events such as artificial modifications occurring during immunoprecipitation, SDS-PAGE and digestion do not affect the protein quantification as both light and heavy proteins/peptides are modified to the same extent leaving the relative ratios constant. This directly results from the FLEXIQuant strategy which introduces the protein standard at the beginning of the workflow. Common stochastic events include deamidation, methionine oxidation, pyroglutamic acid formation, partial cleavages, and sample loss due to adhesion to tubes or tips, which negatively affect traditional AQUA type quantification. Examples from various FLEXIQuant experiments are shown in Figure 3. All examples demonstrate the conservation of relative ratios irrespective of the stochastic event.
Figure 3.
Conservation of relative light and heavy peak intensities despite artificial modifications and other stochastic events during sample preparation. A red dashed line links each monoisotopic peak to its corresponding modified form. (a) From CDC27, the elution profile/chromatogram (upper panel) and corresponding MS1 spectra (lower panel) of the unmodified peptide (i) and its deamidated forms (ii, iii). Chromatogram: the black and blue traces correspond to light and heavy profiles, respectively, and are not to scale with respect to each other. The relative monoisotopic peak ratios are indicated above each elution peak (b) From APC5, an oxidized methionine and its characteristic mass shift of 16 Da is observed for both light and heavy peptides. (c) From CDC27, the random conversion of a pyroglutamic acid from an N-terminal glutamine occurs to the same extent for both peptides. (d) From CDC27, relative peak ratios are not perturbed by incomplete trypsinization. Red stars indicate sites with decreased signal intensities. Examples are from different FLEXIQuant experiments.
For absolute quantification of CDC27L, we added a defined, previously quantified (Steps 3 to 5, above) volume of WGE/CDC27H (20 μl) to S-phase synchronized HeLa cell extract (180 μl). For all 21 observed CDC27-derived peptides, the light-to-heavy peak ratios were calculated to be 0.84 ± 0.07. Based on this ratio, the absolute amount of CDC27 in the HeLa cell extract was 247 femtomoles (1.24 nM). These numbers refer to the absolute amount (concentration) prior to the immunoprecipitation; a number which is not accessible by AQUA. This number assumes identical IP-efficiencies for CDC27L and CDC27H. However, this assumption is only relevant for absolute quantification and can be experimentally addressed if necessary.
Step 9, Qualitative and quantitative peptide modification analysis
Since the CDC27L protein is susceptible to in vivo PTMs, the light-to-heavy ratios will vary as a function of the extent of modification. While this variation is a problem for absolute quantification purposes, it is advantageous for the discovery of, for example, putative PTM sites using the FLEXIQuant strategy.
We analyzed CDC27L isolated from HeLa cells that were arrested for varying time periods with the spindle poison nocodazole. This drug is known to block cell cycle progression in prometaphase, where various APC components are phosphorylated on numerous serine and threonine residues11, 24. To establish the relative peptide abundance dynamics of CDC27, we analyzed CDC27 isolated from cells at S-phase, and at 4 hrs, 8 hrs and 10 hrs after exposure of nocodazole. WGE/CDC27H was added to each of the four cell lysates and simultaneously immunoprecipitated with CDC27L. As phosphorylated CDC27L is known to show significant changes of the electrophoretic mobility, we excised a region from 64 kDa to 100 kDa to ensure that all modified forms of CDC27L were included in the analysis. After in-gel digestion, the digests were analyzed by LC/MS (Orbitrap).
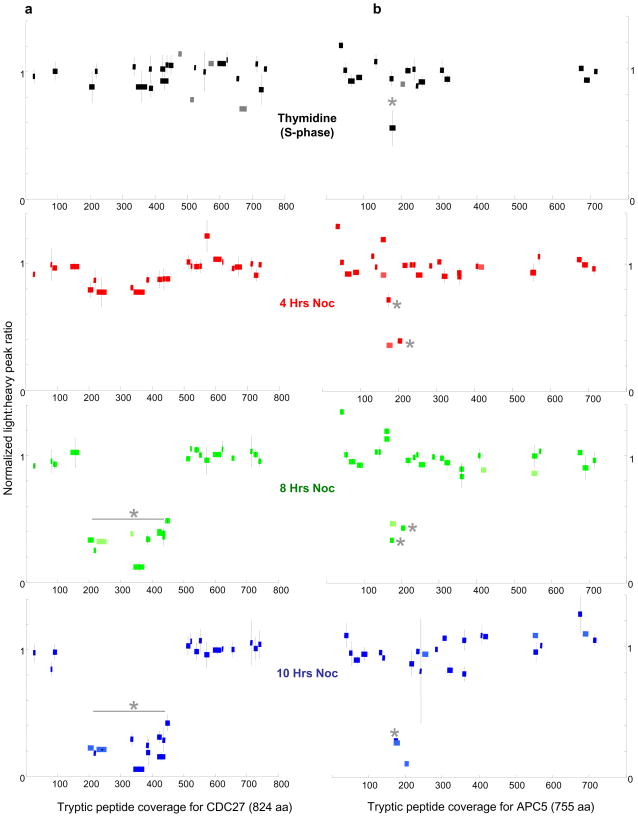
Any in vivo modification would decrease the light-to-heavy peak ratio, by altering the molecular weight (m/z value in MS terms) and the retention time due to the modifications of a fraction of the peptide. The extent of this decrease is correlated with the extent of modification. To monitor these changes for each time point, we plotted the normalized light-to-heavy peak ratio for each observed peptide (Figure 4a). A comparison of the relative peak ratios across the four conditions reveals a gradual yet marked response to nocodazole, specifically in the N-terminus. In S-phase, the relative peak ratios are similar with respect to each other indicating no or very little PTMs. At 4 hrs of exposure to nocodazole, however, a response to the drug is suggested by the subtle drop (by ~20 %) in the peak ratios of peptides spanning amino acids 197 to 446, as compared to the other peptides. The longer exposure times of 8 hrs and 10 hrs further reduce these peak ratios by 50 to 95 %, demonstrating that nocodazole elicits a PTM response confined to the N-terminus. These results corroborate that the subtle differences observed at the 4 hrs time point are significant.
Figure 4.
Relative peptide abundances of CDC27 and APC5 in response to nocodazole exposure. The normalized light-to-heavy peak ratios (Y-axis) for all observed peptides were plotted for each time point after nocodazole exposure (0/synthesis phase, 4, 8 and 10 hrs nocodazole exposure). The peptides are drawn to scale and mapped (from the N- to C-terminus) according to their position along the protein (X-axis). (a) CDC27 - The gradual decrease of the unmodified forms of peptides spanning amino acids 197 to 446 is observed; their relative abundances drop to 10–20 % as compared to the majority of unmodified peptides, by 10 hrs of nocodazole exposure. The differences of these peptide abundances are statistically significant (asterisks). For statistical analysis, see Supplementary Figure 3. (b) APC5 - The relative abundances of three peptides (amino acids 169 to 210, asterisks) decrease dramatically (as low as 10 %) with respect to the majority of peptides. CDC27 data are averaged between two biological repeats, and a third, technical repeat (Supplementary Figure 3). APC5 data represent a single biological experiment (three technical repeats) which was done in parallel with that of one of the biological runs of CDC27. Error bars - standard deviations from the normalized ratios. For any given time point, 1 to 4 peptides were observed/quantified only two times (lacking error bars, colored in lighter shades), but were included since they were measured three times in the other time points.
A peptide and its heavy isotopologue have the same ionization/detection efficiency. Thus, all peptides and their respective heavy isotopologues have the same intensity ratios within the experimental and instrumental errors if they remain unmodified. Only those peptides that become modified will show a deviation from this constant ratio, as a fraction of the light peptide exists in a modified form with an altered m/z value and retention time. To estimate both the experimental and instrumental errors and the contribution of PTMs, we calculated the standard deviation (SD) of each peptide at each time point. Most points showed a SD under 20% across all measurements (see Supplementary Figure 3a). We then analyzed the SDs across the time points and found that they fell into two classes (see Supplementary Figure 3b). A subset of the data points showed significantly higher SDs (above 20 %), indicating PTMs. The normalization was then repeated in the absence of these peptides. Thus FLEXIQuant provides a strong means for normalization based on the use of non-modified peptides and a means for detecting protein modification based on detecting those peptides that deviate from the normalization.
FLEXIQuant for protein complex studies
A slight alteration to the FLEXIQuant workflow makes it amenable to analysis of protein complexes. CDC27 is a subunit of the APC, thus its immunoprecipitation also precipitates the other core subunits of the APC, such as APC5. The co-purification of the APC subunits gives us the opportunity to analyze each one specifically, rather than as a member of a mixed population from the entire cell lysate. For this experiment, the workflow as described in Figure 1 was altered: i) the full-length APC5H was purified using the His6-tag, and ii) APC5H was mixed with the immunoprecipitated APC (via CDC27L) just prior to SDS-PAGE. The band consisting of APC5L+H was excised for in-gel trypsinization. Again, 4 different time points were analyzed (Figure 4b). In contrast to CDC27, the nocodazole-induced PTMs on APC5L occur faster and are more focal. The 3 observed peptides covering amino acid 169 to 210 show a drop of more than 50 % in their light-to-heavy peak ratios at just 4 hrs. This ratio is further decreased to 90 % by 10 hrs of nocodazole treatment. These data demonstrate for the first time, the extent of differential regulation of two subunits of the APC, CDC27 and APC5, in response to an anti-mitotic spindle poison.
Discussion
We introduce FLEXIQuant, a novel strategy based on the full-length protein standard, which can a) quantify the relative and absolute amounts of a protein of interest and b) monitor and quantify the progression of several PTM-susceptible sites simultaneously. When an antibody for the protein of interest is available, this method allows analysis of low abundance proteins. In view that MS-based quantification studies, especially early “rapid-prototyping” experiments, require only sub-Kg of protein standard, an expression system compatible with this scale can be cost-effective and general in applicability. The cell-free WGE meets these requirements. It is particularly well suited for soluble eukaryotic protein standards: hundreds of nanograms of full-length labeled proteins can be produced for approximately $40. A wide range of soluble protein standards can be made from cDNA clones in one day; the expression can easily be scaled. The solubility factor is of particular importance for our approach as it makes FLEXIQuant compatible with immunoprecipitation. The strategic design of the FLEX-peptide allows for a simple and reliable quantification of the standard by AQUA even at the sub-Kg level. In this case, AQUA peptide is not labeled and thus inexpensively synthesized as the protein of interest is isotopically labeled. The unique sequence of the FLEX-peptide permits unequivocal identification and thus quantification from complex protein mixtures irrespective of their organismal origin.
Since the workflow is compatible with immunoprecipitation strategies, FLEXIQuant is amenable to proteins of very low abundance which require enrichment prior to mass spectrometric analysis. For proteins whose epitopes are located at the N-terminus, and thus whose IP efficiencies may be compromised by the FLEX-tag, the C-terminal version of the FLEX-tag is available as an alternative (see Supplementary Table 1). Combining FLEXIQuant with immunoprecipitation has the additional advantage that the standard is stored in the presence of WGE, thereby eliminating the problem of non-specific losses due to adsorption on tube walls, a common problem when handling protein quantities at low concentrations18. As a result, quantification accuracy is not compromised by long term storage, as observed with strategies using purified proteins as internal standards18. Moreover, since the standard is mixed with the biological sample early in the workflow (Figure 1), stochastic events such as artificial modifications or sample losses due to sample handling become negligible since both heavy and light proteins are affected identically (Figure 3). Consequentially, these events do not affect isotopogolous peak ratios, values from which the quantitative information is obtained.
The advantages of using full length isotopically labeled proteins instead of a small number of synthetic peptides for the absolute quantification of proteins of interest have been discussed in detailed previously16–18. However, the ability to synthesize soluble labeled protein standards allows for a novel approach to localize and quantify protein modifications. Firstly, the FLEXIQuant standard defines all observable and thus quantifiable peptides allowing for unequivocal differentiation between absence of peptide ions due to either poor ionization and detection efficiencies/response factors, or unaccounted protein modifications. Since the standard protein is not modified, all heavy peptides serve as stable references. Thus, decreases in light peptide intensities relative to the heavy ones can now be interpreted as biological events (i.e., PTMs). Although peptides that undergo modifications cannot be used for the absolute quantification of the protein amount, they can be used for the quantification of the extent of modification.
While FLEXIQuant is a powerful tool to identify PTM-susceptible peptides, the standard work flow cannot distinguish between co-occupancies (PTMs competing for the same peptide) or determine if a PTM exchange has occurred during the time course of an experiment. Different strategies are available to characterize the modified cognates of peptides whose reduction in light-to-heavy peak ratios are revealed with FLEXIQuant. Often, the modified peptide has been sequenced during the data dependent acquisition such that routines for biased (e.g. Mascot or Sequest) or unbiased analyses of spectra from modified peptides (e.g. SALSA25 or P-Mod26) can be applied. Alternatively, the mass spectral data can be searched for peptide species that show changes in peak intensities that are correlated to the changes observed for the modified peptide. Once such species have been identified, directed mass spectrometric experiments can be performed.
FLEXIQuant can distinguish between basal alterations to peptides and those induced by stimuli such as drugs, small molecule inhibitors, and RNAi. A correlation between elicitor exposure time (or concentration) and changes in relative peak intensities will identify the stimulus-specific changes. This correlative approach confirmed nocodazole-triggered decreases of CDC27 and APC5 peptides (Figure 4). The PTM sites on CDC27 were phosphorylation events identified previously11, 24. These studies, however, were not able to demonstrate the relative changes in abundances of this many peptides in a single experiment, illustrating further the extent of information that is attainable using FLEXIQuant. Differential PTM statuses of CDC27 in response to an assortment of anti-mitotic drugs have also been reported11, 24. Some PTM sites are in common among these drugs, thus the FLEXIQuant method will be informative to assess whether the relative rates of PTMs for different drugs play a role in the efficacy of drug treatment.
FLEXIQuant is also adaptable to analyzing subunits in protein complexes, as demonstrated with APC5. For this type of analysis, the workflow is slightly altered (Figure 1): the standard is purified from the WGE and added to a protein complex prior to SDS-PAGE. Although the APC5 standard was added later in the workflow as compared to CDC27, very little (if any) differences due to stochastic events were noticeable as these events mainly occur during electrophoresis and proteolysis. Absolute quantification of the standard is also possible, as once purified from the WGE, it can be quantified by AQUA (FLEX-peptideL).
In summary, FLEXIQuant is a useful strategy for MS-based detailed analysis of proteins, including their absolute quantification, identification of changes in relative peptide abundances, and monitoring the extent of these altered peptide abundances and their dynamics which may provide information about post-translational modification; an assumption that can be confirmed by the concomitantly acquired MS2-data. In addition, the system is easily scalable, compatible with immunoprecipitation and cost- and time-efficient.
Supplementary Material
Acknowledgments
We thank Cell Free Sciences for providing the Wheat Germ Extract system. This research was funded by the NIH/NIGMS Cell Cycle Regulation Grant (2 R01 GM039023). MS is supported by the Helen Hay Whitney Foundation Postdoctoral Fellowship. Part of this work was supported by the International Rett Syndrome Foundation by a Research Award to JS.
List of Abbreviations
- AQUA
absolute quantitation
- AAA
amino acid analysis
- APC
anaphase-promoting complex
- FLEXIQuant
full-length expressed stable-isotope labeled proteins for quantification
- MS
mass spectrometry
- PTM
post-translational modification
- WGE
wheat germ extract
Footnotes
Supplementary Figures 1 to 3, and Supplementary Table 1 are provided in the Supporting Information which is available free of charge via the Internet at http://pubs.acs.org.
References
- 1.Hunter T. The age of crosstalk: phosphorylation, ubiquitination, and beyond. Mol Cell. 2007;28:730–8. doi: 10.1016/j.molcel.2007.11.019. [DOI] [PubMed] [Google Scholar]
- 2.Bhaumik SR, Smith E, Shilatifard A. Covalent modifications of histones during development and disease pathogenesis. Nat Struct Mol Biol. 2007;14:1008–16. doi: 10.1038/nsmb1337. [DOI] [PubMed] [Google Scholar]
- 3.Oda Y, Huang K, Cross FR, Cowburn D, Chait BT. Accurate quantitation of protein expression and site-specific phosphorylation. Proc Natl Acad Sci U S A. 1999;96:6591–6. doi: 10.1073/pnas.96.12.6591. [DOI] [PMC free article] [PubMed] [Google Scholar]
- 4.Gygi SP, Rist B, Gerber SA, Turecek F, Gelb MH, Aebersold R. Quantitative analysis of complex protein mixtures using isotope-coded affinity tags. Nat Biotechnol. 1999;17:994–9. doi: 10.1038/13690. [DOI] [PubMed] [Google Scholar]
- 5.Fenselau C. A review of quantitative methods for proteomic studies. J Chromatogr B Analyt Technol Biomed Life Sci. 2007;855:14–20. doi: 10.1016/j.jchromb.2006.10.071. [DOI] [PubMed] [Google Scholar]
- 6.Ross PL, Huang YN, Marchese JN, Williamson B, Parker K, Hattan S, Khainovski N, Pillai S, Dey S, Daniels S, Purkayastha S, Juhasz P, Martin S, Bartlet-Jones M, He F, Jacobson A, Pappin DJ. Multiplexed protein quantitation in Saccharomyces cerevisiae using amine-reactive isobaric tagging reagents. Mol Cell Proteomics. 2004;3:1154–69. doi: 10.1074/mcp.M400129-MCP200. [DOI] [PubMed] [Google Scholar]
- 7.Schmidt A, Kellermann J, Lottspeich F. A novel strategy for quantitative proteomics using isotope-coded protein labels. Proteomics. 2005;5:4–15. doi: 10.1002/pmic.200400873. [DOI] [PubMed] [Google Scholar]
- 8.Yao X, Freas A, Ramirez J, Demirev PA, Fenselau C. Proteolytic 18O labeling for comparative proteomics: model studies with two serotypes of adenovirus. Anal Chem. 2001;73:2836–42. doi: 10.1021/ac001404c. [DOI] [PubMed] [Google Scholar]
- 9.Ibarrola N, Kalume DE, Gronborg M, Iwahori A, Pandey A. A proteomic approach for quantitation of phosphorylation using stable isotope labeling in cell culture. Anal Chem. 2003;75:6043–9. doi: 10.1021/ac034931f. [DOI] [PubMed] [Google Scholar]
- 10.Kruger M, Kratchmarova I, Blagoev B, Tseng YH, Kahn CR, Mann M. Dissection of the insulin signaling pathway via quantitative phosphoproteomics. Proc Natl Acad Sci U S A. 2008;105:2451–6. doi: 10.1073/pnas.0711713105. [DOI] [PMC free article] [PubMed] [Google Scholar]
- 11.Steen JA, Steen H, Georgi A, Parker K, Springer M, Kirchner M, Hamprecht F, Kirschner MW. Different phosphorylation states of the anaphase promoting complex in response to antimitotic drugs: a quantitative proteomic analysis. Proc Natl Acad Sci U S A. 2008;105:6069–74. doi: 10.1073/pnas.0709807104. [DOI] [PMC free article] [PubMed] [Google Scholar]
- 12.Barr JR, Maggio VL, Patterson DG, Jr, Cooper GR, Henderson LO, Turner WE, Smith SJ, Hannon WH, Needham LL, Sampson EJ. Isotope dilution--mass spectrometric quantification of specific proteins: model application with apolipoprotein A-I. Clin Chem. 1996;42:1676–82. [PubMed] [Google Scholar]
- 13.Beynon RJ, Doherty MK, Pratt JM, Gaskell SJ. Multiplexed absolute quantification in proteomics using artificial QCAT proteins of concatenated signature peptides. Nat Methods. 2005;2:587–9. doi: 10.1038/nmeth774. [DOI] [PubMed] [Google Scholar]
- 14.Desiderio DM, Kai M. Preparation of stable isotope-incorporated peptide internal standards for field desorption mass spectrometry quantification of peptides in biologic tissue. Biomed Mass Spectrom. 1983;10:471–9. doi: 10.1002/bms.1200100806. [DOI] [PubMed] [Google Scholar]
- 15.Gerber SA, Rush J, Stemman O, Kirschner MW, Gygi SP. Absolute quantification of proteins and phosphoproteins from cell lysates by tandem MS. Proc Natl Acad Sci U S A. 2003;100:6940–5. doi: 10.1073/pnas.0832254100. [DOI] [PMC free article] [PubMed] [Google Scholar]
- 16.Brun V, Dupuis A, Adrait A, Marcellin M, Thomas D, Court M, Vandenesch F, Garin J. Isotope-labeled protein standards: toward absolute quantitative proteomics. Mol Cell Proteomics. 2007;6:2139–49. doi: 10.1074/mcp.M700163-MCP200. [DOI] [PubMed] [Google Scholar]
- 17.Janecki DJ, Bemis KG, Tegeler TJ, Sanghani PC, Zhai L, Hurley TD, Bosron WF, Wang M. A multiple reaction monitoring method for absolute quantification of the human liver alcohol dehydrogenase ADH1C1 isoenzyme. Anal Biochem. 2007;369:18–26. doi: 10.1016/j.ab.2007.06.043. [DOI] [PubMed] [Google Scholar]
- 18.Hanke S, Besir H, Oesterhelt D, Mann M. Absolute SILAC for Accurate Quantitation of Proteins in Complex Mixtures Down to the Attomole Level. J Proteome Res. 2008;7:1118–30. doi: 10.1021/pr7007175. [DOI] [PubMed] [Google Scholar]
- 19.Endo Y, Sawasaki T. High-throughput, genome-scale protein production method based on the wheat germ cell-free expression system. J Struct Funct Genomics. 2004;5:45–57. doi: 10.1023/B:JSFG.0000029208.83739.49. [DOI] [PubMed] [Google Scholar]
- 20.Yu H, Peters JM, King RW, Page AM, Hieter P, Kirschner MW. Identification of a cullin homology region in a subunit of the anaphase-promoting complex. Science. 1998;279:1219–22. doi: 10.1126/science.279.5354.1219. [DOI] [PubMed] [Google Scholar]
- 21.Fang G, Yu H, Kirschner MW. The checkpoint protein MAD2 and the mitotic regulator CDC20 form a ternary complex with the anaphase-promoting complex to control anaphase initiation. Genes Dev. 1998;12:1871–83. doi: 10.1101/gad.12.12.1871. [DOI] [PMC free article] [PubMed] [Google Scholar]
- 22.Shevchenko A, Wilm M, Vorm O, Mann M. Mass spectrometric sequencing of proteins silver-stained polyacrylamide gels. Anal Chem. 1996;68:850–8. doi: 10.1021/ac950914h. [DOI] [PubMed] [Google Scholar]
- 23.Steen H, Jebanathirajah JA, Springer M, Kirschner MW. Stable isotope-free relative and absolute quantitation of protein phosphorylation stoichiometry by MS. Proc Natl Acad Sci U S A. 2005;102:3948–53. doi: 10.1073/pnas.0409536102. [DOI] [PMC free article] [PubMed] [Google Scholar]
- 24.Kraft C, Herzog F, Gieffers C, Mechtler K, Hagting A, Pines J, Peters JM. Mitotic regulation of the human anaphase-promoting complex by phosphorylation. Embo J. 2003;22:6598–609. doi: 10.1093/emboj/cdg627. [DOI] [PMC free article] [PubMed] [Google Scholar]
- 25.Rognes T, Seeberg E. SALSA: improved protein database searching by a new algorithm for assembly of sequence fragments into gapped alignments. Bioinformatics. 1998;14:839–45. doi: 10.1093/bioinformatics/14.10.839. [DOI] [PubMed] [Google Scholar]
- 26.Hansen BT, Davey SW, Ham AJ, Liebler DC. P-Mod: an algorithm and software to map modifications to peptide sequences using tandem MS data. J Proteome Res. 2005;4:358–68. doi: 10.1021/pr0498234. [DOI] [PubMed] [Google Scholar]
Associated Data
This section collects any data citations, data availability statements, or supplementary materials included in this article.


