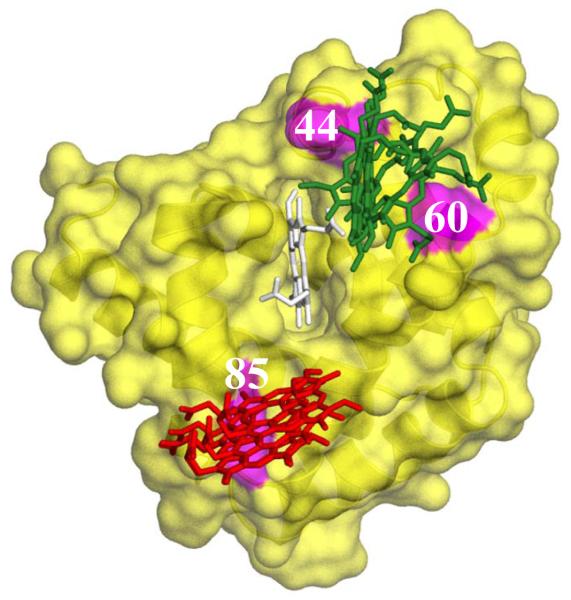
Abstract
We describe a strategy by which reactive binding of a weakly-bound, ‘dynamically docked (DD)’ complex without a known structure can be strengthened electrostatically through optimized placement of surface charges, and discuss its use in modulating complex formation between myoglobin (Mb) and cytochrome b5 (b5). The strategy employs paired Brownian Dynamics (BD) simulations, one which monitors overall binding, the other reactive binding, to examine [X → K] mutations on the surface of the partners, with a focus on single and multiple [D/E → K] charge reversal mutations. This procedure has been applied to the [Mb, b5] complex, indicating mutations of Mb residues D44, D60 and E85 to be the most promising, with combinations of these showing a nonlinear enhancement of reactive binding. A novel method of displaying BD profiles shows that the ‘hits’ of b5 on the surfaces of Mb(WT), Mb(D44K/D60K), and Mb(D44K/D60K/E85K) progressively coalesce into two ‘clusters’: a ‘diffuse’ cluster of hits that are distributed over the Mb surface and have negligible electrostatic binding energy; a ‘reactive’ cluster of hits with considerable stability that are localized near its heme edge, with short Fe-Fe distances favorable to electron transfer (ET). Thus binding and reactivity progressively become correlated by the mutations. This finding fits well with recent proposals that complex formation is a two-step process, proceeding through the formation of a weakly-bound encounter complex (‘diffuse cluster’) to a well-defined bound complex (‘reactive cluster’). The design procedure has been tested through measurements of photoinitiated ET between the Zn-substituted forms of Mb(WT), Mb(D44K/D60K) and Mb(D44K/D60K/E85K) and Fe3+b5. Both mutants convert the complex from the DD regime exhibited by Mb(WT), in which the transient complex is in fast kinetic exchange with its partners, koff ≫ ket, to the slow-exchange regime, ket ≫ koff, and both mutants exhibit rapid intracomplex ET from the triplet excited state to Fe3+b5 (rate constant, ket ~ 106 s−1). The affinity constants of the mutant Mbs cannot be derived through conventional analysis procedures because intracomplex singlet ET quenching causes the triplet-ground absorbance difference to progressively decrease during a titration, but this effect has been incorporated into a new procedure for computing binding constants. Most importantly, these measurements reveal the presence of fast photo-induced singlet ET across the protein-protein interface, 1ket ≈ 2 × 10⁸ s−1.
INTRODUCTION
In muscle cells, myoglobin (Mb) is maintained in its reduced form by an electron transport system in which ferric cytochrome b5 (Fe3+b5) receives an electron from a cytochrome b5 reductase (b5) and subsequently transfers it to Mb that has become oxidized.1,2
| (1) |
This reaction, as well as with the analogous reduction of ferric hemoglobin, is of particular physiological importance, with mutations in the reductase system being accompanied by neurological and skeletal anomalies.3-5
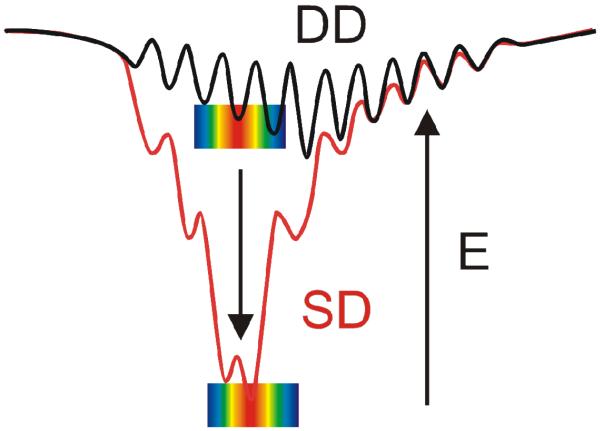
Mb and Fe3+b5 interact electrostatically to form a complex with low thermodynamic stability (Ka = 103 M−1).6,7 Studies of binding and electron transfer (ET) between them revealed that the ET partners react on a “Dynamic Docking” (DD) energy landscape (Fig 1),7-10 with binding and reactivity uncoupled: the weak binding involves an ensemble of nearly isoenergetic configurations; few conformations are reactive, and these contribute negligibly to binding. This contrasts sharply with high-affinity complexes, which react on a ‘simple docking’ (SD) energy landscape (Fig 1), with well-defined, stable and reactive binding configuration(s).
Fig 1.
Dynamic docking (DD) and simple docking (SD) energy landscapes.
Efforts to modulate the binding within high-affinity complexes of known structure11-17 have as an aim the understanding and control of protein-protein interactions, which are central to much of biology. To begin such efforts at the other interaction extreme with partner proteins that bind weakly, and altering them to create a highly reactive complex with a well-defined structure, offers a different type and degree of challenge. Nonetheless, our studies of the modulation of ET between Mb and Fe3+b5 on the DD landscape through mutations on the Mb surface8,18 have encouraged us to attempt to redesign the Mb surface so as to couple binding and reactivity with Fe3+b5 through conversion of their interactions to an SD landscape.
None of the strategies for protein interface re-design currently being used seemed appropriate for simultaneously enhancing both the binding and reactivity of a weakly-bound complex without a known structure.16,19 We therefore developed, and here describe, a strategy by which reactive binding of a weakly-bound, DD complex can be strengthened electrostatically through optimized placement of surface charges. The procedure employs paired Brownian Dynamics (BD) simulations, one which monitors overall binding, the other reactive binding, to examine [X → K] mutations on the surface of the basic protein partner, with a focus on single and multiple [D/E → K] charge reversal mutations.
The design strategy has been applied to the [Mb, b5] complex and evaluated through measurements of photoinitiated ET between Fe3+b5 and the Zn-substituted forms of Mb(WT) and optimized Mb variants: the Mb(D44K/D60K) double mutant with a nominal increase in charge of Δqnom = +4 relative to Mb(WT) (designated as Mb(+4)); and the Mb(D44K/D60K/E85K) triple mutant with Δqnom = +6 (Mb(+6)).20,10 These mutations: (i) convert the [Mb; Fe3+b5] complex from the fast-exchange regime characteristic of Mb(WT) to a complex in slow exchange with its components; (ii) increase the apparent rate constant for ET from the 3ZnP of the substituted Mb to Fe3+b5 by two orders of magnitude; (iii) reveal the first evidence for rapid (k > 108 s−1), intracomplex, photoinduced singlet ET across a protein-protein interface. A novel method of analyzing the results for BD simulations reveals that the conversion between ET kinetic regimes exhibited by Mb(WT), Mb(+4), and Mb(+6) reflects a progressively increasing correlation between binding and reactivity. It further relates this study to proposals that complex formation is a two-step process.14,15,21-27
MATERIALS AND METHODS
Expression, Purification and Characterization of Proteins
The tryptic fragment of Fe3+b5 (bovine) was isolated and purified as described previously.28,29 Horse-Mb(WT) was obtained from Sigma. The Mb(+4) and Mb(+6) mutants were constructed and purified, using slight modifications of previously described methods.9 For photoinitiated ET studies with Fe3+b5, the heme was removed from the Mb variants and they were reconstituted with Zn-deuteroporphyrin IX (Frontier Scientific) to generate the ZnDMb variants using established procedures.30 The resulting FeP and ZnD proteins were characterized by a variety of techniques, including mass spectrometry, CD, CO and O2 ligand rebinding, absorption and emission spectroscopy, and triplet decay. For details, see Supporting Information, Figs S1-S2.
Binding and Kinetics
Protein samples for spectroscopic and kinetic measurements were exchanged into working buffer (either 10 mM potassium phosphate buffered at pH 7 or 5 mM potassium phosphate buffered at pH 6) prior to the experiment as described previously.30
Triplet quenching and ligand rebinding measurements were performed with an LKS.60 laser flash photolysis spectrometer (Applied Photophysics). The ‘fast’ collection mode uses an Agilent Infiniium 600 MHz digitizer with a 5-stage photomultiplier tube as detector; the ‘slow’ configuration uses a modified stopped-flow setup (Applied Photophysics) for digitization with a 9-stage photomultiplier tube. As decay traces may span up to 6 orders of magnitude in time, we collected data in segments on short and long timescales, merged into a single file to obtain full progress curves for analysis. Short timescales are averages of 100 shots; long timescales are averages of 20 shots. Timecourses for the triplet state were collected at 475 nm, a maximum in the triplet-ground difference spectrum. Timecourses for CO/O2-rebinding were collected at 450 nm. All kinetic experiments were performed at 20°C.
Decays of the first excited triplet state for the ZnDMbs, determined from the time-resolved transient absorption signals collected near the absorbance maximum in the 3Zn-Zn difference spectrum (475 nm), are well-described by an exponential function. The decay constant,for Mb(WT) is kD = 50(± 5) s−1, as reported previously. 9,30 The triplet decay constants for the two mutants are slightly larger: kD(Mb(+4)) = 110(±15) s−1 and kD(Mb(+6)) = 135(± 65) s−1.
Computations
Brownian Dynamics (BD) computations of protein-protein docking profiles, ET rate constants, and electrostatic properties employed the Linux version of the MacroDox program31,32 obtained from Professor Kathyrn Thomasson. As in our previous studies,9 BD hit profiles were generated for two complementary reaction criteria: i) center-of-mass (COM) ‘binding’ criterion in which a ‘hit’ is tallied when the distance between the COM of the partners comes (roughly) within the sum of their radii, 39 Å; ii) carboxylate (O-O) ‘reactive’ criterion, which defines a hit as occurring when a trajectory leads to a short distance (≤ 4 Å) between one O of a Fe3+b5 heme carboxylate and one O of a Mb heme carboxylate. Coordinates for X → A and X → K mutants were generated using the mutate module of MacroDox. For details, see Supporting Information.
The HyPAREprogram33 developed by Schreiber and coworkers (http://bioportal.weizmann.ac.il/hypareb/main.) was used to calculate the enhancements in the association rate constants of a [Mb, b5] complex due to mutation of each residue to either a positively charged, negatively charged or neutral residue.
RESULTS
Mutant Design Procedure
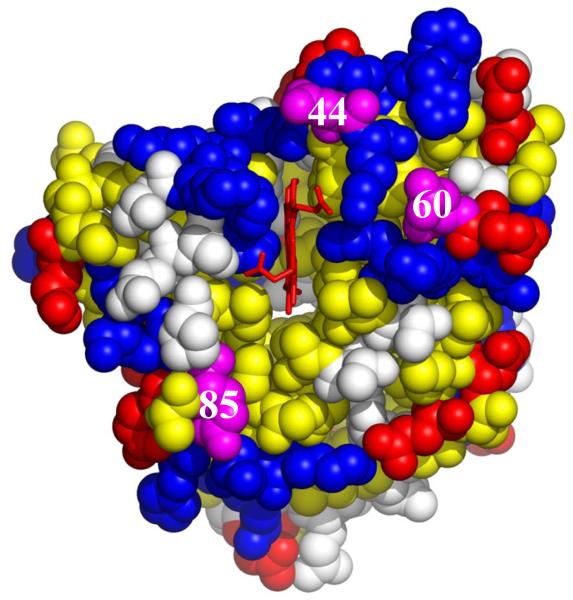
We surmised that the [Mb, b5] complex has low thermodynamic stability, and exhibits dynamic docking, with no single dominant bound configuration, at least in part because the reactive ‘front face’ of the Mb does not have a sufficient number of surface positive charges for electrostatic attraction to b5. Acidic residues surround the exposed heme edge of Fe3+b5, presenting a uniform, negative surface to Mb, whereas the exposed heme edge of Mb is surrounded by a patchwork of acidic residues, in particular Asp 44, Asp 60, and Glu 85, intermingled with the basic sites that provide favorable interactions with Fe3+b5 (Fig 2). To enhance both the binding strength and reactivity of a weakly-bound complex whose structure is unknown, we devised a strategy in which BD simulations are used to examine the effects of [X → K] mutations, primarily focusing on [D/E → K] charge reversal mutations. Once having identified mutation ‘hot spots’, variants with two or more of the most favorable charge reversals were examined.
Fig 2.
Crystal structure of oxidized Mb(horse) (PDB: 1ymb.pdb) showing the location of the charged surface residues (acidic residues; red; basic residues, blue), hydrophobic residues, yellow; and mutation sites, magenta.
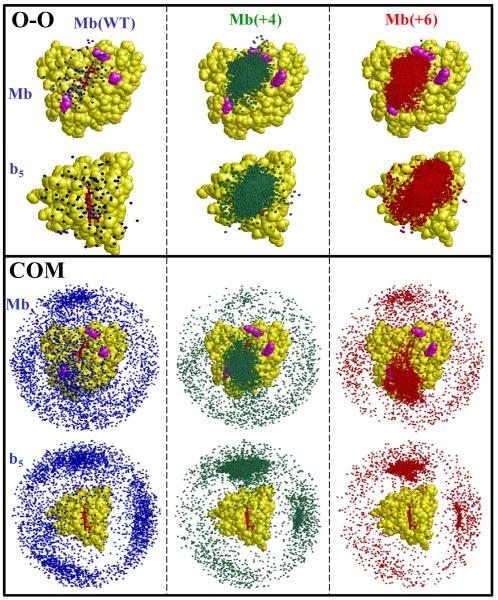
To quantify mutation-induced changes in reactive binding we employ pairs of Brownian Dynamics simulations, Fig 3. In one of the paired BD simulations, the center-of-mass (COM) distance is used as a criterion for a BD ‘hit’, giving an indication of the overall affinity of the partners. The parallel set of simulations where the distance between the heme propionates (O-O) is selected as the criterion provides an indication of reactive binding. For an individual Mb variant, the ratio of O-O to COM hits, R, gives an heuristic measure of the probability of a reactive hit, with R → 1 when every hit is reactive (‘perfect’ reactivity). Previously,8-10,30 we presented only BD profiles generated by mapping the COM of Fe3+b5 for each hit as a dot on a surface rendering of Mb. To this rendering we here add the reverse one, in which each hit is represented by a dot for the COM of Mb as mapped onto the surface of Fe3+b5.
Fig 3.
Spatial distribution of hits from paired BD simulations for Mb(WT), Mb(+4) and Mb(+6). The upper and lower panels show results with the O-O and COM reaction criteria, respectively. Within each panel, the same set of hits are displayed relative to Mb (upper) and Fe3+b5 (lower). Simulation conditions: pH 7, μ = 18 mM, 20°C.
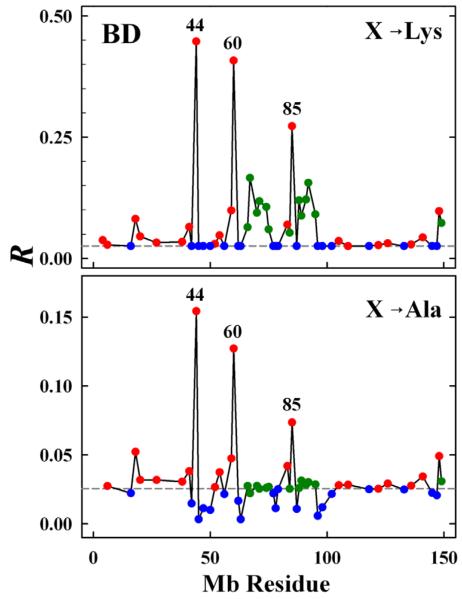
To apply this procedure to the interactions between Mb and Fe3+b5 we constructed structures for a broad sampling of [X → K] mutations of Mb surface residues, seeking those that would best enhance reactive binding – namely give the greatest increase in R. Focusing first on charge reversal, we examined all twenty-one surface D/E Mb sites (red symbols, Fig 4). To test the benefit of charge-reversal at strategically located sites, we tested the [N → K] mutations for thirteen uncharged (N) surface residues surrounding the Mb heme edge (green symbols, Fig 4) including two sites we have previously studied (Val 67 on the distal side of the heme and Ser 92 on its proximal side).8 Once having identified the most favorable sites for single mutations, we examined combinations of them, and in doing so devised a new method of visualizing the ensemble of hits generated in a BD simulation. Finally, we compared the results with those from a quite different strategy, implemented in the HyPARE program,33 using the structure of a pre-docked complex to examine the contribution of individual residues to protein binding.
Fig 4.
Hits ratio (R = hitsO-O/hitsCOM) from BD simulations as a function of residue position for X → K (upper) and X → A mutants (lower). Dashed line corresponds to R for Mb(WT). Symbol colors designate the type of residue: D/E (red); K (blue); neutral front-face residues (green).
BD Simulations with Mb(WT) and Mb Single mutants
As a baseline, Fig 3 compares the BD hit profiles, as viewed from the perspective of the Mb(WT), that were generated by paired simulations of 104 trajectories each, one using the COM criteria and the other using the O-O criteria for Mb(WT) reacting with Fe3+b5. The profiles from the COM criterion show ~ 4×10³ hits distributed over the entire surfaces of both partners. Some clustering is evident “above and to the left” of the heme edge, but there are few reactive hits near the heme edge, suggesting that there are not enough favorable electrostatic interactions to compensate for the repulsive interaction between the heme propionates of the two partners. The twenty most stable configurations for bound Fe3+b5 all occur in the Mb ‘upper left’ surface patch, but there is no preferred orientation of the Fe3+b5; the Fe3+b5 backbone atoms of these hits show no significant overlap (rmsd = 11.2 Å). Likewise, viewed from the perspective of the Fe3+b5 surface, the COM hits are widely distributed, predominantly away from its heme edge. In contrast, the BD profile generated with the ‘reactive’, O-O criterion has only ~ 102 hits, yielding a very low reactivity ratio, R ≈ 10−2, the signature for a protein pair that exhibits dynamic docking with low affinity. Furthermore, there is no preferred orientation of Fe3+b5 relative to the Mb face within the 20 most stable configurations derived with the O-O criterion.
The reactivity ratios, R, obtained from BD simulations for all the single mutations are presented in Fig 4. The three D/E residues identified by inspection (D44, D60 and E85), show the largest increases in R, to as high as R ~ 0.2 – 0.3. Residues at a greater distance from the Mb heme show proportionally smaller increases in R; of these, two residues lie over the proximal side of the Mb heme (E83 and E148), two residues are over its distal side (E18 and E59), and one is at the “top” (E41). Not surprisingly, D/E → K mutations of backside residues (D122, D126, and E52) show minimal increases in R.
The thirteen [X → K] mutations that introduce a single charge in place of a neutral front face residue (Δqnom = + 1) all show increases in R, although the increases are not nearly as large as those for the three [D/E → K] charge-reversal (Δqnom = + 2) mutants. This finding is striking, as two of the neutral front-face residues (V67 and S92) are much closer to the Mb heme than D44, D60 and E85. This suggests that the pattern of surface charges plays an important role in stabilizing the complex in its reactive geometry.
We compared the [X → K] procedure for enhancing reactive electrostatic binding in mutant proteins with the Ala scanning approach commonly used to identify surface residues that are important for either aiding or opposing binding in a complex. We used BD to examine all the [X → A] mutations of the acidic and neutral front-face residues of Mb(WT) just discussed. Not surprisingly, the Ala scanning and [X → K] approaches show the same patterns, although the effects are smaller with the Ala replacement approach, Both predict that the largest enhancements in reactive binding should result from abolishing the repulsive electrostatic interactions of D44, D60 and E85 with the negatively charged Fe3+b5.
The X→ A replacement method also allows us to assess the effects of surface lysine residues of Mb(WT) in stabilizing the complex, which is not possible when examining only [X → K] variants. Thus, BD simulations show that [X → A] mutations of the four Lys residues on the front face (K45, K63, K87, and K96) substantially decrease R, confirming that they contribute favorable interactions with Fe3+b5, whereas lysines on the back side of Mb contribute little. On the other hand, the [X → A] replacement approach misses the enhancements in R predicted for the addition of charge to uncharged residues near the heme face (green symbols). Thus, the combined use of [X → A] and [X → K] scans in BD simulations gives the best indication of those surface mutations that contribute to a protein-protein interaction and whose mutation would best enhance affinity and ET-reactivity.
Complementary strategy of [X → D/E] mutations of Fe3+b5
For completeness, we note a complementary procedure, the optimization of R through paired BD simulations with [X → D/E], in particular [K/R → D/E] charge-reversal, mutations of surface residues on the acidic protein. In the case of the the [Mb, b5] complex this strategy is inappropriate, as all the surface lysine, arginine and histidine residues of the acidic protein, b5, are distant from the heme face.
HyPARE Simulations
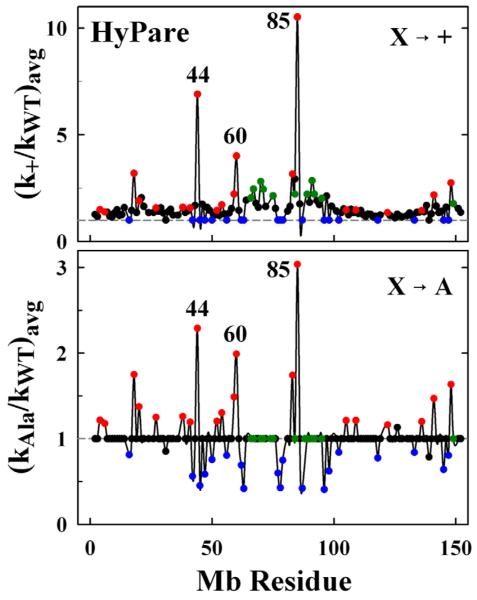
As an independent approach for identifying binding hot spots on the surface of Mb, we used the HyPARE program33 to calculate enhancements in association rate constants as a function of Mb mutation position. This program, which is designed to examine strongly-bound complexes, requires the crystal coordinates of a protein-protein complex of a known structure as input which it uses to identify residues that enhance or suppress the association of the partners through replacement with either a positively-charged residue (kon+), a negatively-charged residue (kon−) or an alanine residue (konA). The requirement of an input structure in general would preclude its use for complexes like [Mb, Fe3+b5], which bind weakly and have not been crystallized. However, as PATHWAYS calculations suggest that the a reactive [Mb, Fe3+b5] complex should have the hemes of the partners in close proximity,7 we have used the structures of the four hits with d(O-O) < 4 A generated by the COM simulation of Mb(WT) as representative models of the reactive complex for input into the HyPARE program.
The kon+ and konA enhancement factors computed for each of the four structures are shown in Fig S3 and the sequence-dependence of the configuration-averaged values of the enhancement ratios, (kon+)avg and (konA)avg are presented in Fig 5 for [X → +] and [X → A] Mb mutations. Here, positions where mutation would enhance association give kon > 1, whereas positions where mutation hinders association give kon < 1. HyPARE computes enhancement factors for both proteins, but since Fe3+b5 has a large net negative charge, changing a single charge has minimal effect on its association with Mb. Thus, we focus on the results for the [X → +] and [X → A] mutations of Mb.
Fig 5.
Rate enhancement ratios (kon/kWT) from HyPARE as a function of residue position for X → + (upper) and X →A (lower) mutations. Dashed line corresponds to ratio for Mb(WT). Symbol colors designate the type of residue: D/E (red); K (blue); neutral front-face residues (green); neutral residues not included in the BD profile (black).
As with BD, the [X → +] and [X → A] approaches are complementary. Insertion of a positive charge at one of the three front-face D/E residues that showed the largest R-values in the BD simulations also gave the largest values for both (kon+)avg and (konA)avg with HyPARE: (kon+)avg > 3.0 and (konA)avg > 2.0. However, six additional residues (E18, T70, E83, A84, Q91, and E148) on the Mb front face that gave large [X → +] enhancements failed to show significant [X → A] enhancements. Basic residues can be screened with the [X → A] approach to identify residues that stabilize the complex. Thus, five positively-charged residues (K45, K63, K78, K87 and K96) show large decreases in (konA)avg but no change in (kon+)avg.
Taken together, the results of the BD and HyPARE computations show that eliminating a negative charge on the front face of Mb by mutating residues D44, D60 and E85 either to K or A should increase reactive binding. When comparing the R-values for the front-face mutations having Δqnom = +2 and Δqnom = +1, the binding interface seems to encompass nearly all of the front face of Mb. A mapping of R-values onto a surface rendering of Mb resembles the ‘o-ring’ model of Bogan and Thorn,34 with the effect decreasing towards the periphery of the interface.
BD Simulations with Mb(+4) and Mb(+6) Mutants
Guided by the computations with the single mutants, we used MacroDox to build structural models for the three Mb charge-reversal mutants with Δqnom = +4 that can be created by pairwise mutation of the three acidic residues with large enhancements – Mb(D44K/D60K), Mb(D44K/E85K), and Mb(D60K/E85K) – along with the Mb(D44K/D60K/E85K) mutant with Δqnom = +6. Electrostatics computations with these structures respectively give as the net charges of Mb(WT), the three Mb(+4) mutants, and the Mb(+6) mutant: qnet = −0.5e, +3.2(1)e and +5.1e (pH 7, μ = 18 mM) (Table 1).
Table 1.
Electrostatic properties of Mb and Mb(X) mutants and summary of Brownian Dynamics docking simulations of their reaction with Fe3+b5.a
| Mb(X) | qnet (C) | Hits | ||
|---|---|---|---|---|
| pH 6 | pH 7 | O-O | COM | |
| WT | 3.0 | −0.3 | 107 | 4207 |
| +4 | - | 3.2 | 3680 | 5277 |
| +6 | - | 5.1 | 4718 | 5778 |
Net charges were obtained at μ = 18 mM, 20°C from a Tanford-Kirkwood calculation as implemented in MacroDox using atom parameters obtained with CHARMM.
The paired COM and O-O BD hit profiles for Mb(WT), Mb(+4), and Mb(+6) mutants are compared in Fig 3. The hits for the COM simulation show a progressive clustering near the solvent-exposed heme edge, while the hits for the O-O criterion increase in density and cover an increasingly smaller area of the front face. With the triple mutant, R = 0.81, approaching the limiting value of ‘perfect’ reactivity (R = 1) as would be observed for a complex that operates on an SD landscape with all configurations reactive. This is further supported by our finding that the twenty most stable configurations from the COM simulation for the Mb(+6) mutant indeed correspond to a single, well-defined structure (rmsd = 0.6 A).10
In the complementary presentation where the hits are plotted on a rendering of the Fe3+b5, (Fig 3) the density of the hits around the exposed heme edge of Fe3+b5 in the O-O simulations again increases progressively with qnet. Likewise, the hits in the COM simulations coalesce, but intriguingly, they seem to avoid the ring of D/E residues that surround the 6,7-propionate edge of the heme (residues E38, D40) and cluster instead near residue E48.
Photoinitiated ET at pH 6
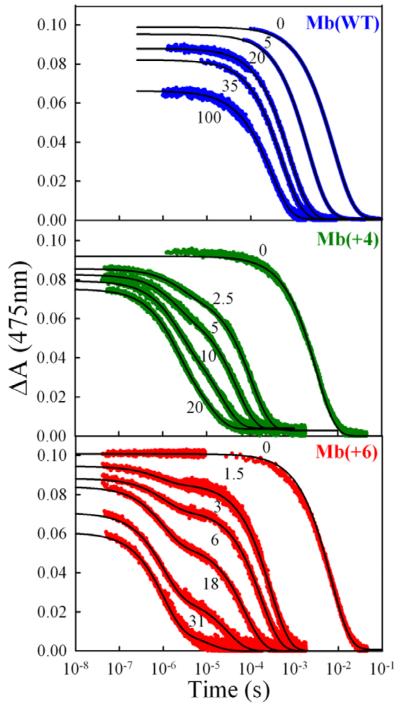
To experimentally test the predictions from the BD simulations, we studied photoinitiated ET between the Zn-deuteroporphyrin (ZnD)-reconstituted Mb(+4) and Mb(+6) mutant photodonors and the Fe3+b5 acceptor. The electron transfer between Mb and Fe3+b5 is optimal at low pH and low ionic strength,8,30 so we begin by discussing ET quenching at pH 6 (μ = 5.3 mM). Fig 6 compares a typical set of triplet decay traces for the Mb(WT) and the two Mb mutants obtained during titrations with Fe3+b5. In all three cases, Fe3+b5 quenches the triplet state by 3ZnD → Fe3+P electron transfer. The ET intermediate produced by this reaction is observable for the ZnMb(WT)30 and ZnMb(+4) complexes,18 but not for the ZnMb(+6) complex, which indicates that rapid back ET for this mutant prevents buildup of the intermediate to detectable levels.
Fig 6.
Triplet decay traces as a function of [Fe3+b5] for ZnMb(WT) (blue), ZnMb(+4) (green), and ZnMb(+6) (red). Conditions: 5 mM KPi, pH 6, 20°C, ~5 μM ZnMb.
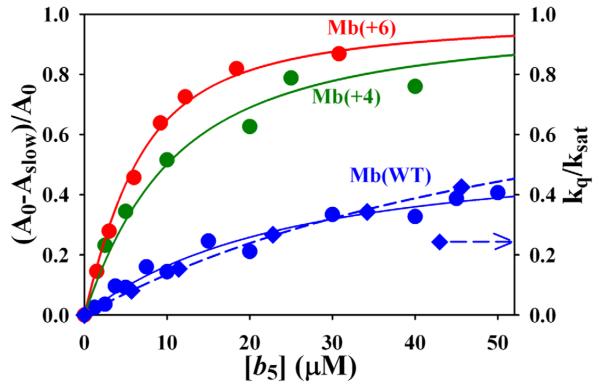
The traces for ZnMb(WT) remain exponential (rate constant for decay, kobs) during a titration with Fe3+b5, while the plot of the ET quenching constant, kq = kobs – kD, vs [Fe3+b5] has the form of a classical binding isotherm (Fig 7). These observations can be analyzed within the one-site binding model (Eq 2), where Ka = kon/koff and the intra-complex ET rate constant, ket, is in the limit where the complex is in fast exchange (FE) with its free components, koff ≫ ket, but
| (2) |
the thermodynamic affinity is now sufficient for saturation to occur. In this case, kq is described by Eq 3,
| (3) |
where f is the fraction of ZnMb bound to Fe3+b5 given by Eq 1.(Supporting Information) A fit of the titration curve for kq with this equation gives Ka = 1.7×10⁴M−1 and ket = 5.5×10³ s−1, (Table 2) the former being consistent with the results obtained previously by NMR6,35 and ITC7 at slightly higher ionic strength (μ = 11 mM).
Fig 7.
Zero-time 3ZnMb absorbance change as a function of [Fe3+b5] for the triplet decay traces in Fig 6, fit according to Eq 9 (solid lines, see text). Diamonds show the triplet decay rate constant as a function of [Fe3+b5]. Dashed line is a fit to the decay rates.
Table 2.
Kinetic parameters for the reactions of Mbs with Fe3+b5.a
| Mb(X) | pH 6 (μ = 5.3 mM) | pH 7 (μ = 18 mM) | ||||||
|---|---|---|---|---|---|---|---|---|
| ket (s−1) | k2 (M−1s−1) | Ka (M−1) | Φ ’ | ket (s−1) | k2 (M−1s−1) | Ka (M−1) | Φ ’ | |
| WT | 5.5 × 10³ | b | 4.8 × 10⁴ | 0.43 | - | 7.8 × 10⁶ | c | - |
| +4 | 5.0 × 10⁵ | 5.0 × 10⁹ | 8.3 × 10⁴ | 0.45 | 4.0 × 10⁵ | 1.0 × 10⁹ | 1.8 × 10⁴ | 0.45 |
| +6 | 1.0 × 10⁶ | 3.3 × 10⁹ | 2.1 × 10⁵ | 0.58 | 1.0 × 10⁶ | 2.5 × 10⁹ | 4.5 × 10⁴ | 0.77 |
Binding constants reported here were determined from δΔA as described in the text and are estimated to have uncertainties of ±20%. The estimated uncertainty in k2 is ±10%; uncertainties in ket are ±10% for Mb(WT) and Mb(+6) at pH 6 but ±40% otherwise. The uncertainties in ket are higher when the two kinetic phases (Fig 6) are not well-resolved.
In our recent JACS communication,10 the k2 we reported for pH 6 was actually the value for data at pH 7; the correct value of k2 at pH 6 is 5.3 × 10⁷ M−1s−1, determined from data below 50 μM Fe3+b5. Extending the concentration range to 100 μM Fe3+b5 revealed that the quenching rate approaches saturation to give ket = 5.5 × 10³ s−1 and Ka = 1.7 × 10⁴ M−1, in close agreement with the value determined from δΔA. Binding constants of 350 M−1 and 750 M−1 were determined for ZnMb(WT) using ITC7 and NMR,35 respectively at a slightly higher ionic strength, μ = 11 mM.
An upper bound of 103 M−1 can be estimated from the observed linearity of the titration at [Fe3+b5] < 100 μM.
The triplet decays during titrations of both mutants are bi-exponential, which indicates that they instead form complexes with Fe3+b5 that are in slow exchange (SE) with the free proteins. Rate constants for the fast (kf) and slow (ks) components were determined by fitting the triplet timecourse during titrations of the two mutant Mbs to a bi-exponential function (Eq 4),
| (4) |
where ΔA0 is the zero-time triplet-ground absorbance difference, g is the fraction of the faster kinetic phase, and (1-f) is the fraction of the slower process. The contribution, g, of the well-resolved fast component increases progressively with the addition of Fe3+b5 ; by [Fe3+ b5]/[Mb] ~5, the fast phase accounts for f ~80% of the observed ΔA for Mb(+6) (60% for Mb(+4)).
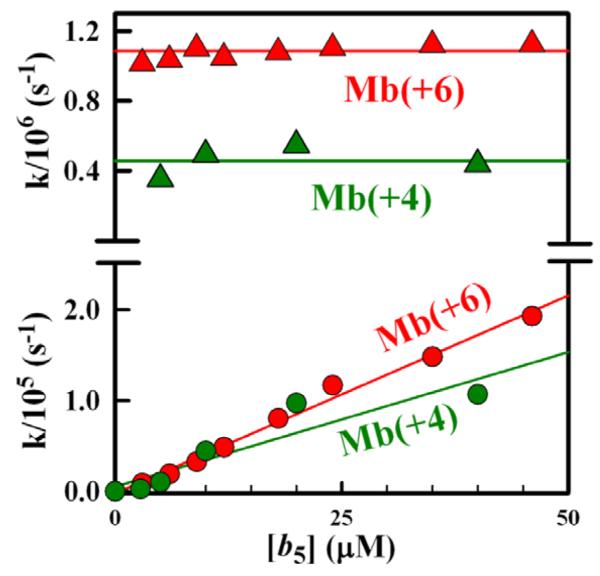
The rate constant for the slow process increases linearly with addition of Fe3+b5, ks = kq2 + kD = k2 [Fe3+b5] + kD, where kq2 is the pseudo-first-order decay constant associated with the bimolecular reaction between free ZnMb and Fe3+b5 (Fig 8). The slopes of these lines give bimolecular quenching rate constants, k2 ≈ 3-5×10⁹ M−1s−1 that approach the estimated diffusion limiting value, kdiff = 3×10⁹ M−1s−1.
Fig 8.
Bimolecular quenching constants (circles) and unimolecular rate constants (triangles) obtained from triplet traces (Fig 6) for titrations of ZnMb(+6) and ZnMb(+4) with Fe3+b5.
The quenching rate constant for the fast process, ket = kf - kD = 1×10⁶ s−1/6×10 s−1 for the Mb(+6)/Mb(+4) mutants, respectively, is invariant with [Fe3+b5] and is thus assigned to 3ZnD → Fe3+P ET within the [ZnMb, Fe3+b5] complexes.36
Binding constants at pH 6
The standard procedure for determining the binding constant of an ET complex that exhibits bi-exponential triplet decays is to assign the fraction of the intra-complex kinetic component (g in Eq 4) to the fraction of bound complex, f. Although g increases to a saturation value with addition of Fe3+b5, the absorbance difference associated with formation of 3ZnP measured by the extrapolated zero-time amplitude, ΔA0(Fe3+b5), clearly decreases during a titration (Fig 6). For Mb(WT), this decrease is ~30% at high concentrations of Fe3+b5, but it is quite substantial for mutants. These decreases are not attributable to dilution, which has been accounted for. Neither are they associated with protein degradation, as the full zero-time absorbance difference is restored by dissociating the complex through addition of 500 mM KCl (data not shown). Instead, they must be interpreted as a decrease in the effective quantum yield for triplet formation from the photo-excited singlet state within the bound complex. This in turn implies the presence of intra-complex ET quenching of the singlet state at a rate that competes with that for intersystem crossing, kisc ~ 2×10⁸ s−1! As a result of this loss of signal from the triplet state of the bound complex, the value of f determined by fitting a triplet decay to Eq 4 underestimates the actual fraction of Mb bound to Fe3+b5.
To accommodate this phenomenon we instead obtain the fraction of Mb bound in a complex, f (Fe3+b5), by analyzing this decrease in ΔA0(Fe3+b5) during a titration. Taking into account the differences in quantum yields for triplet formation in the free ZnMb (ϕisc) and in its ET-active complex with Fe3+b5 (Φisc’), the triplet-ground absorbance difference at the earliest times in a triplet decay trace during a titration, ΔA0(Fe3+b5), is described by Eq 5,
| (5) |
where ΔA0,trp is the absorbance difference for the ZnMb triplet state. The contributions of the free and bound forms to the actual zero-time triplet-state absorbance difference then are determined by their fractional occupancy as weighted by their respective yields according to Eq 6,
| (6) |
with ΔA0(0) and ΔA0(∞) corresponding to the zero-time triplet absorbance differences before the first addition of Fe3+b5 and at ‘infinite’ Fe3+b5 concentration, when all the ZnMb is bound in a complex. The fraction bound at a point in a titration can then be determined from δΔA0, the difference between ΔA0(Fe3+b5) at that point and ΔA0(0) for free ZnMb through use of Eq 7.
| (7) |
with
| (8) |
A fit of δΔA0 to the binding isotherm, f (Fe3+b5) in Eq 7 gives Ka and δΔA0max. As the quantum yield for triplet formation of free ZnMb is Φisc ~ 1, then Φisc’ can be estimated as,
An alternate, but perhaps less robust, version of this approach can be used when the triplet decays can be fit to two phases In this case one computes f from ΔA0(0) and the absorbance of either the slow or fast components (Eq 9):
| (9) |
When applied to the fast phase, it also yields an estimate for the value of Φ’; when applied to the slow phase it does not.
The values of δΔA0 obtained during titrations with each of the Mbs at pH 6 are plotted in Fig 7 and the binding constants obtained by fitting these data to Eq 7 are summarized in Table 2.37 Analysis of the titration of the mutants gives equivalent values for their affinity constants with both Eq 7 and Eq 9: Ka = 2-3 ×10⁵ M−1, Table 2. Analysis of the titration of ZnMb(WT) gives Ka = 4.8×10⁴ M−1, in reasonable agreement with the value obtained above by analyzing the saturation behavior of the triplet decay constant (Eq 3).
Triplet Quenching and Binding at pH 7
To explore the effects of pH and ionic strength, triplet binding titrations were carried out at pH 7 (μ = 18 mM), the condition used in the majority of our previous studies.8,18 The triplet timecourses during these titrations are shown in Fig S4 in Supporting Information and the rate constants and binding parameters resulting from them are summarized in Fig S5 and Table 2. As reported previously,38 quenching of the Mb(WT) triplet state by [Fe3+b5] is purely second order. In contrast to this behavior, and that of a series of Mb single mutants,8 the two multi-mutants react in the slow-exchange (SE) regime, although the two kinetic components are not as clearly resolved here as at pH 6. The intra-complex ET rate constants associated with the fast phase are ket = 1.0×10⁶ s−1/4.0 × 105 s−1 for Mb(+4)/Mb(+6) respectively, essentially the same as at pH 6; the second-order ET rate constants, k2 = 2.5×10⁹M−1s−1/1.0×109 M−1s−1 are slightly decreased in comparison to pH 6 (Table 2).
For the three Mbs, the absorbance at early times decreases during a titration, again indicating the presence of significant singlet quenching. For the mutants, the binding constants obtained by analysis of the absorbance changes with either Eq 7 or Eq 9 are decreased by ~10-fold compared to the values at pH 6 (Table 2). The absence of saturation in the quenching rate constant for Mb(WT) suggests that its affinity also is lower than at pH 6. However, δΔA0max and Ka are highly correlated so that it was not possible to reliably extract a value for Ka from the measured zero time absorbance changes; we can instead determine an upper limit, Ka < 103 M−1.
Even within the uncertainty for the affinity of the Mb(WT) at pH6, it is clear that the ratio of the binding affinities for both mutants, K(mutant)/K(WT), are highly pH-dependent(Table 2). This is understandable in terms of a binding free energy that is dominated by electrostatics, as there is a greater change in the net charge of Mb at pH 7 relative to that at pH6.
A Simple (One-Site) Model for Binding and Reactivity
A steady-state treatment of the simple one-site model for binding and intracomplex ET, Eq 2, can be used to interpret measured rate constants and affinities in terms of the intracomplex ET rate (ket) and the association/dissociation rate constants (kon/koff). For the two mutant Mbs, whose reactions with Fe3+b5 involve slow exchange (SE) between the complex and its unbound partners, the intracomplex ET rate constant is obtained directly from the fast decay process, ket = kf - kD.(Table 3) Application of the slow-exchange condition (koff < ket) to the steady-state expression (Eq 10) for the second-order process,
| (10) |
yields, k2 = kon, which when combined with the corresponding binding constant gives koff = k2/Ka. The [Mb(WT), Fe3+b5] complex instead is in FE with its components at both pHs. At pH 6, ket is obtained directly from the binding titration, but at pH 7 where binding saturation is not observed and triplet quenching is purely bimolecular, application of the FE condition (koff ≫ ket) to the steady-state expression (Eq 10) gives ket = k2/Ka. At both pHs, koff = kon/Ka can be determined from Ka by assuming that kon is given by the estimated diffusion-limiting rate, kdiff = 3.0×10⁹ s−1.
Table 3.
Derived kinetic parameters
| Mb(X) | pH 6 (μ = 5.3 mM) | pH 7 (μ = 18 mM) | ||||||
|---|---|---|---|---|---|---|---|---|
| Regime | koff (s−1) |
kon (M−1s−1) |
ket (s−1) |
Regime | koff (s−1) |
kon (M−1s−1) |
ket (s−1) |
|
| WT | FE | 6.2×10⁴ | ~3.0×10⁹ | 5.5×10³ | FE | ≥3.0×10⁶ | ~3.0×10⁹ | 7.8×10³ |
| +4 | SE | 6.0×10⁴ | 5.0×10⁹ | 5.0×10⁵ | SE | 5.5×10⁴ | 1.0×10⁹ | 4.0×10⁵ |
| +6 | SE | 1.6×10⁴ | 3.3×10⁹ | 1.0×10⁶ | SE | 5.5×10⁴ | 2.5×10⁹ | 1.0×10⁶ |
The resulting values, compiled in Table 3, show that the ET rates for both mutants are independent of pH, with ket(Mb(+6)) being slightly larger than ket(Mb(+4)). Surprisingly, application of this simple analysis to the data for pH 6 shows that the conversion from FE (koff ⪢ ket) to SE (koff ⪡ ket) by the mutations is accompanied by little to no change in koff. Instead, the transition apparently is associated with an increase in ket by more than two orders of magnitude. We discuss this analysis below.
DISCUSSION
Application of the design procedure presented here to the [Mb, b5] complex has identified the Mb surface sites where an [X → K] mutation maximizes R, the ratio of ‘reactive (O-O)’ hits to total (COM) hits in BD simulations. The D/E → K charge-reversal (Δqnom = +2) mutations of the acidic residues (red symbols, Fig 4) not surprisingly had larger effects on R than the thirteen charge-insertion (Δqnom = +1) mutations of uncharged residues surrounding the Mb heme edge (green symbols, Fig 4), in particular identifying the three acidic residues on the front face of Mb (D44, D60 and E85) as the most promising sites for mutation. BD simulations with the Mb(+4) and Mb(+6) triple charge-reversal mutations showed that R approached the limiting value, R → 1, with Mb(+6).
An alternative approach used HyPARE to compute association rate enhancements as a function of sequence position. As HyPARE cannot be used directly with weakly-bound complexes that do not have a known structure, four BD configurations with short heme-heme O-O distances were chosen as structural models for the [Mb, Fe3+b5] complex. This combined procedure identified the same three residues, Mb (D44, D60 and E85).
Change in Kinetic Regime
Whereas the [Mb(WT), b5] complex is in rapid kinetic exchange (koff ⪢ ket) with its components at pH 6 and 7, the mutants form complexes in the slow-exchange regime (koff ⪡ ket) at both pH values. However, analysis with the one-site binding model (Eq 2) indicates that the regime shift has different origins at the two pHs. At pH 7, as expected, the model indicates that replacement of three acidic front-face Mb residues with basic ones strongly lowers the dissociation rate constant, thereby inverting the inequality, koff ≫ ket, to its opposite sense, koff << ket. In contrast, at pH 6 the model implies that the inequality inversion that accompanies the transition from FE to SE instead is driven by a large increase in ket (Table 3).
Although this one-site picture provides a useful, heuristic description of the data that contributes to an understanding of the nature of the FE → SE transition, it is based on the idea that there is a single bound configuration. However, in this model, mutation-induced changes in binding must come from changes in formation/dissociation rate constants. Instead, the analysis indicates that the change in kinetic regimes is arrived at through an increase in ket, which could only derive from a mutation-induced change in the structure of the complex. Thus, application of the simple kinetic model is not internally consistent. The BD hit profiles (Fig 3), instead reveal that the reaction of Mb(WT) with Fe3+b5 involves numerous, mostly unreactive, bound conformations that undergo dynamic docking, and that the multiple charge-reversal mutations preferentially enhance binding in configurations that are highly reactive.
A mathematical description of the shift in kinetic regimes in terms of a conversion among sub-ensembles of bound conformations is beyond the scope of the present work. However, we note a related phenomenological description of regime shifting recently was introduced in the analysis of the kinetics for the reaction of cytochrome c2 with a series of X→A interface mutants involving hydrophobic sites on the photosynthetic reaction center (RC) surface39 That approach has been extended and further applied to the observation that properties of [RC, c2] ET complexes in the FE regime are strongly dependent on ionic strength, whereas those in the SE regime are less so.40 We suggest that the ionic strength dependence behavior can in fact be used to differentiate between regimes.
Mutation-Induced Changes in the Conformational Profile of Fe3+b5 Binding to Mb
To illuminate the actual influence of Mb surface-charge reversal mutations on binding and reactivity between Fe3+b5 and Mb, we return to the hit profiles generated from BD simulations with the three complexes (Fig 3) and display them as contour plots (Fig 9) showing the distribution of hits as functions of two variables: (i) a ‘binding parameter’- the calculated potential energy of stabilization for a configuration, V; (ii) a ‘reactivity parameter’ - the Fe-Fe distance in that same configuration, dFe-Fe.
Fig 9.
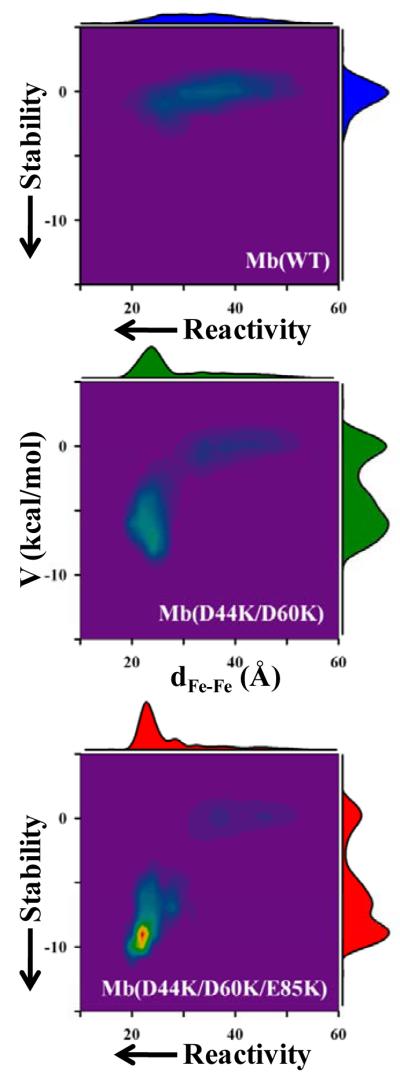
Contour plots of the electrostatic potential energy (V) and Fe-Fe separation (dFe-Fe) for each hit from the BD simulation profiles(COM reaction criterion) of Mb(WT) (top), Mb(+4) (middle) and Mb(+6) (bottom). Contours were generated by binning hits with intervals: dFe-Fe = 2 Å; V = 0.5 kcal/mol. Border plots represent the total number of hits in a given slice through the contour. The plots along the dFe-Fe axis are normalized to the total number of hits for Mb(WT), 2000 hits; those for V are normalized to unity.
For the [Mb(WT), Fe3+b5] complex, the hits form a diffuse ‘cluster’ in which the electrostatic potential energy of attraction, V, on average is ~ 0, ranging from +1.6 kcal/mol to −4.6 kcal/mol; the hits are distributed over the Mb surface, and overwhelmingly exhibit negligible reactivity, with a wide range in dFe-Fe and no pronounced peak in probability within the cluster. This plot thus provides a striking visualization of the DD paradigm, with the ensemble of Mb(WT) configurations showing weak binding of Fe3+b5 over the entire hemisphere encompassing the heme-exposed front-face of Mb. The absence of a well-defined peak in the probability versus dFe-Fe corresponds to the absence of a well-defined ‘structure’, or ensemble of related structures, for the complex; highly reactive configurations (those with dFe-Fe < 20 Å) are rare and the mean Fe-Fe separation in these structures is long (33.6 Å). Consistent with this picture, the chemical shift perturbations measured for the [Mb(WT, cyt b5] complex are quite small, {Worrall, 2002 #6687} as is typical for transient complexes.{Prudencio, 2004 #8282}
In contrast, the hits for each of the mutants partition into two ‘clusters’ with very different stabilities and reactivities, corresponding to two major types/average structures for the complex. A low-stability, ‘diffuse’ cluster resembles the Mb(WT) cluster, with mean V ~ 0 kcal/mol and a large range of dFe-Fe. However, the change of repulsive electrostatic interactions into more favorable ones by the charge-reversal mutations has created a second, high-affinity cluster of conformations with an attractive mean potential energy, V ~ −6-8 kcal/mol, and a narrow range of short Fe-Fe separations. Considering the three Mbs, the number of hits within the high-affinity cluster progressively increases with increasing charge on the Mb. In particular, for Mb(+4), the hits are distributed almost equally among the two clusters (63% have V > −3 kcal/mol), whereas for Mb(+6) the majority of the hits belong to the high affinity cluster (80% have V > −3 kcal/mol). Overall, as the front-face charge on Mb increases the contour plots reveal a progressive shift towards an increasing population of bound structures with higher reactivity. If the contours in the 2D plots of Fig 9 are further Boltzmann-weighted by V, one finds that the complexes for both mutants exhibit well-defined sub-ensembles of thermodynamically most-probable configurations. It is this aspect of the phenomenon that the one-site model captures. However, there are numerous configurations that are equally probable, and to give a sense of the distribution of structures associated with these configurations, the hemes of four representative members of the sub-ensembles for Mb(+4) and Mb(+6), are presented in Fig 10; in each case the configurations differ at most by ΔV = ±0.125 kcal/mol and ΔdFe-Fe = ±0.125 Å around the most probable values, which are listed in the figure legend. Intriguingly, the two sets of configurations lie at quite different locations on the Mb surface, one at ‘one o’clock’ and the other at ‘seven o’clock’ relative to the Mb heme. The four b5 configurations for Mb(+4) nonetheless show a clear distribution in orientations, and thus the complex has not reached a well-defined binding structure; the four b5 hemes are more closely aligned for Mb(+6), but still do not precisely overlay.
Fig 10.
Fe3+b5 hemes for representative configurations in the vicinity of the thermodynamically most probable configuration for each Mb mutant, as defined by Boltzmann weighting the contour plots of Fig 9 with V. For the Mb(+4) complex (b5 hemes in green), that point is [V, dFe-Fe] =[−8.4 kcal/mol, 23.6 Å]; for Mb(+6) (hemes in red), [V, dFe-Fe] = [−9.9 kcal/mol, 20.4 Å]. The Mb heme is shown in white. Note, the locations of the b5 hemes for Mb(+6) differ somewhat from shown before for the most-stable configurations, which are not highly probable.
The visualization in Fig 9 of the mutation-induced modulation of the spatial distribution of structures adopted by the complex can be discussed in terms of recent work in which the association between protein partners is viewed as a two-step process: initial formation of a weakly-bound ‘encounter complex’ with an ill-defined structure, which may then convert to a tightly-bound complex with well-defined structure.14,21,24-27,41 The diffuse cluster of configurations seen in the BD simulations (Fig 9) is plausibly associated with the encounter complex. Viewed in this way, the Mb(WT) exhibits only an encounter complex, while the Mb mutations introduce and progressively stabilize an additional ensemble of structures, with greater thermodynamic stability and greater average reactivity, which can be identified with ‘the’ static structure discussed by others.42 This suggestion will be examined at a later date.
Intra-complex Singlet ET
The decreased yield of 3ZnDMb upon laser photolysis of the [ZnDMb, Fe3+b5] complexes (Φisc in Table 2) indicates that intracomplex ET is occurring on the singlet timescale, with rate constant (1ket) that is competitive with the 1ZnP → 3ZnP inter-system crossing rate (1kD). Taking 1kD = 2.0×10⁸ s−1, the reduced triplet-state yields at pH 6 (and pH 7) predict an exceptionally high rate constant for all three Mbs:1ket ≈ 2 ×10⁸s−1!
To our knowledge, there is only one prior example of photo-induced singlet ET across a protein-protein interface. As in the present study, both the singlet and triplet excited states of Zn-substituted cytochrome c are quenched in the presence of oxidized cytochrome c oxidase {Brzezinski 1995}{Winkler, 1995 #9875}: 1ket ~ 5.7×10⁸ s−1; 3ket ~ 2×10⁵ s−1.
Furthermore, the required rate is only ~ 10-100-fold less than those for the primary ET reactions of photosynthesis, which occur within, the photosynthetic units of cyanobacteria, algae, and plants,43,44 and is comparable to the rates reported for the 1ZnP → Q ET quenching of ZnP-reconstituted-Mbs by small molecules (e.g., Q = methyl viologens, quinones) that are either covalently-attached to the modified porphyrin macrocycle45 or that interact by forming weak, non-covalent complexes with the reconstituted macrocycle.46 Likewise, an engineered form of cytochrome b562 in which a quinone binding site was incorporated in close proximity to a Zn-chlorin macrocycle has 1ket ~ 108 s−1.47
SUMMARY
We have described a strategy by which reactive binding of a weakly-bound complex without a known structure can be strengthened electrostatically. The procedure employs paired BD simulations, one which monitors overall binding, the other reactive binding, to determine the most favorable [X → K] mutations on the surface of the basic partner, with a focus on single and multiple [D/E → K] charge reversal mutations. Application of this procedure to the weakly-bound, ‘dynamically docked’ [Mb, Fe3+b5] pair identifies three residues on the front face of Mb where [D/E → K] mutations should stabilize the complex in reactive configuration(s). This strategy has been tested and validated through the study of photoinitiated ET between the Zn-substituted Mbs and Fe3+b5.
Both mutants convert the complex from the DD regime, in which the partners are in fast kinetic fast-exchange with a transient bound form, koff ≫ ket, to the slow-exchange regime where ket ≫ koff. Despite this qualitative change in kinetic regimes, the affinity constant and the effective koff determined within a one-site binding model are not greatly changed; rather the mutations appear to have greatly increased the triplet ET rate constant. This analysis is best understood through examination of the BD hit profiles (Fig 3), which reveal that the reaction of Mb(WT) with Fe3+b5 involves numerous, mostly unreactive, bound conformations, and that the mutations preferentially stabilize reactive binding with short heme-heme distances. Representation of the binding BD profiles by a histogram whose independent variables are the binding energy and an ET distance parameter (Fig 9) in fact reveals a coalescence of the binding conformations into two ‘clusters’, one with reactive and relatively stable conformations, one with conformations that are neither. This correlates well with recent proposals that complex formation is a two-step process, proceeding through the formation of a weakly-bound encounter (non-reactive) complex to a well-defined, bound (reactive) complex. It further illustrates how the DD regime constitutes one limit of such processes, and clarifies how progressive strengthening of the protein-protein interactions can smoothly convert a complex from one extreme (DD) to the other (SD).
In the complexes exhibiting SE, the affinity constants could not be derived from the conventional treatment because the intracomplex triplet-ground absorbance difference was decreased from that for free ZnMb by complex formation. This change was incorporated in a novel procedure for computing binding constants. Most importantly, this decrease implies the presence of intracomplex photo-induced singlet ET reaction occurring across a protein-protein interface. The required rate, 1ket ≈ 2 × 10⁸ s−1 is only ~ 10-100-fold less than those for the primary ET reactions that occur within the photosynthetic units of cyanobacteria, algae, and plants.
Supplementary Material
ACKNOWLEDGMENT
We gratefully acknowledge NIH funding for this work (HL063203 and GM008382), the Keck Facility for use of the CD spectrometer and IMSERC for mass spectra (State of Illinois Funding Source for MS).
Footnotes
SUPPORTING INFORMATION: Experimental procedures and protein characterization (Fig S1, S2); HyPARE simulation results for four model structures from a BD simulation with Mb(WT) (Fig S3); triplet decay traces the corresponding fit parameters at pH 7 (Fig S4,5); and contact frequency maps from BD simulations (Fig S6). This material is available free of charge via the Internet at http://pubs.acs.org.
REFERENCES
- (1).Hagler L, Coppes RI, Jr., Herman RH. J. Biol. Chem. 1979;254:6505–6514. [PubMed] [Google Scholar]
- (2).Bekhit AED, Faustman C. Meat Sci. 2005;71:407–439. doi: 10.1016/j.meatsci.2005.04.032. [DOI] [PubMed] [Google Scholar]
- (3).Percy MJ, Lappin TR. British Journal of Haematology. 2008;141:298–308. doi: 10.1111/j.1365-2141.2008.07017.x. [DOI] [PubMed] [Google Scholar]
- (4).Fermo E, Bianchi P, Vercellati C, Marcello AP, Garatti M, Marangoni O, Barcellini W, Zanella A. Blood Cells, Mol., Dis. 2008;41:50–55. doi: 10.1016/j.bcmd.2008.02.002. [DOI] [PubMed] [Google Scholar]
- (5).Ewenczyk C, Leroux A, Roubergue A, Laugel V, Afenjar A, Saudubray JM, Beauvais P, Billette de Villemeur T, Vidailhet M, Roze E. Brain. 2008;131:760–761. doi: 10.1093/brain/awm337. [DOI] [PubMed] [Google Scholar]
- (6).Worrall JAR, Liu Y, Crowley PB, Nocek J, Hoffman BM, Ubbink M. Biochemistry. 2002;41:11721–11730. doi: 10.1021/bi026296y. [DOI] [PubMed] [Google Scholar]
- (7).Liang Z-X, Nocek J, Huang K, Hayes RT, Kurnikov IV, Beratan DN, Hoffman BM. J. Am. Chem. Soc. 2002;124:6849–6859. doi: 10.1021/ja0127032. [DOI] [PubMed] [Google Scholar]
- (8).Liang Z-X, Kurnikov IV, Nocek JM, Mauk AG, Beratan DN, Hoffman BM. J. Am. Chem. Soc. 2004;126:2785–2798. doi: 10.1021/ja038163l. [DOI] [PubMed] [Google Scholar]
- (9).Wheeler KE, Nocek J, Cull DA, Yatsunyk LA, Rosenzweig AC, Hoffman BM. J. Am. Chem. Soc. 2007;129:3906–3917. doi: 10.1021/ja067598g. [DOI] [PubMed] [Google Scholar]
- (10).Xiong P, Nocek JM, Griffin AKK, Wang J, Hoffman BM. J. Am. Chem. Soc. 2009;131:6938–6939. doi: 10.1021/ja902131d. [DOI] [PMC free article] [PubMed] [Google Scholar]
- (11).Tetreault M, Cusanovich M, Meyer T, Axelrod H, Okamura MY. Biochemistry. 2002;41:5807–5815. doi: 10.1021/bi012053e. [DOI] [PubMed] [Google Scholar]
- (12).Selzer T, Albeck S, Schreiber G. Nat. Struct. Biol. 2000;7:537–541. doi: 10.1038/76744. [DOI] [PubMed] [Google Scholar]
- (13).Ivkovic-Jensen MM, Ullmann GM, Young S, Hansson O, Crnogorac MM, Ejdebaeck M, Kostic NM. Biochemistry. 1998;37:9557–9569. doi: 10.1021/bi9802871. [DOI] [PubMed] [Google Scholar]
- (14).Schreiber G, Haran G, Zhou H-X. Chem. Rev. Vol. 109. Washington, DC, U. S.: 2009. pp. 839–860. [DOI] [PMC free article] [PubMed] [Google Scholar]
- (15).Harel M, Spaar A, Schreiber G. Biophys. J. 2009;96:4237–4248. doi: 10.1016/j.bpj.2009.02.054. [DOI] [PMC free article] [PubMed] [Google Scholar]
- (16).Pearl NM, Jacobson T, Meyen C, Clementz AG, Ok EY, Choi E, Wilson K, Vitello LB, Erman JE. Biochemistry. 2008;47:2766–2775. doi: 10.1021/bi702271r. [DOI] [PubMed] [Google Scholar]
- (17).Davidson VL. Acc. Chem. Res. 2008;41:730–738. doi: 10.1021/ar700252c. [DOI] [PMC free article] [PubMed] [Google Scholar]
- (18).Hoffman BM, Celis LM, Cull DA, Patel AD, Seifert JL, Wheeler KE, Wang J, Yao J, Kurnikov IV, Nocek J. PNAS. 2005;102:3564–3569. doi: 10.1073/pnas.0408767102. [DOI] [PMC free article] [PubMed] [Google Scholar]
- (19).Guerois R, Nielsen JE, Serrano L. J. Mol. Biol. 2002;320:369–387. doi: 10.1016/S0022-2836(02)00442-4. [DOI] [PubMed] [Google Scholar]
- (20).Xiong JACS. 2009 For initial results, see. coworkers. [Google Scholar]
- (21).Ubbink M. FEBS Lett. 2009;583:1060–1066. doi: 10.1016/j.febslet.2009.02.046. [DOI] [PubMed] [Google Scholar]
- (22).Crowley PB, Ubbink M. Acc. Chem. Res. 2003;36:723–730. doi: 10.1021/ar0200955. [DOI] [PubMed] [Google Scholar]
- (23).Miyashita O, Onuchic JN, Okamura MY. Proc. Natl. Acad. Sci. U. S. A. 2004;101:16174–16179. doi: 10.1073/pnas.0405745101. [DOI] [PMC free article] [PubMed] [Google Scholar]
- (24).Boehr DD, Nussinov R, Wright PE. Nat. Chem. Biol. 2009;5:789–796. doi: 10.1038/nchembio.232. [DOI] [PMC free article] [PubMed] [Google Scholar]
- (25).Clore GM, Iwahara J. Chem. Rev. Vol. 109. Washington, DC, U. S.: 2009. pp. 4108–4139. [DOI] [PMC free article] [PubMed] [Google Scholar]
- (26).Tang C, Ghirlando R, Clore GM. J. Am. Chem. Soc. 2008;130:4048–4056. doi: 10.1021/ja710493m. [DOI] [PubMed] [Google Scholar]
- (27).Clore GM. Mol. BioSyst. 2008;4:1058–1069. doi: 10.1039/b810232e. [DOI] [PMC free article] [PubMed] [Google Scholar]
- (28).Lloyd E, Ferrer JC, Funk WD, Mauk MR, Mauk AG. Biochemistry. 1994;33:11432–11437. doi: 10.1021/bi00204a005. [DOI] [PubMed] [Google Scholar]
- (29).Funk WD, Lo TP, Mauk MR, Brayer GD, MacGillivray RTA, Mauk AG. Biochemistry. 1990;29:5500–5508. doi: 10.1021/bi00475a013. [DOI] [PubMed] [Google Scholar]
- (30).Nocek JM, Sishta BP, Cameron JC, Mauk AG, Hoffman BM. J. Am. Chem. Soc. 1997;119:2146–2155. [Google Scholar]
- (31).Northrup SH, Thomasson KA, Miller CM, Barker PD, Eltis LD, Guillemette JG, Inglis SC, Mauk AG. Biochemistry. 1993;32:6613–6623. doi: 10.1021/bi00077a014. [DOI] [PubMed] [Google Scholar]
- (32).Northrup SH, Boles JO, Reynolds JCL. Science. 1988;241:67–70. doi: 10.1126/science.2838904. [DOI] [PubMed] [Google Scholar]
- (33).Shaul Y, Schreiber G. Proteins: Struct., Funct., Bioinf. 2005;60:341–352. doi: 10.1002/prot.20489. [DOI] [PubMed] [Google Scholar]
- (34).Bogan AA, Thorn KS. J. Mol. Biol. 1998;280:1–9. doi: 10.1006/jmbi.1998.1843. [DOI] [PubMed] [Google Scholar]
- (35).Liang Z-X, Jiang M, Ning Q, Hoffman BM. JBIC. 2002;7:580–588. doi: 10.1007/s00775-001-0332-0. [DOI] [PubMed] [Google Scholar]
- (36).Preliminary experiments show that the fast component varies as a function of viscosity, suggesting that this rate constant is associated with conformational gating of ET.
- (37).For Mb(WT), there is a measurable absorbance drop, but only a single kinetic phase, so δΔA0 = ΔA0,slow(Fe3+b5) and analyses with Eqs 7, 9 are mathematically identical.
- (38).Liang Z-X. Chemistry. Northwestern University; Evanston: 2001. [Google Scholar]
- (39).Gong X-M, Paddock ML, Okamura MY. Biochemistry. 2003;42:14492–14500. doi: 10.1021/bi035603c. [DOI] [PubMed] [Google Scholar]
- (40).Abresch EC, Gong X-M, Paddock ML, Okamura MY. Biochemistry. 2009;48:11390–11398. doi: 10.1021/bi901332t. [DOI] [PMC free article] [PubMed] [Google Scholar]
- (41).Tang C, Iwahara J, Clore GM. Nature. Vol. 444. London, U. K.: 2006. pp. 383–386. [DOI] [PubMed] [Google Scholar]
- (42).An alternative, more detailed presentation of the progressive change in docked structures with increased Mb front-face positive charge is obtained by following the changes in the frequency with which a specific residue on Mb or Fe3+b5 appears among the ten shortest interfacial contacts for the ensemble of BD hit configurations, Fig S6.
- (43).Zinth W, Wachtveitl J. ChemPhysChem. 2005;6:871–880. doi: 10.1002/cphc.200400458. [DOI] [PubMed] [Google Scholar]
- (44).Noy D, Moser CC, Dutton PL. Biochim. Biophys. Acta, Bioenerg. 2006;1757:90–105. doi: 10.1016/j.bbabio.2005.11.010. [DOI] [PubMed] [Google Scholar]
- (45).Hayashi T, Takimura T, Ohara T, Hitomi Y, Ogoshi H. J. Chem. Soc., Chem. Commun. 1995:2503–2504. [Google Scholar]
- (46).Hayashi T, Takimura T, Ogoshi H. J. Am. Chem. Soc. 1995;117:11606–11607. [Google Scholar]
- (47).Hay S, Wallace BB, Smith TA, Ghiggino KP, Wydrzynski T. Proc. Natl. Acad. Sci. U. S. A. 2004;101:17675–17680. doi: 10.1073/pnas.0406192101. [DOI] [PMC free article] [PubMed] [Google Scholar]
Associated Data
This section collects any data citations, data availability statements, or supplementary materials included in this article.


