Abstract
We describe a technique that uses spatially modulated near-infrared (NIR) illumination to detect and map changes in both optical properties (absorption and reduced scattering parameters) and tissue composition (oxy- and deoxyhemoglobin, total hemoglobin, and oxygen saturation) during acute ischemic injury in the rat barrel cortex. Cerebral ischemia is induced using an open vascular occlusion technique of the middle cerebral artery (MCA). Diffuse reflected NIR light (680 to 980 nm) from the left parietal somatosensory cortex is detected by a CCD camera before and after MCA occlusion. Monte Carlo simulations are used to analyze the spatial frequency dependence of the reflected light to predict spatiotemporal changes in the distribution of tissue absorption and scattering properties in the brain. Experimental results from seven rats show a 17±4.7% increase in tissue concentration of deoxyhemoglobin and a 45±3.1, 23±5.4, and 21±2.2% decrease in oxyhemoglobin, total hemoglobin concentration and cerebral tissue oxygen saturation levels, respectively, 45 min following induction of cerebral ischemia. An ischemic index (Iisch=ctHHb/ctO2Hb) reveals an average of more then twofold contrast after MCAo. The wavelength-dependence of the reduced scattering (i.e., scatter power) decreased by 35±10.3% after MCA occlusion. Compared to conventional CCD-based intrinsic signal optical imaging (ISOI), the use of structured illumination and model-based analysis allows for generation of separate maps of light absorption and scattering properties as well as tissue hemoglobin concentration. This potentially provides a powerful approach for quantitative monitoring and imaging of neurophysiology and metabolism with high spatiotemporal resolution.
Keywords: stroke, brain ischemia, structured light, tissue optical properties, diffuse optical imaging, cerebral hemodynamics
1 Introduction
Stroke occurs when arteries supplying blood to the brain burst (hemorrhagic stroke) or are obstructed1 (ischemic stroke). About 90% of all strokes are ischemic, occurring from occlusion of one of the main arteries supplying the brain. Under these conditions brain cells undergo a series of pathophysiologic changes, but ultimately die from lack of oxygen supply.2 Cerebral ischemia results in changes in regional concentrations of oxyhemoglobin, deoxyhemoglobin, and water.3 Because these molecules absorb specific wavelengths of light, ischemia alters the optical properties of brain tissue. Since the most commonly involved artery in ischemic strokes is the middle cerebral artery (MCA) we chose to focus our experiments on MCA occlusion4,5 (MCAo).
Several groups have studied brain response during cerebral ischemia using optical imaging methods. Common to them is the observation of changes in cerebral hemodynamic parameters after ischemia. Wolf et al. used near infrared spectroscopy (NIRS) to show a decrease in oxyhemoglobin and an increase in deoxyhemoglobin during focal cerebral ischemia in rats.6 Culver et al. demonstrated7 in an intact skull rat model that tissue hemoglobin saturation values drop by 11±4% from baseline during MCAo. Similar results have been reported in mouse8 and piglet models9 as well as in humans10 during neurosurgery. In the latest study, patients with ischemic events experience decreases in oxyhemoglobin, total hemoglobin, and brain tissue oxygen saturation levels of 42, 18, and 25%, respectively, from baseline, whereas an increase of 20% from baseline in deoxyhemoglobin was observed.
Although the preceding examples clearly demonstrate physiological changes following MCA occlusion, significant challenges remain to provide quantitative spatiotemporal maps of cortical absorption and scattering. This would enable us to more accurately assess hemodynamic and metabolic changes from different regions of the brain and ultimately gain a more complete understanding of stroke physiology. Consequently, in this paper we introduce a noncontact and scan-free approach based on spatial light modulation to detect and map tissue chromophore changes in the brain during cerebral ischemia.
In this method, periodic near-IR (NIR) illumination patterns with different spatial frequencies are projected on the rat cortex during ischemic stroke. A CCD camera captures the diffusely reflected light and Monte Carlo solutions are used as model functions in an inversion algorithm for determining optical properties. Measurements of the changes in absorption in the NIR spectral region and the knowledge of the molar extinction coefficients of individual chromophores, enables us to quantify changes in oxyhemoglobin (ctO2Hb), deoxyhe-moglobin (ctHHb) total hemoglobin concentration (ctTHb=ctO2Hb+ctHHb), and oxygen saturation [stO2=100×(ctO2Hb/ctTHb)]. Observations from this study indicate that in addition to significant changes in ctO2Hb, ctTHb, and stO2 during cerebral ischemia, as described in other studies,7-10 spatial frequency modulation analysis reveals alterations in cortical scattering that are consistent with is-chemically induced processes such as cellular swelling and tissue edema.
2 Materials and Methods
2.1 Animal Model
We examined the effects of occlusion of MCA in seven rats. Animal housing, care, and experimental protocols were carried out in conformity with the guidelines of the U.S. National Institutes of Health. The laboratory animal protocol for this work was approved by the Institutional Animal Care and Use Committee (IACUC) at the University of California, Irvine (protocol no. 2006-2671) and by the U.S. Department of Defense (DoD).
Seven adult male Sprague-Dawley rats (Charles River Laboratories, Wilmington, Massachusetts) weighing between 350 and 400 g were deeply anesthetized by using barbiturate anesthesia [sodium pentobarbital 55 mg/kg initial dose intraperitoneal (ip), 2 mg/kg ip supplements as needed to maintain anesthesia] and their heads were fixed on a stereotactic apparatus. To decrease respiratory secretions and possibility of syncopal attacks, atropine (0.1 mg/kg) was injected imtra-muscularly, immediately prior to making a surgical incision and injected every 6 h. To prevent dehydration, 5 cc of normal saline was injected subcutaneously on the back of the animal prior to surgical incision. To prevent hypothermia temperature was kept constant by a using a rectal thermometer that is connected to an electric heating pad (model 50-7053-F, Harvard Appartures, Holliston, Massachusetts) by a feedback mechanism, maintaining body temperature at 37±0.5° during the entire experiment. Throughout the experiment, a surgical plane of anesthesia was maintained based on the lack of the toe pinch reflex.
A midline skin incision was made and a 10×10-mm square area overlying the left somatosensory cortex was outlined. The skull over this area was thinned with a dental drill handpiece (model 3610N1) to about 150 μm until the MCA and superior cerebral veins were visible. A vaseline wall was built around the thinned area of the skull region and filled with saline. The saline film was covered with a glass coverslip and the entire setup served as an imaging window. The saline is filled in the cranial window for four main reasons: (1) preventing the skull from drying, (2) reducing surface reflection, (3) increasing the transparency of the light into the brain, and (4) permitting a clear visualization of the cortex through the entire experiment. A craniotomy was performed on the left side of the brain outside the imaging window to expose the MCA.
Two well-established animal models for cerebral ischemia have been used during our study to produce permanent MCA occlusion: cauterization and ligation. In the cauterization, the proximal MCA on the left cortex was surgically coagulated using monopolar electric cautery. In the ligation, the MCA was ligated using 4-0 silk sutures, which passed through the pial layer below the MCA and above the surface of the cortex. The rat was placed under the CCD camera such that most of the thinned skull region was contained within the camera’s field of view and that the optical axis of the camera lens was perpendicular to the center of the imaged region. All surgical procedures were performed under a surgical microscope (Carl Zeiss, Primo 1880). At the end of each experiment, the rat was euthanatized with pentobarbital sodium, Eutha-6, intravenous injection.
2.2 Instrument
A schematic of the experimental arrangement of the spatial light illumination is illustrated in Fig. 1. Periodic illumination patterns of various spatial frequencies with a 120-deg phase-shifting step between three adjacent patterns were projected onto the brain from a commercial digital light projector (BENQ, PB8260) controlled by a computer. The light intensity distribution of this pattern has the form of an amplitude-modulated sinusoidal wave. These patterns were created on a personal computer using PowerPoint software and projected sequentially using Microsoft Office’s ActiveX controls via an external LabView program (Ver. 7). The patterns were converted from white light projection to NIR using a filter wheel (Spectral Product, AB302) placed immediately at the output of the projector. We used five narrow NIR bandpass filters between 680 and 980 nm (Andover Corp.) placed on a five-position wheel.
Fig. 1.
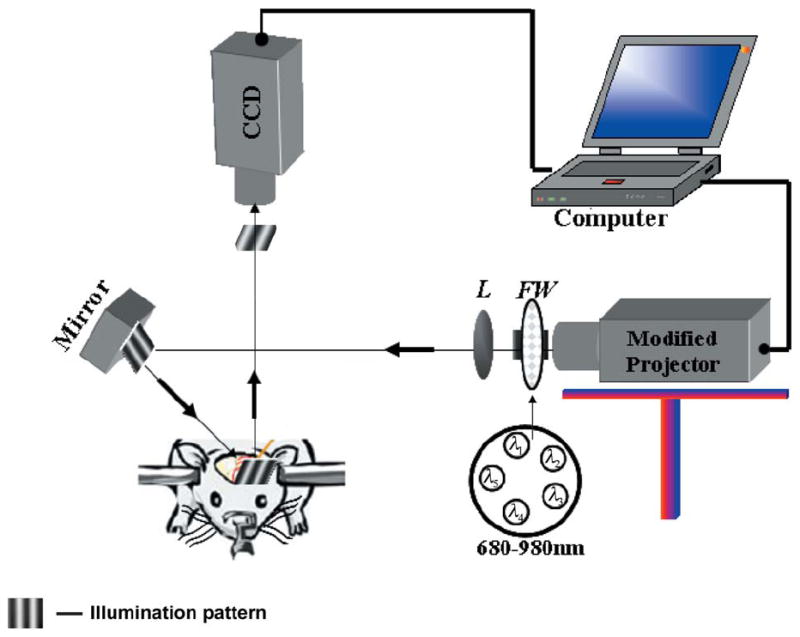
Schematic diagram of the optical arrangement used for brain imaging. Components are FW, filter wheel; L, lens; and M, mirror.
The diffusely reflected light, which contains information about the brain tissue optical properties, was recorded by a 16-bit CCD camera (Cascade, 512F) mounted normal to the brain surface. The optical axis of the camera lens was perpendicular to the center of the imaging region. The camera is equipped with an imaging objective (Nikon f/1.8 lens, Japan) lens combined with an extender and is capable of imaging up to 30 frames/s at full 512×512 resolution. The distance between the CCD lens and the brain was about 100 mm. A 6×6-mm area was imaged onto the CCD with resolution of 0.012 mm/pixel for both the x and y axes. As a part of the calibration procedure, a lab jack was used to bring the rat’s head to focus within the CCD view.
To compensate for the wavelength-dependent illumination and detection throughput, image exposure times were chosen at each wavelength, prior to each experiment as a part of system calibration, to fill the dynamic range of the camera, ranging from 10 ms (QE~ 50% at 680 nm) to 1 s (QE ~ 10% at 980 nm). The mirror appearing in the setup was aligned at a small angle of incidence, ~15 deg to the vertical axis, to obtain projection illumination at a small angle, and therefore avoid the detection of specular reflected light. Polarized filters (Meadowlark Optics, VLM-200-IR-R) in both the illumination and detector paths were aligned with the polarization planes orthogonal to each other for additional specular elimination. The entire system is controlled by a personal computer through a LabView platform.
As already mentioned, the principle component of our working system is a commercial digital light projector that is used to produce the patterned illumination. However, to fit the projector to our demands such as illumination stability, high intensity, and scalability to a small region of interest, the following modification steps were required. The white light source (Mercury lamp, OSRAM, 300 W) and the power supply of the projector were replaced with a 300-W quartz-tungsten-halogen (QTH) (EIKO, EXR, 82v) bulb and with a corresponding power supply. We decide to use this bulb since it gives a smooth broadband spectral profile along the NIR region and stable intensity over time (light output variation less then 0.6%). As shown in Sec. 3, these fluctuations are negligible compared to the signals arriving from the brain during acute ischemic injury.
To boost intensity from the QTH bulb and to use the entire spectral band, the color wheel inside the projector was carefully removed, enabling the projector to work as usual. To prevent warming of the projector, a hybrid hot mirror (Reynard Corp., C-R00670-00) was introduced between the QTH bulb and the optics inside the projector. Both the bulb and the hybrid mirror were maintained inside the projector through careful mechanical design and holders. To collimate the patterns on the surface of brain, to obtain a small (~10×10-mm) and adjustable field of view, and to compensate for aberrations derived from using white source, a new lens system was design based on a set of achromatic lenses (LA-series, ThorLabs), replacing the original lens system of the projector.
2.3 Optical Property Calculation and Calibration
A detailed description of spatially modulated imaging theory and optical property measurements in turbid media have already been treated in detail,11 but the basic features are reproduced here in the interest of clarity and completeness. Briefly, three sinusoidal patterns with a 120-deg phase shift between each are projected at the same spatial frequency denoted by I0(ωx),I120(ωx),I240(ωx). The diffusely reflected light is composed of two components: dc (fx=0) and ac (fx ≠ 0) reflectance. The amplitude of the ac and the dc diffuse reflectance, respectively, can be expressed as12
| (1) |
In the frequency domain Aac and Adc are given by
| (2) |
where ωx is the radial spatial frequency given by ωx=2πfx, fx is the spatial frequency, Is is the source intensity, and MTFsys is the modulation transfer function of the entire system (projector, tissue, and CCD). To extract precisely the diffuse reflectance measurement, random system artifacts such as source strength variability, nonuniform response of the CCD camera, electronic noise caused by the projector-DMD element and the CCD, and optics distortion must be removed. Therefore, we performed calibration based measurements from a tissue-simulating phantom (siloxane with TiO2 particles) with known optical values a priori at each wavelength to obtain Aac(ωx)ref and Adc(ωx)ref, respectively. Equation (2) is then divided by these measurements and multiplied by a model prediction for the same turbid phantom, Rd(ωx)ref_pred. This process can be described through the following:
| (3) |
Note that by using the reference’s known optical properties we can calculate the diffuse reflectance of the model-based prediction, Rd(ωx)ref_pred using Monte Carlo simulation. As Rd(ωx)ref_pred approximates Rd (ωx)ref, Eq. (3) will provide accurate diffuse reflectance measurements for each spatial frequency and each spatial location. By measuring reflectance values at multiple spatial frequencies, Rd(ωx) can be solved to recover the optical properties of the tissue. We used both a least-squares multifrequency fitting algorithm based on Levenberg-Marquart method in MATLAB, and rapid two-frequency look-up table (LUT) approaches to extract separately the best-fit estimates of absorption and reduced scattering coefficients from Rd(ωx). Equation (3) is also applied for the dc case.
2.4 Imaging and Data Processing
Imaging was performed through the surgically created imaging window on anesthetized rats held in a stereotactic frame. The reflected image of the region of interest (ROI) of the cortex was acquired on a CCD camera while projecting spatially modulated NIR light onto the region of interest. Image sets of each of the five wavelengths were acquired over a 6×6-mm2 brain surface, with six spatial frequencies ranging from 0 to ~0.26 mm−1. Images at each frequency were obtained as shown in Eq.(1). The resulting 90 images (6 spatial frequencies, 3 phase shifts for each frequency, 5 wavelengths) provide a quantitative frequency response (or modulation transfer function, MTF) of the diffuse reflectance of the brain [see Fig. 2(c)].
Fig. 2.
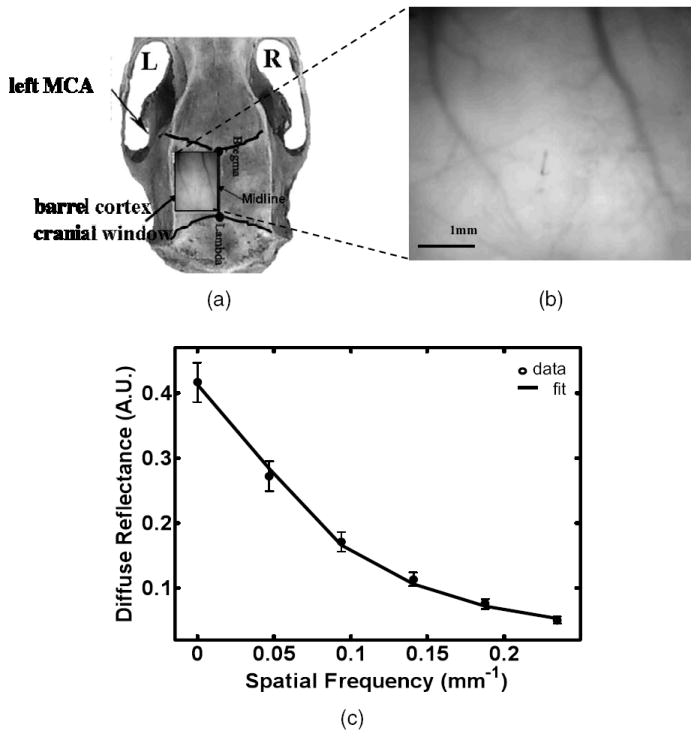
(a) Top view of the rat skull. The rectangle shows the cranial window above the region of the left parietal somatosensory barrel cortex used for imaging. (b) Enlarged photograph of the rat cortex ROI. The scale bar corresponds to 1 mm. (c) Averaged diffuse reflectance versus spatial frequency at 680 nm. The line represents the fitting of the theory to the experimental measurement (circle). Error bars show the spatial standard deviation of the diffuse reflectance ROI pixel value.
Diffuse reflectance images were obtained from the ROI selected by the investigators, and processed by fitting frequency-dependent data to a Monte Carlo model. To separate light absorption from light scattering and subsequently generate chromophore maps faster, we used only two spatial frequencies (from the six frequencies): 0 mm−1 (dc frequency) and 0.16 mm−1 (ac frequency) in our experiments. As a result, multispectral maps were generated approximately every ~1.5 min to study the changes in cortical perfusion with time following experimental manipulation.
Imaging was started before induction of ischemia to establish baseline chromophore concentrations and repeated during and after experimental intervention. Throughout the entire study, baseline images were obtained between 15 and 25 min before induction of experimental injury to establish baseline chromophore concentrations. Thus, each rat served as its own control, decreasing the number of animals required for the study. Postinjury imaging was started approximately 15 min after MCA occlusion and continued for 1 h. The image analysis was performed off-line on a PC computer with custom software developed in MATLAB (version 7.04, The Math-Works, Inc). All images before analysis were digitally filtered by a 2-D Gaussian low-pass filter with size of 9×9 with standard deviation (FWHM) of σ=1.5 using the fspecial function in MATLAB and a 3×3 binning operation was performed.
2.5 Monte Carlo Simulation
A Monte Carlo (MC) method was used to define the relationship between the measured reflectance and the optical properties of the rat cortex. We adopted the use of a White Monte Carlo (WMC) technique13 to accelerate processing time. In WMC, libraries for a specified scattering coefficient and null absorption are built and the reflectance function R’0(μ’s0,μa=0) is calculated. The diffuse reflectance function for other scattering values and any set of absorption, R(μ’s,μa≠0) , is then obtained by multiplying R’0 by scaling factors (Ref. 13, Eq. (2), p. 2775). Once the diffuse reflectance, R(μ’s, μa), is obtained, a Fourier-Bessel transform is used to predict the diffuse reflectance in the spatial frequency domain.14
In this study, a WMC simulation was performed for a collimated point source launching 10 million photons into the medium with a detector numerical aperture of 0.22. All simulations assumed a semiinfinite homogenous medium with index of refraction n=1.43, anisotropy factor g=0.9, and the Henyey-Greenstein phase-function. The grid resolution (dr) was 0.09 mm, making the maximum spatial frequency greater than 10 mm−1. For five wavelengths and six spatial frequencies, typical simulation times were less then 6 h on a current desktop system (AMD Turion 1.6-GHz CPU).
2.6 Statistical Considerations
Comparison of optical and chromophore properties pre- and post-MCA occlusion were performed by using a paired t test. Differences in properties were considered to be significant at a probability level of less than 0.05 (p<0.05). Data are presented as means±standard error throughout the paper. All statistical calculations were performed with Windows software.
3 Results and Discussion
During experiments, the region of the left parietal somatosensory barrel cortex centered at the whisker C2 functional representation location was monitored pre- and post-MCA occlusion. A rat brain illustration together with the cranial window for optical imaging and the approximate position of the left MCAo are presented in Fig. 2(a). The enlarged region photograph of the cranial window is shown in Fig. 2(b). The size of this ROI is about 4(V)×4.9(H) mm2. The relationship between the measured diffuse reflectance from brain tissue and the spatial modulation frequency is shown in Fig. 2(c) for 680-nm light. As demonstrated by this plot, the brain tissue acts like a low-pass spatial filter, attenuating the reflectance more strongly as the spatial frequency increases. The data was fit to the MC model using a nonlinear least-squares optimization routine. As can be seen, the numerical calculations are in quantitative agreement with experimental data with low fitting error. These errors are believed to be mainly due to the phantom calibration process and the assumption of homogeneity in the computational model.
Once the information of Fig. 2(c) is obtained, optical coefficients are retrieved by using an MC model, as discussed previously in Sec. 2.5. As mentioned in the introduction, mapping the absorption coefficient at each wavelength with the knowledge of the wavelength-dependent molar extinction (ε) values of the chromophores15-17 enables us to calculate tissue chromophore concentration (C) separately at each pixel using the following equation18
| (4) |
where the brackets [ ] represent a matrix, the bold type indicates a vector, and λ is the wavelength. We assume that the measured absorption spectra are linear combinations of the component chromophore spectra, and we solve the equation by adjusting μa and C into the appropriate vectors, ε into a matrix, and solving the matrix equation.
An example of the changes in the ctO2Hb, ctHHb, and stO2 maps before and after the occlusion is shown in Fig. 3(a). The grayscale to the right of each map represents the absolute chromophore value of each pixel in the map. To better visualize changes, mean color scales were set at 50% for all of the preocclusion data. No a priori knowledge about tissue chromophore content has been assumed (other then standard nonnegative constrains). Averaging over each of these maps we found a 22±10.2% increase in deoxyhemoglobin concentration and a 43±6.6% and 32±4.1% decrease in oxyhemoglobin and oxygen saturation, respectively, from baseline values following MCA occlusion. These changes reflect the pathophysiologic state of the brain and the ability of spatially modulated light to quantify changes in chromophore concentrations with time.
Fig. 3.
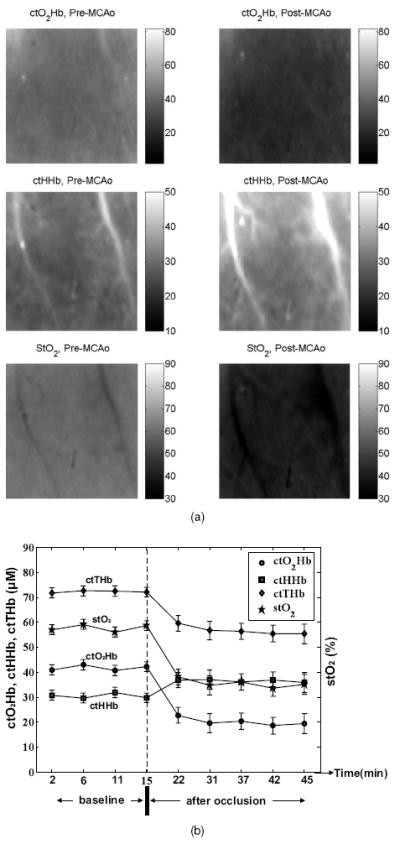
Results from a representative rat (out of seven). (a) Oxy-, deoxyhemoglobin (μM) and oxygen saturation (%) maps pre-and post-MCAo. In all panels, higher concentration values correspond to brighter pixels. Scale values are represented by the scale bar to the right of each panel. Field of view ~6×6 mm. (b) Time course of quantitative values of cerebral hemodynamics from the barrel cortex before and after MCA occlusion obtained from the area in Fig. 2(b). The error bars give the standard error (±SE) of all pixels in ROI.
A representative time course of the absolute changes in chromophore concentration within the entire cortex of Fig. 2(b) pre-MCAo (baseline) and post-MCAo are presented in Fig. 3(b). A decrease in the ctTHb from baseline in the amount of 19±7.3% is observed. In the intact brain, ctTHb tracks blood flow as long as the hematocrit is constant, but in thrombosed vessels, this relationship may change. For example, if blood flow decreases or stops but the vessels do not collapse, ctTHB can remain high in the occluded region.7,14 However, our signals are derived primarily from superficial microvasculature a few millimeters in depth beneath the skull. Because these vessels are significantly downstream from the MCA occlusion site, we expect that the observed reduction in ctTHB is a consequence of stroke-induced termination of flow.
Fluctuations in chromophore concentrations pre- and post-MCAo can also be seen in Fig. 3(b). Mean values do not exceed more then ±3 μM for hemoglobin and ± 3% for stO2. As previously stated in Sec. 2.4, measurement of brain optical properties and generation of an image (a unit measurement) required 1.5 min. Thus, each unit measurement is an average of the dynamic optical properties over 1.5 min. The nature of these fluctuations may change after the stroke and thus account for additional measurement errors. With further advances in technology and faster image acquisition, this potential source of error is likely to be reduced.
While light absorption is related to the concentrations of individual chromophores, light scattering is related to tissue structural properties such as density, size, and distribution of scattering. Tissue scattering properties are believed to depend on intracellular (nuclei, mitochondria) and extracellular (protein) structures.19 Therefore, examination of the scattering behavior can provide fundamental insight into microstructural physiology. Extracting the mean particle size and number density of scattering particles from the reduced scattering co-efficient spectrum in breast tissue was discussed recently by Wang et al.20 In the following, we report our observation on the behavior of scattering properties during brain ischemia. Several studies have shown that the wavelength dependence of scattering in tissue in the NIR follows a power-law dependence of the form21,22
| (5) |
where A is the scattering amplitude, and sp (sometimes indicted by b) is the scattering power. It has been shown that A and sp are related to geometrical properties; a decrease in sp reflects an increase in scatterer size and vice versa.23 Decreases in A occur with changes in density (number density of the scatterer), distribution (histogram of particle number density) and refractive index.20
Changes in the reduced scattering coefficient, scattering amplitude, and scattering power over time for the entire ROI (single animal) shown in Fig. 2(b) are plotted in Fig. 4(a)–4(c), respectively. The mean scattering values pre-MCA occlusion are ~4% higher than postocclusion. The decrease in the scattering power with ischemia can be explained by an increase in the average size of the scatterers. This could be the result of cell swelling in response to acute injury.24 Changes in scattering amplitude (A) are influenced by (1) number of particles, (2) the ratio of the refractive index outside (extra-cellular) to inside (intracellular) the scattering particle, and (3) particle distribution. Since 1 and 3 are assumed not to change in the first hour of ischemic injury, the measured drop in scattering amplitude most likely reflects a homogenization of refractive index due to injury-induced alterations in cell and organelle permeability. This reduction in spatial variation of refractive index causes more light to passes through the cortex, and less light to be scattered. Hence, by measuring scattering amplitude and power one can get an impression of the degree of cellular injury in terms of cell swelling (edema) and membrane damage. A summary of scattering changes for all animals is presented in Table 1.
Fig. 4.
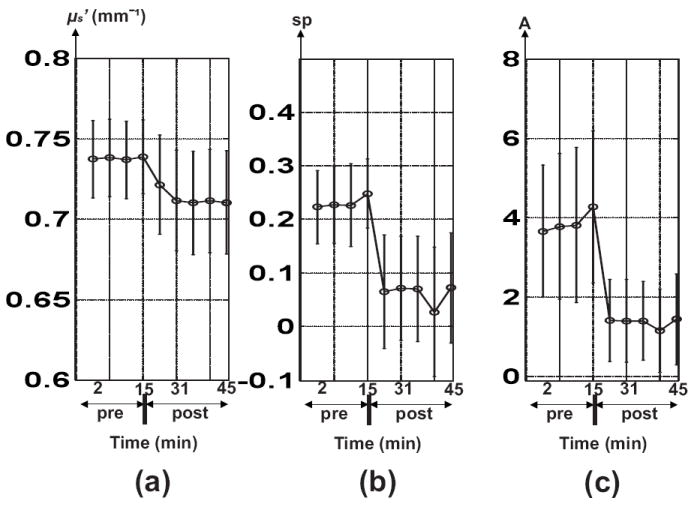
Time course of the quantitative values of scattering properties (μ’s, sp, and A) before and after MCA occlusion obtained from the entire ROI of Fig. 2(b).
Table 1.
Statistics comparing brain properties pre-MCAo and 45 min post-MCAo over the entire cortex for seven rats.
| Preocclusion | Postocclusion | p Value | ||||
|---|---|---|---|---|---|---|
| Parameter Name | Mean±SE | Median | Mean±SE | Median | Significance Level | t Test |
| ctO2Hb (μM) | 52.4±3.7 | 51.1 | 28.1±1.9 | 29.2 | hs | 0.00013 |
| ctHHb (μM) | 34.9±3.2 | 36 | 41.9±2.1 | 40 | hs | 0.0035 |
| ctTHb (μM) | 87.3±6.8 | 88 | 70.0±3.5 | 71 | hs | 0.0034 |
| stO2 (%) | 60.7±1.1 | 59.1 | 39.8±1.6 | 41.1 | hs | 0.00086 |
| μ’s (1/mm) | 0.67±0.01 | 0.67 | 0.64±0.02 | 0.65 | s | 0.03 |
| sp | 0.65±0.1 | 0.63 | 0.43±0.09 | 0.5 | s | 0.018 |
| log (A) | 1.42±0.27 | 1.48 | 0.94±0.3 | 1.04 | s | 0.03 |
| Iisch | 0.66±0.08 | 0.69 | 1.52±0.28 | 1.43 | hs | 0.00017 |
Paired t test comparisons of tissue parameters between pre- and post-MCAo were performed. Note that we report the logarithm of the scattering amplitude (A) since the range of A was large.
Note: hs, highly significant with p<0.005; s, significant with p<0.05; and ns, not significant with p>0.05.
Regional changes in cortical properties can also observed by converting absorption and scattering maps into histogram distributions before and after the MCAo, as shown in Fig. 5 and 6, respectively. Figure 5 illustrates that when a wide ROI is selected, overlap between histograms diminishes contrast between pre- and post-MCAo optical properties. This is a result of partial-volume effects (in all three spatial dimensions) of sampling heterogeneous tissue. When a more homogeneous ROI is selected (Fig. 6), pre- and post-MCAo histograms are clearly separated. This is an expected result as we sample a more homogenous region of the cortex. Note that mean values of each property in Fig. 5 are almost identical to those in Fig. 6. However, values for the variance are reduced, for example, by 67, 63, 25, and 38% for absorption, scattering, scatter amplitude, and scatter power, respectively, in the homogenous region (Fig. 6).
Fig. 5.
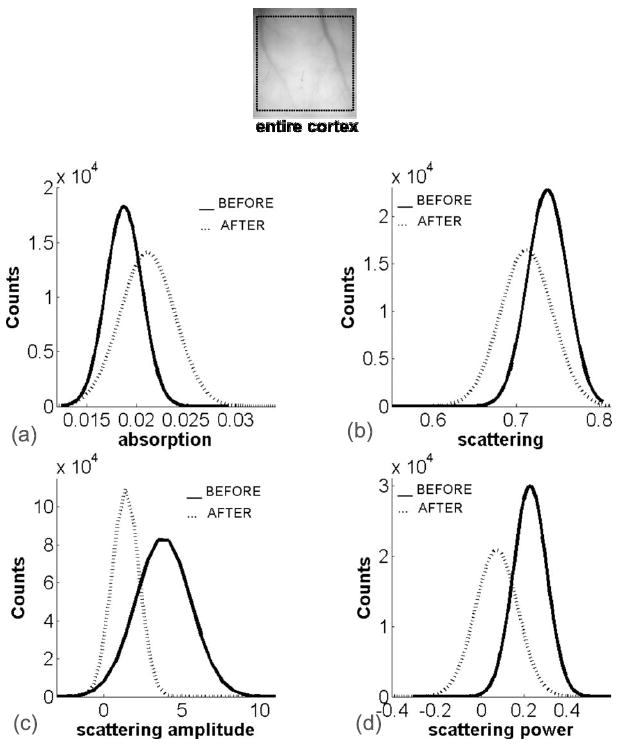
(a) and (b) Absorption and (c) and (d) scattering property histograms before (solid lines) and after (dashed lines) MCAo for the entire cortex.
Fig. 6.
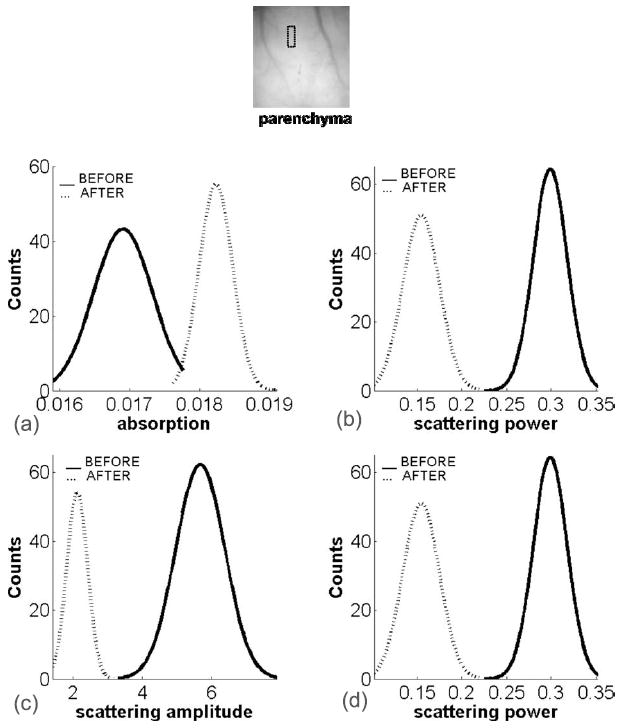
(a) and (b) Absorption and (c) and (d) scattering property histograms before (solid lines) and after (dashed lines) MCAo for the parenchyma. The small box denotes the ROI used for analysis.
Table 1 summarizes the results of statistical comparisons before and 45 min after MCAo for ctO2Hb, ctHHb, ctTHb, stO2, and the three scattering parameters for the seven rats used in this study. For each parameter, we calculated both the mean and the median for the entire cortical ROI. In all analyses, a difference of p<0.05 was regarded as statistically significant. The results of the analysis show that all chromophores display statistically highly significant differences between pre- and post-MCAo. The percent changes apparent from the table show a 17±4.7% increase in tissue concentration of deoxyhemoglobin and 45±3.1, 23±5.4, and 21±2.2% decreases in oxyhemoglobin, total hemoglobin concentration, and cerebral tissue oxygen saturation levels, respectively, following induction of cerebral ischemia. Our findings are consistent with previous observations, considering the variance in measurements, and agree well with known directions of change with cerebral ischemia. For comparison, Culver et al.7 reported chromophore baselines for ctO2Hb (55 to 85 μM), ctHHb (23 to 41 μM), ctTHb (81 to 125 μM), and stO2 (65 to 73%) in a rat model. The authors also observed a 15% maximum decrease of stO2 after MCAo, while we observe a maximum decrease of 21% in stO2 following MCAo. In a human subject, an increase of 20% from baseline in deoxyhemoglobin and 42, 18, and 25% decreases in oxyhemoglobin, total hemoglobin, and brain tissue oxygen saturation concentrations, respectively, were reported.10
Ischemia results in higher concentrations of ctHHb due to ongoing metabolic activity, and lower ctO2 Hb with reduced hemoglobin delivery. These physiological parameters can be grouped into a simple ischemic index, Iisch=ctHHb/ctO2Hb.Average values of Iisch for seven rats increased more then twofold after MCAo from 0.66±0.08 to 1.52±0.28 (Table 1). To visualize ischemic spatial variations before and after MCAo, we show Iisch images for a representative rat in Fig. 7. A cross-sectional profile from the left vein towards the right vein was applied as shown in Fig. 7(a). The graphs in Fig. 7(b) represent the gradient profile of Iisch before and after MCAo, respectively. Overall, our results show approximately threefold increase in Iisch levels after MCAo. Prior to occlusion, we observe that Iisch varies across the cortex, with significantly higher levels in the cortical veins (0.83 to 1) compared to the central parenchymal region of mixed microvasculature (0.65 to 0.75). As expected the Iisch spatial profile after MCAo remained approximately the same, but overall levels increased (~2.6 to 3 in veins versus ~1.7 to 2.2 in parenchyma).
Fig. 7.
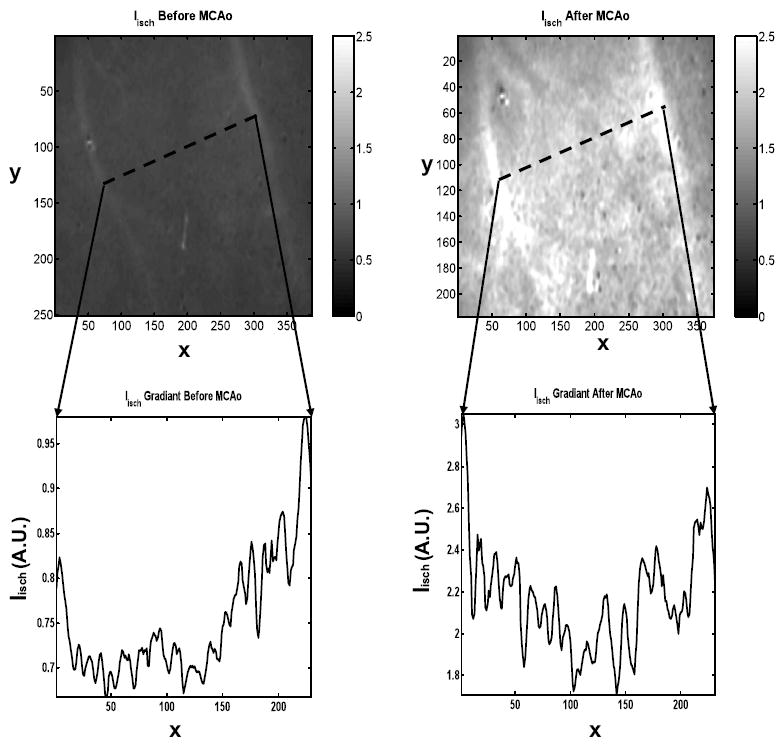
Ischemic index (Iisch=ctHHB/ctO2Hb) gradient profile measured before (left) and after (right) MCAo. The dotted lines represents the cross-sectional view along the two cortical veins. Field of view ~6×6 mm.
4 Conclusions
In this pilot study, spatially modulated optical imaging using NIR structured illumination was used to measure neural tissue optical properties and cerebral chromophore changes during acute ischemic injury in rat brains. Using this technique, we were able to separate and quantify the absorption and reduced scattering coefficients of tissue in the NIR range. Once determined, the optical properties were used to map and quantify the physiological state of brain tissue in space and time.
Our results show an increase in the tissue concentration of deoxyhemoglobin (17±4.7%) and a decrease in oxyhemoglobin (45±3.1%), total hemoglobin (23±5.4%), and cerebral tissue oxygen saturation (21±2.2%) following induction of cerebral ischemia. Using a simple ischemic index (Iisch=ctHHb/ctO2Hb) an average of more then twofold contrast is observed after MCAo. We also observed decreases in both scatter power and scatter amplitude of approximately 35% following MCA occlusion, suggesting that optical methods have sensitivity to neural tissue alterations such as cellular swelling and/or tissue edema that may occur secondary to hemodynamic changes.
Acknowledgments
Support for this work was provided by the Laser Microbeam and Medical Program (LAMMP, P41-RR01192), the U.S. Air Force Office of Scientific Research (AFOSR) Medical Free-Electron Laser (MFEL) Program (F49620-00-2-0371 and FA9550-04-1-0101), the Beckman Foundation, and the National Institutes of Health Neurological Disorders and Stroke (NINDS) NS-43165, NS-48350. We would like to thank D. J. Cuccia and A. J. Durkin for generous contributions and insightful technical discussions. We are grateful to Ms. Melissa Davis for her assistance during the rat surgeries. We would also like to thank both C. Zhou et al.25 and Q. Luo et al.26 for their permission to use the image of the rat (Fig. 1) and rat skull [Fig. 2(a)], respectively. D. Abookasis gratefully acknowledges the support of the Rothschild Foundation (Yad Hanadiv) Postdoctoral Research Fellowship Program, Israel (2005 to 2006).
Contributor Information
David Abookasis, University of California Irvine, Beckman Laser Institute and Medical Clinic, 1002 Health Sciences Road East, Irvine, California 92612.
Christopher C. Lay, University of California Irvine, Department of Neurobiology and Behavior, 2205 McGaugh Hall, Irvine, California 92697
Marlon S. Mathews, University of California Irvine, Department of Neurological Surgery, Medical Center, 101 The City Drive South, Orange, California 92868
Mark E. Linskey, University of California Irvine, Department of Neurological Surgery, Medical Center, 101 The City Drive South, Orange, California 92868
Ron D. Frostig, University of California Irvine, Department of Neurobiology and Behavior, 2205 McGaugh Hall, Irvine, California 92697
Bruce J. Tromberg, University of California Irvine, Beckman Laser Institute and Medical Clinic, 1002 Health Sciences Road East, Irvine, California 92612
References
- 1.Caplan LR. Stroke. AAN Press; New York: 2006. [Google Scholar]
- 2.Dirnagl U, Iadecola C, Moskowitz MA. Pathobiology of ischaemic stroke: an integrated view. Trends Neurosci. 1999;22:391–397. doi: 10.1016/s0166-2236(99)01401-0. [DOI] [PubMed] [Google Scholar]
- 3.Frostig RD. In Vivo Optical Imaging of Brain Function. CRC Press; Boca Raton, FL: 2001. [PubMed] [Google Scholar]
- 4.Tamura A, Graham DI, McCulloch J, Teasdale GM. Focal cerebral ischaemia in the rat: 1. Description of technique and early neuropathological consequences following middle cerebral artery occlusion. J Cereb Blood Flow Metab. 1981;1:53–60. doi: 10.1038/jcbfm.1981.6. [DOI] [PubMed] [Google Scholar]
- 5.Chen ST, Hsu CY, Hogan EL, Maricq H, Balentine JD. A model of focal ischemic stroke in the rat: reproducible extensive cortical infarction. Stroke. 1986;17:738–743. doi: 10.1161/01.str.17.4.738. [DOI] [PubMed] [Google Scholar]
- 6.Wolf T, Lindauer U, Reuter U, Back T, Villringer A, Einhäupl K, Dirnagl U. Noninvasive near infrared spectroscopy monitoring of regional cerebral blood oxygenation changes during peri-infarct depolarizations in focal cerebral ischemia in the rat. J Cereb Blood Flow Metab. 1997;17:950–954. doi: 10.1097/00004647-199709000-00004. [DOI] [PubMed] [Google Scholar]
- 7.Culver JP, Durduran T, Furuya D, Cheung C, Greenberg JH, Yodh AG. Diffuse optical tomography of cerebral blood flow, oxygenation, and metabolism in rat during focal ischemia. J Cereb Blood Flow Metab. 2003;23:911–924. doi: 10.1097/01.WCB.0000076703.71231.BB. [DOI] [PubMed] [Google Scholar]
- 8.Vacas-Jacques P, Paez G, Strojmk M. Simultaneous multispectral reflectance imaging and laser speckle flowmetry of cerebral blood flow and oxygen metabolism in focal cerebral ischemia. J Biol Chem. 2008;13:044007-1–11. doi: 10.1117/1.2950312. [DOI] [PMC free article] [PubMed] [Google Scholar]
- 9.Stankovic MR, Maulik D, Rosenfeld W, Stubblefield PG, Kofinas AD, Drexler S, Nair R, Franceschini MA, Hueber D, Gratton E, Fantini S. Real-time optical imaging of experimental brain ischemia and hemorrhage in neonatal piglets. J Perinat Med. 1999;27:279–286. doi: 10.1515/JPM.1999.039. [DOI] [PubMed] [Google Scholar]
- 10.C-Arnulphi M, Alaraj A, A-Hanjani S, Mantulin WW, Polzonetti CM, Gratton E, Charbel FT. Detection of cerebral ischemia in neurovascular surgery using quantitative frequency-domain near-infrared spectroscopy. J Neurosurg. 2007;106:283–290. doi: 10.3171/jns.2007.106.2.283. [DOI] [PubMed] [Google Scholar]
- 11.Cuccia DJ. PhD Dissertation. University of California; Irvine: 2006. Modulated imaging: a spatial frequency domain imaging method for wide-field spectroscopy and tomography of turbid media. [Google Scholar]
- 12.Neil MAA, Juskaitis R, Wilson T. Method of obtainingoptical sectioning by using structured light in a conventional microscope. Opt Lett. 1997;22:1905–1907. doi: 10.1364/ol.22.001905. [DOI] [PubMed] [Google Scholar]
- 13.Pifferi A, Taroni P, Valentini G, A-Engels S. Real-time method for fitting time-resolved reflectance and transmittance measurements with a Monte Carlo model. Appl Opt. 1998;37:2774–2780. doi: 10.1364/ao.37.002774. [DOI] [PubMed] [Google Scholar]
- 14.Murata Y, Sakatani K, Hoshino T, Fujiwara N, Kano T, Nakamura S, Katayama Y. Effects of cerebral ischemia on evoked cerebral blood oxygenation responses and BOLD contrast functional MRI in stroke patients. Stroke. 2006;37:2514–2520. doi: 10.1161/01.STR.0000239698.50656.3b. [DOI] [PubMed] [Google Scholar]
- 15.Kou L, Labrie D, Chylek P. Refractive indices of water and ice in the 0.65- to 2.5-μm spectral range. Appl Opt. 1993;32:3531–3540. doi: 10.1364/AO.32.003531. [DOI] [PubMed] [Google Scholar]
- 16.Eker C. Ph.D. Dissertation. Dept. of Physics, Lund institute of Technology; 1999. Optical characterization of tissue for medical diagnostics. [Google Scholar]
- 17.Zijlistra WG, Buursma A, Assendelft OWV. Visible and Near Infrared Absorption Spectra of Human and Animal Haemoglobin: Determination and Application. VSP; Utrecht: 2000. [Google Scholar]
- 18.Delpy DT, Cope M, van der Zee P, Wray S, Wyatt J. Estimation of optical pathlength through tissue from direct time of flight measurement. Phys Med Biol. 1988;33:1433–1442. doi: 10.1088/0031-9155/33/12/008. [DOI] [PubMed] [Google Scholar]
- 19.Tromberg BJ, Shah N, Lanning R, Cerussi A, Espinoza J, Pham T, Svaasand L, Butler J. Non-invasive in vivo characterization of breast tumors using photon migration spectroscopy. Neoplasia. 2000;2:26–40. doi: 10.1038/sj.neo.7900082. [DOI] [PMC free article] [PubMed] [Google Scholar]
- 20.Wang X, Pogue BW, Jiang S, Song X, Paulsen KD, Kogel C, Poplack SP, Wells WA. Approximation of Mie scattering parameters in near-infrared tomography of normal breast tissue in vivo. J Biomed Opt. 2005;10:051704-1–8. doi: 10.1117/1.2098607. [DOI] [PubMed] [Google Scholar]
- 21.Van Staveren HJ, Moes CJM, Marle J, Prahl SA, Van Gemert MJC. Light scattering in Intralipid-10% in the wavelength range of 400–1100 nm. Appl Opt. 1991;30:4507–4514. doi: 10.1364/AO.30.004507. [DOI] [PubMed] [Google Scholar]
- 22.Graaff R, Aarnoose JG, Zijp JR, Sloot PMA, de Mul FFM, Greve J, Koelink MH. Reduced light-scattering properties for mixtures of spherical particles: a simple approximation derived from Mie calculations. Appl Opt. 1992;31:1370–1376. doi: 10.1364/AO.31.001370. [DOI] [PubMed] [Google Scholar]
- 23.Mourant JR, Fuselier T, Boyer J, Johnson T, Bigio IJ. Predictions and measurements of scattering and absorption over broad wavelength ranges in tissue phantoms. Appl Opt. 1997;36:949–957. doi: 10.1364/ao.36.000949. [DOI] [PubMed] [Google Scholar]
- 24.Borges N, Cerejo A, Santos A, Sarmento A, Azevedo I. Changes in rat cerebral mitochondrial succinate dehydrogenase activity after brain trauma. Int J Neurosci. 2004;114:217–227. doi: 10.1080/00207450490249419. [DOI] [PubMed] [Google Scholar]
- 25.Zhou C, Yu G, Furuya D, Greenberg J, Yodh A, Durduran T. Diffuse optical correlation tomography of cerebral blood flow during cortical spreading depression in rat brain. Opt Express. 2006;14:1125–1144. doi: 10.1364/oe.14.001125. [DOI] [PubMed] [Google Scholar]
- 26.Chen S, Li P, Luo W, Gong H, Zeng S, Luo Q. Origin sites of spontaneous cortical spreading depression migrated during focal cerebral ischemia in rats. Neurosci Lett. 2006;403:266–270. doi: 10.1016/j.neulet.2006.05.012. [DOI] [PubMed] [Google Scholar]


