

Abstract
Calculating the absolute binding free energies is a challenging task. Reliable estimates of binding free energies should provide a guide for rational drug design. It should also provide us with deeper understanding of the correlation between protein structure and its function. Further applications may include identifying novel molecular scaffolds and optimizing lead compounds in computer-aided drug design. Available options to evaluate the absolute binding free energies range from the rigorous but expensive free energy perturbation to the microscopic Linear Response Approximation (LRA/β version) and its variants including the Linear Interaction Energy (LIE) to the more approximated and considerably faster scaled Protein Dipoles Langevin Dipoles (PDLD/S-LRA version), as well as the less rigorous Molecular Mechanics Poisson–Boltzmann/Surface Area (MM/PBSA) and Generalized Born/Surface Area (MM/GBSA) to the less accurate scoring functions. There is a need for an assessment of the performance of different approaches in terms of computer time and reliability. We present a comparative study of the LRA/β, the LIE, the PDLD/S-LRA/β and the more widely used MM/PBSA and assess their abilities to estimate the absolute binding energies. The LRA and LIE methods perform reasonably well but require specialized parameterization for the non-electrostatic term. On the average, the PDLD/S-LRA/β performs effectively. Our assessment of the MM/PBSA is less optimistic. This approach appears to provide erroneous estimates of the absolute binding energies due to its incorrect entropies and the problematic treatment of electrostatic energies. Overall, the PDLD/S-LRA/β appears to offer an appealing option for the final stages of massive screening approaches.
Keywords: binding affinity, PDLD/S-LRA/β, LRA/β, LIE, molecular dynamics, MM/PBSA, drug design, scoring functions, structure based drug design, virtual screening
I. INTRODUCTION
As of Oct. 2009, there are ~60000 crystallographic or solution structures of proteins and nucleic acids available from PDB. The rate of macromolecular structure determination continues to increase every year, particularly with the development of new techniques such as high throughput X-ray crystallography. This growing number of macromolecular structures that play vital roles in critical metabolic pathways offer unparalleled opportunities for structure-based drug design and discovery. Numerous structure-based screening methods have been developed to assist lead discovery to identify novel lead compounds among large chemical databases that bind with reasonable affinity (low mM to nM range) to a particular target before being prioritized in biological evaluation. Similarly, to aid lead optimization, computational methods capable of predicting binding affinities of similar compounds are required.
In general, calculations of binding free energies play a major role in correlating the structure and function of proteins.1–8 In drug design and discovery projects, one is interested in fast ranking of ligands of potential pharmaceutical interest, agonist or antagonist, according to their binding free energies (or affinity) towards a given protein. It is also imperative to obtain realistic answers faster than experiments are carried out in an industrial setting. Current computational approaches for screening large chemical databases in an attempt to identify potential drug candidates rely on simplified approximations to attain the required computational efficiency. The corresponding scoring functions are fast but by their very nature are not derived from a well-defined physical model, for example, most scoring functions usually have poor treatment of the electrostatic contributions. Besides, they consider only one receptor-ligand complex and ignore ensemble averaging and properties of the unbound state of the ligand and the receptor. Furthermore, the use of additive modes cannot describe subtle cooperativity effects. The need to adequately represent the complex physics and thermodynamics behind the protein-ligand complex formation presents further challenge in the development of more accurate scoring functions.
Here, one can try to exploit the “state of the art” computer power and implement more rigorous free energy estimates. However, it is still crucial to find the proper balance between the speed and the accuracy. In assessing the available options, one can examine a wide range of approaches where the most rigorous option is provided by the free energy perturbation (FEP). This approach is at least formally rigorous and capable of considering relaxation process in the protein/solvent system. However, carrying out converging FEP calculations on large macromolecular assemblies, surrounded by explicit water molecules, often remains computationally prohibitive. Furthermore, the available computer power does not allow one to use the FEP approaches in effective docking studies where different binding sites should be explored. For this reason, it is necessary to seek ways to reduce the computational cost of FEP while keeping them accurate.
An alternative to the FEP calculations can be obtained by using the microscopic all-atom linear response approximation (LRA)9,10 for the electrostatic part of the thermodynamics cycle and approximating the non-electrostatic part by different strategies.9,11 Another related approach is the widely used linear interaction energy (LIE) method, 12,13 which adopts the LRA approximation for the electrostatic contribution while estimating the non-electrostatic term by scaling the average van der Waals (vdW) interaction. This non-electrostatic term is also found useful with the version of LRA11 called the LRA/β (see the methods section). A simpler and significantly faster option is offered by the semi-macroscopic protein dipoles langevin dipoles (PDLD/S) in its LRA form (PDLD/S-LRA).9–11 Another commonly used semi-macroscopic method is the molecular mechanics poisson–boltzmann/surface area (MM/PBSA).14,15 This approach predicts the absolute binding free energy by combining molecular mechanics (MM) energy, solvation free energies with Poisson Boltzmann 16 or generalized Born 17 calculations, and entropy estimates from quasiharmonic (QH) or normal mode (NMODE) analysis.18 Although the MM/PBSA simulations of several protein-ligand systems have been reported in the literature, the method has drawn some criticism due to its lack of a clear theoretical foundation.19,20 It is worth-mentioning that the MM/PBSA and the MM/GBSA methods are an apparent adaptation of the PDLD/S-LRA idea of MD generation of conformations for implicit solvent calculations, but these methods only calculate the average over the configurations generated with the charged solute while ignoring the uncharged term. In the MM/PBSA approach, rather than looking for more physical (and complex) implicit solvent representations, much attention has been devoted to adjusting model parameters, such as atomic radii and solute dielectric constant, to reproduce experimental observations. Also, this approach has other problems, such as the treatment of the protein dielectric (e.g., see ref21 and also, the results and discussion section).
There are other useful approaches that provide faster qualitative estimates of the binding free energies such as the empirical or knowledge based (statistical) scoring functions.22–26 These are based on simple functions that accounts, for e.g., for hydrogen bonds, ionic interactions, hydrophobic contacts and the number of rotatable bonds in the ligand,27 while neglecting important components of the binding free energy. The statistical scoring approaches are, of course, very fast27–30 but the neglect of a clear relationship to the physics of the system makes them questionable and might lead to inaccurate predictions in specific cases. On the other hand, the development of physically based methods strive to get modes that captures key effects and obtain accurate prediction because of the proper treatment of these effects.
Despite the recent developments in computing power and methodology, accurate estimation of the free energy changes still remains a challenge. The level of description included in different computational models allows a compromise between the simplicity, accuracy and the performance of the calculations. The main concern that remains is how to accommodate the number of degrees of freedom to accurately describe the protein/ligand system. Keeping in mind the limitations of the existing computation power, it is important to fall back upon reasonable approximations to mimic the realistic behavior of the system.
The present work revisits the challenge of estimating the absolute protein-ligand binding free energy by physically based methods. Our starting point is the search for a reasonable benchmark noting that, for a meaningful comparison, the experimental binding free energies must have been measured in a consistent manner. However, obtaining such data for different proteins is difficult, since the corresponding binding assays are often performed under different conditions. Therefore, we focused not only on different ligands bound to the same proteins, but also different proteins to show how well these methods can estimate the binding free energies obtained from different sources. This, of course, is a challenging task. Accordingly, we examine the accuracy of different methods for the calculation of the absolute binding free energy of several protein-ligand complexes. These methods include the microscopic LIE and LRA/β and the semi-macroscopic PDLD/S-LRA/β methods. Emphasis is placed on our semi-macroscopic PDLD/S-LRA/β method that appears to provide a simple and rapid way to screen hits from database search and, to reliably evaluate the compounds from de novo design in drug discovery projects.
We also attempt to assess the advantages of the PDLD/S-LRA/β over more commonly used MM/PBSA method by examining the performance of these approaches in evaluating the absolute binding free energies of a set of HIV-1-Reverse Transcriptase (HIV1-RT) inhibitors31 and two biotin analogs bound to avidin.32 First, we establish that the entropic contribution calculated by the MM/PBSA method is drastically overestimated and then, we point out the problems with the performance of the MM/PBSA in the case of charged ligands. Our analysis leads us to question the accuracy and reliability of the MM/PBSA approach for calculating the absolute binding free energies of protein-ligand complexes. Overall, we conclude that the PDLD/S-LRA/β is one of the most promising options for the binding free energy calculations.
II. COMPUTATIONAL METHODOLOGY
In this section, we will review the methods used in the present work and provide relevant background to the readers.
II.1. CALCULATION OF BINDING FREE ENERGIES
To evaluate the microscopic free energy of any biological process, it is essential to define the relevant thermodynamics cycle (see ref33 for early considerations). In the case of ligand binding, we consider the cycle in Figure 1.
Figure 1.

The thermodynamics cycle that describes the binding of a ligand to a protein. ℓ and ℓ′ represents the charged and uncharged forms of the ligand, respectively, while ℓ″ represents the ligand being reduced to “nothing”. For more details on this cycle, see ref11.
The direct path from ‘b’ to ‘a’ does not provide, at present, practical convergence, although attempts to evaluate the corresponding PMF were reported as early as in ref34. Therefore, one may try to use the indirect cycle:
| (1) |
where ℓ,ℓ′ and ℓ″ designate the ligand, the ligand with zero residual charges and the non-polar ligand after mutating it to a zero-sized ligand, respectively. Note that ΔG bind,ℓ″ = 0 if we have no constraints on the zero-sized ligand. The electrostatic part of the cycle can be evaluated by FEP.2,7,35,36 In this approach, we can evaluate the free energy differences between two states, A and B, by using an effective potential of the form of:
| (2) |
where U A and U B are the potential surfaces of state A and state B, respectively, λm is a mapping parameter that is used to change U m from U A to U B between (0 ≤ λm ≤ 1). The free energy increment, associated with the change of U m can be obtained by:
| (3) |
where 〈 〉m indicates that the given average is evaluated by propagating trajectories over U m and β= (k B T)−1. The total free energy difference between the states A and B is obtained by changing λ m in n equal increments and evaluating the sum of the corresponding δG. Consequently, we may write:
| (4) |
The FEP approach has been used extensively in the studies of electrostatic free energies in proteins starting quite early.21,37 However, the evaluation of the non-electrostatic part of the cycle (the ΔGℓ′→ℓ″ term) is a major concern due to the convergence problems. This makes obtaining the absolute binding free energy by FEP approach exceedingly difficult despite some encouraging results in the studies that focus on this issue (see ref38). In view of the difficulties in using direct FEP calculations, it is important to develop alternative approaches. A promising strategy, LRA, has been noted as an approximation to FEP method and may be used for estimating free energies in the studies of ligand binding to proteins.39 Considering that the LRA provides reliable results in evaluating the electrostatic free energies,9,40–44 the following equation may be used to express the free energy associated with changing the electrostatic potential of the system from U A to U B:
| (5) |
where 〈 〉i designates a molecular dynamics (MD) average over trajectories obtained with U = Ui. The LRA calculations provide a convenient way for obtaining the electrostatic part of the cycle of Figure 1. Accordingly, we can write:
| (6) |
where is the electrostatic contribution for the interaction between the ligand and its surroundings, p and w designate protein and water, respectively, and ℓ and ℓ′ designate the ligand in its actual charged form and the “non-polar” ligand, where all of the residual charges are set to 0. In this expression, the term 〈 U elec,ℓ − U elec,ℓ′ 〉, which is required by the LRA treatment, is replaced by U elec,ℓ since U elec,ℓ′ = 0. Now, the evaluation of the non-electrostatic contribution, , is still very challenging, because these contributions might not follow the LRA. A useful strategy is to evaluate by the PDLD/S-LRA approach,45 which is capable of providing contributions to the binding free energy from hydrophobic effects, vdW, and water penetration.9,11 Another powerful option is the so-called LIE approach.42,46 This approach approximates by the scaled vdW term, and introduces a simplification to the LRA approximation for the electrostatic contribution in that it neglects the 〈 U elec,ℓ 〉 ℓ′ term. Accordingly, the binding free energy is expressed as:
| (7) |
where α is a constant that is around ½ in most cases, while β is an empirical parameter that scales the vdW component of the protein-ligand interaction. A careful analysis of the relationship between the LRA and LIE approaches and the origin of the α and β parameters is given in ref11. This analysis shows that β can be evaluated in a deterministic way provided that one can determine the entropic contribution and preferably, the water penetration effect microscopically.
Considering the effectiveness of the LIE non-electrostatic term, it is useful to combine the electrostatic term of Eq. 6 with the LIE non-electrostatic term to obtain:11
| (8) |
Previously, this method was called LRA/α, 47 but since the new element is the β term relative to our original LRA treatment, 9 we prefer the name LRA/β.
Despite the formal rigor of the FEP and the LRA methods, it is frequently found that such methods are subject to major convergence problems when one deals with electrostatic effects in protein interiors. The semi-macroscopic models can give more reliable results. This is true, in particular, with regard to the PDLD/S-LRA method 10,48 that provides a direct link between the micro- and macroscopic concepts. Since this method has been reviewed extensively,9–11,49 we discuss here only its main features.
The PDLD/S-LRA method evaluates the change in electrostatic free energies upon transfer of a given ligand (l) from water to the protein by using:
| (9) |
where ΔG is the free energy of charging the ligand in the given environment (i.e., w or p). Using the cycles described in ref11, we start with the effective PDLD/S-LRA potentials:
| (10) |
| (11) |
where ΔG sol denotes the electrostatic contribution to the solvation free energy of the indicated group in water (e.g., denotes the solvation of the protein-ligand complex in water). To be more precise, ΔG sol should be scaled by 1/(1 − 1/εw), but this small correction is neglected here. The values of the ΔG sol’s are evaluated by the Langevin dipole solvent model. is the electrostatic interaction between the charges of the ligand and the protein dipoles in vacuum (this is a standard PDLD notation). In the present case, . is the intramolecular electrostatic interaction of the ligand. Now, the PDLD/S results obtained with a single protein-ligand configuration cannot capture properly the effect of the protein reorganization (see discussion in ref50). A more consistent treatment should involve the use of the LRA or related approaches (e.g., ref9 and ref50). This approach provides a reasonable approximation for the corresponding electrostatic free energies by:11
| (12) |
where the effective potential U is defined in Eqs. 10 and 11, and 〈 〉l and 〈 〉l′ designate an MD average over the coordinates of the ligand-complex in their polar and non-polar forms. It is important to realize that the average of Eq. 12 is always done where both contributions to the relevant Ū elec are evaluated at the same configurations. That is, the PDLD/S energies of the polar and non-polar states are evaluated at each averaging step by using the same structure. However, we generate two set of structures - one from MD runs on the polar state and one from MD runs on the non-polar state. This is basically the same approach used in the microscopic LRA but with the effective potential, Ū elec. The non-electrostatic term is evaluated by the approach described in ref11, considering the contribution of the hydrophobic effect (using a field dependent hydrophobic term), the contribution of water penetration and vdWs effect. The full treatment also includes calculations of binding entropy by a restraint release (RR) approach (see ref11), which is not used in the PDLD/S-LRA calculations (note that the LRA/β include configurational entropy term implicitly in the β term). However, in some cases, we use a version where the non-electrostatic contribution is evaluated by the same β term used in the LRA/β approach. Consequently, we use:
| (13) |
This is referred to as the PDLD/S-LRA/β approach.
II.2. SIMULATION PROTOCOLS
In performing the binding calculations, it is important to specify the simulation conditions. Therefore, we provide here the details about the system preparation. The selection of appropriate crystal structure from amongst the several known for a particular protein-ligand complex, for binding calculations, may have significant impact on the final results. The primary measure of crystal order/quality and accuracy of the model is its resolution. Most protein crystal structures have a resolution ranging from 2–3Å. More specifically, in low resolution structures (> 3–5Å), it is difficult to see side chains; only the overall structural fold or shape is visible. In medium resolution structures (2.5–3Å), one can differentiate between side-chains. At high resolution (2.0Å), side-chains, water molecules, and ions may be seen. Overall, the average error in the atomic positions may be of up to 0.3Å.51,52 At this level of resolution, the assignment of the positions of terminal N and O atoms is based on a self-consistent hydrogen bond network. Besides, there are two indistinguishable orientations possible for the imidazole ring in histidine. At 1.6Å, the holes in aromatic residues and alternate conformations for side-chains can be viewed. At atomic resolution, 1.1Å or better, some hydrogens can be modeled.
Using MD simulation approaches allows one to obtain reasonable starting point for the free energy calculations from a resolution of ~2Å, but reasonable results may also be obtained with a lower resolution. In the FEP and related calculations, one can either use the water molecules observed in the x-ray crystallographic structure and complete them with the rest of the surrounding solvent molecules or remove all of the observed water molecules and “solvate” the entire protein. The main uncertainty is usually associated with the identification of the bound ligand. Therefore, we focused here on systems where the ligand is observed in a reasonable resolution (in most cases).
With the above considerations in mind, we obtained the starting coordinates of the protein in complex with their respective ligands from the Protein Data Bank (PDB).53 The PDB Ids and resolutions of the x-ray crystallographic structures used in this study are as follows: the monofunctional Chorismate mutase from Bacillus subtilis [2CHT, 2.20Å]; Human Thrombin [1K21, 1.86Å; 1K22, 1.93Å]; Bovine Trypsin [1K1I, 2.20Å; 1K1L, 2.50Å; 1K1M 2.20Å]; Human Renin [2IKO, 1.90Å; 2IL2, 2.24Å; 2IKU, 2.60Å]; HIV-1 Protease [1QBS, 1.80Å]; Human Aldose reductase [2IKG, 1.43Å], Human HIV-1 reverse transcriptase [1UWB, 3.2Å], T4 Lysozyme [3DMX, 1.82Å], Egg-white Avidin [1AVD, 2.7Å] and Bovine Pancreatic Trypsin [1S0R, 1.02Å] (also see Table S10; supporting information). The crystal waters were removed. All hydrogen atoms and water molecules were added using MOLARIS.
The partial atomic charges of the ligands were determined from the electronic wave functions by fitting the resulting electrostatic potential in the neighborhood of these molecules by the restrained electrostatic potential (RESP) procedure.54 The electronic wave functions were calculated with hybrid density functional theory (DFT) at the B3LYP/6-31G** level, performed with the Gaussian03 package.55
For protein complexes with a metal ion in their binding pocket, a moderate harmonic distance constraint of K =10 kcal mol−1Å−2 was introduced between the metal ion and the atoms of interacting residues spanning the coordination sphere of this metal ion. This constraint guarantees that the local crystal structure around the metal ion will not be drastically perturbed during the MD simulation. This is important as our study is not focused on the challenging issue of how one can reproduce the crystal structure of highly charged systems, but on evaluating the energetics of such systems. Consequently, we prefer to use relatively weak constraints that force the calculated protein structure to stay close to the observed structure, evaluating the energy of this conformational region rather than spending much longer simulation time allowing the system to move into other regions of the conformational space. Despite our experience in using advanced approaches where the metal ion is treated with a six-center dummy atom model,56,57 we used here a simpler model where all the charge is placed on the metal. This seems justified since the metal ions are not in direct contact with the ligands.
Each simulated protein complex system (that includes the protein, bound ligand, water and langevin dipoles) was initially equilibrated for 2ps at 300°K with a time steps of 0.5fs using the program ENZYMIX in its standard setting. The spherical inner part of the system with radius 18Å was constrained by a weak harmonic potential of the form, , with A =0.01 kcal mol−1Å−2 to keep the protein atoms near the corresponding observed positions. The protein atoms outside this sphere were held fixed and their electrostatic effects excluded from the model.
It is useful to point out that it is not enough to have the observed crystal structures, since we must reproduce the local structural relaxation upon ‘charging’ the ligand and this information is not available from most structural studies. The rms deviation of the relaxed structure from the crystal structure was within 0.6Å, on an average.
In cases where a crystallographic structure was not available for the protein-ligand complex, the ligand position was generated from the structure of an available crystallographically bound ligand as a template (see Table S10; supporting information). The resulting structure was used as the starting point in docking studies. The corresponding docking procedure was performed with AutoDock 4.0.58 The program performed automated docking of flexible ligands to a receptor by rapid energy evaluation achieved by precalculating atomic affinity potentials for each atom type. The automated docking of the ligands to their respective protein structure was carried out by using the standard protocol. The ligands were prepositioned within the binding pocket based on the knowledge from x-ray crystallographic structure of similar ligand bound to its protein. The AutoDock 4.0 program was run to find the best complex conformations and the best binding sites with a rigid receptor structure. One hundred independent docking runs were performed to find the best inhibitor-receptor binding mode. The selection of a given preferred docking mode was consistent with the available biological data, rather than being on computational results alone. The final structures of docking were used as the starting structures for MD simulation of complexes.
The simulation system for the PDLD/S-LRA, LRA and LIE models were treated in the same way at the stages of the explicit simulations. This was done by using the standard MOLARIS Surface Constrained All-Atom Solvent (SCAAS)59 boundary conditions and the Local Reaction Field (LRF) long-range treatment.60 The boundary condition for the protein system is described in Figure 2. This involved a simulation sphere of 18Å with a 2Å surface constraint region surrounded by a 2Å Langvin dipole surface embedded in a bulk continuum. The MD simulations were performed with the built in polarizable ENZYMIX forcefield.10,11 The PDLD/S simulation system involved the replacement of the explicit water in the SCAAS model by the Langevin dipoles.
Figure 2.

Illustrating the construction of the explicit SCAAS simulation system on the crystal structure (PDB ID:1K1L) of bovine trypsin (flat ribbon) in complex with the cocrystallized inhibitor (stick) is solvated in water molecules (ball and stick) representing the model system used in the study. In PDLD/S-LRA/β, Region I is the ‘inhibitor’ or the group whose electrostatic energy is of interest, region II includes all protein residues within 18Å cutoff radius from the center of region I. Region III includes explicit water molecules in and around regions I and II and is completed by a 2Å surface which is subjected to polarization and radial constraints. This is surrounded by bulk solvent (region IV) with a high dielectric constant (ε =80). The electrostatic effects of regions I, II and III are treated explicitly while those of region IV are treated by a macroscopic continuum formulation.
The PDLD/S-LRA/β calculations involved the usual procedure. (e.g., see ref11). This required running MD simulations to generate protein configurations for the charged and uncharged ligand l times and then, averaging the 2* l PDLD/S results for the generated configurations. The calculations were performed with the automated MOLARIS procedure, using l = 20 (i.e. 20 sets of configurations) with 1000 MD steps (1ps for each generated configuration with 1fs time step at 300°K).
The LRA/β and LIE simulations were also performed using the MOLARIS software package, running first 40ps relaxation followed by 20ps data collection steps (with time steps of 1fs at 300°K) for the charged ligand. In the case of LRA/β, additional 20ps simulations were carried out for the uncharged ligand. For convenience purposes, we used the same production run that generated the PDLD/S-LRA/β results, to collect the LRA/β and LIE results. This means that the 20ps were collected from segments of 1ps. We also ran longer LRA/β and LIE studies (60ps runs) and obtained less than 2 kcal/mol difference in the estimation of the binding free energies. One reason for the stability of the results is the use of SCAAS boundary conditions.
The binding energy of ligands to their respective receptors depends on the protonation states of the protein.61 Therefore, the proper choice of the ionization states of the amino acid residues within the binding pocket is important for reproducing a reasonable binding energy. In order to determine the ionization state of the ionizable residues around the inhibitor, we used the approach described in refs10,50. This was done using the ‘titra_pH’ routine of the POLARIS program package.9,10 If the probability of a group to be charged at pH 7 was ≥50%, it was considered to be charged. The pKa calculations were carried out in the presence of the ligand. The effect of the change in pKa between the bound and the unbound states was examined and was found to be significant in some LRA/β and LIE calculations (e.g. in the case of HIV protease with DMP323, it changes the results by ~3 kcal/mol). However, in the case of PDLD/S-LRA was found to be relatively small due to the use of ε p = 20 for the charged ligands.
II.3. CONFIGURATIONAL ENTROPY CALCULATIONS
Since our study also involves an analysis of the MM/PBSA approach, we had to obtain, in some cases, reliable estimates of the binding entropies. The corresponding estimates were obtained by our RR approach.62–65
Since the RR approach has been described extensively and also, recently formally analyzed66 to demonstrate its validity beyond the harmonic case, we discuss here only the main points. The RR approach imposes strong harmonic Cartesian restraints (with constraint coordinate vector R̄) on the position of all of the ligand atoms in water (unbound, UB) and the same within the protein active site (bound, B). This is followed by the evaluation of the free energy associated with the release of these restraints by means of the FEP approach. This procedure is repeated for different sets of Cartesian constraints and the lowest RR energy is taken as the best estimate of the configurational entropy. This treatment is needed since the RR free energy contains enthalpic contributions and that these contributions approach zero for the restraint coordinates that give the lowest RR free energy. Thus, our RR contribution may be written as:
| (14) |
where ‘min’ indicates the minimum value of the indicated ΔG RR. Here, ΔS cage is the entropy associated with applying a special restraint ( K=0.3 kcal mol−1Å−2) to a central atom in the ligand thus, keeping it at a reasonable place during the RR procedure. The effect of releasing the constraint is then evaluated analytically.65
The computational cost of Eq. 14 can be reduced significantly by taking advantage of the fact that, for strong and medium constraint, we can use the QH approximation67,68 to estimate the entropic contribution (although the QH approximation is problematic for weak constraints). Thus, we can write:
| (15) |
where the − TΔS(K= K 1) QH designates the entropy computed by the QH approximation, where K 1 is the initial value of the restraint and min indicates the minimum value of the indicated ΔG RR. This approach has been successfully exploited in the studies of ribosome,64 a series of substituted phosphate diesters69 and more recently, in calculations of solvation entropies.66
The calculations of the configurational entropy started with running initial relaxation runs on the bound and unbound states, followed by running longer runs (80ps) to generate restraint coordinate vector R̄ at each 10ps interval. Overall, 8 restraint coordinates were generated for both bound and unbound states. The QH calculations were performed with K=10 kcal mol−1Å−2 on the generated restraint coordinates for both states. This was followed by the RR calculations for these R̄ s. The RR-FEP calculations were performed with an 18Å simulation sphere of explicit water molecules subject to the surface constraint all-atom solvent (SCAAS) boundary conditions.10 The RR-FEP involved the release of the position restraints in 4 FEP stages, changing K1 from 10 to 0.003, where all the values of K1 are given in kcal mol−1Å−2. These simulations consisted of 41 windows (see entropy calculation section; supporting information) each with a simulation time of 40ps and were done at 300°K with 1fs time step. The minimum value was then taken from 8 series of runs.
All of the calculations were performed on the University of Southern California High Performance Computing and Communication (USC-HPCC) Linux computer, using the Dual Intel P4 3.0 GHz 2GB memory nodes.
III. RESULTS AND DISCUSSION
For a computational method to be useful in drug screening, it must not only predict binding affinity of diverse ligands accurately, but also rank them correctly in cases of similar compounds. Although currently employed docking methods can orient and score small molecules based on their shape and complementarity to the binding site, there are critical issues with respect to conformational sampling both for the ligand and the receptor, as well as the validity of the scoring functions. Currently, for high throughput docking, scoring functions either contain adjustable parameters that are determined by fitting to many crystal complexes with available experimental binding affinities (empirical) or are derived from the statistical analysis of the interaction distances between different atom types in the crystal structures of protein-ligand complexes (knowledge-based). In principle, one can obtain more reliable screening by using more accurate physics-based computer simulation methods. However, obtaining reliable results by such methods is very challenging. Additionally, it is important to find the proper balance between computer time and accuracy to be useful for virtual screening.
In view of the above considerations, we examined here several physically based methods by evaluating the binding affinities of 22 protein-ligand complexes (the structures of the relevant ligands are given in Figure 3). In cases where crystallographic or NMR structure for the protein-ligand complex was not available, binding orientations for ligands were obtained by docking studies. Here, we also address the problem of predicting free energies of structurally diverse ligands. We have examined smaller as well as larger and more flexible ligands (see Figure 3). The calculations were performed with the default value of β (i.e. β=0.25) as well as with β that was optimized differently for each protein. The calculated binding free energies obtained by the PDLD/S-LRA/β, LIE and LRA/β methods are summarized in Table 1 (see Figure 4; also see Tables S1–S2 in the supporting information).
Figure 3.

Structural formulae for the ligands used in this study. All structural formulae were drawn using ChemDraw Ultra 11.0.109
Table 1.
Calculated PDLD/S-LRA/β, LRA/β and LIE absolute binding free energies and the corresponding observed values.a
| Enzyme/class | PDLD/S-LRA/β | LRA/β | LIE | |||||
|---|---|---|---|---|---|---|---|---|
| εp = 4 (εp = 20) β=0.25 (default) | εp = 4 (εp = 20) (fitting) | Fast version ε p = 4 (ε p = 20) β=0.25 (default) | εp = 1 β=0.25 (default) | εp = 1 (fitting) | εp = 1 β=0.25 (default) | εp = 1 (fitting) | ||
| Chorismate mutase (Isomerase)103 | β=0.30 | β=0.50 | β=0.51 | |||||
| 1* | −15.50 (−8.68) | −15.99 (−9.17) | −15.53 (−8.59) | −8.15 | −8.39 | −6.16 | −7.32 | −8.30 |
| 2* | −15.44 (−8.80) | −15.87 (−9.23) | −19.65 (−12.76) | −8.74 | −9.00 | −8.47 | −9.07 | −9.00 |
| 3* | −4.94 (−4.66) | −5.11 (−4.83) | −5.20 (−4.52) | −5.22 | −3.92 | −5.11 | −4.74 | −5.00 |
| Thrombin (Hydrolase)82 | β=0.30 | β=0.35 | β=0.41 | |||||
| 4* | −8.67 (−9.99) | −10.26 (−11.59) | −8.99 (−10.21) | −12.85 | −11.55 | −10.06 | −11.55 | −11.42 |
| 5* | −9.46 (−10.06) | −11.29 (−11.89) | −9.20 (−9.72) | −9.09 | −9.99 | −6.58 | −9.47 | −11.41 |
| Trypsin (Hydrolase)82 | β=0.26 | β=0.35 | β=0.45 | |||||
| 6* | −8.35 (−7.77) | −8.56 (−7.98) | −9.01 (−8.62) | −9.37 | −8.24 | −7.27 | −8.62 | −8.69 |
| 7* | −10.39 (−9.94) | −10.56 (−10.11) | −10.42 (−9.32) | −10.72 | −9.37 | −9.59 | −9.15 | −9.75 |
| 8* | −10.68 (−10.49) | −10.93 (−10.74) | −10.84 (−9.98) | −10.97 | −9.56 | −11.55 | −11.57 | −10.20 |
| Renin (Aspartyl protease)104 | β=0.22 | β=0.40 | β=0.53 | |||||
| 9 | −9.55 | −9.12 | −9.19 | −10.16 | −9.44 | −9.76 | −9.75 | −9.78 |
| 10 | −10.28 | −9.72 | −9.98 | −9.56 | −9.07 | −9.50 | −9.41 | −9.77 |
| 11 | −8.64 | −8.15 | −8.50 | −8.15 | −7.71 | −7.23 | −8.72 | −7.50 |
| HIV Protease (Aspartyl protease)105 | β=0.25 | β=0.51 | β=0.64 | |||||
| 12 | −10.34 | −10.34 | −8.69 | −10.88 | −10.40 | −6.89 | −10.39 | −10.40 |
| Aldose Reductase (Oxidoreductase)106 | β=0.30 | β=0.25 | β=0.25 | |||||
| 13* | −8.69 (−7.12) | −9.91 (−8.34) | −6.70 (−5.50) | −8.30 | −8.30 | −8.32 | −8.32 | −8.46 |
| Trypsin (Hydrolase)107 | β=0.30 | β=0.60 | β=0.80 | |||||
| 14* | −3.24 (−4.16 ) | −3.76 (−4.68) | −3.37 (−4.43) | −6.46 | −6.23 | −4.34 | −6.00 | −6.35 |
| T4 lysozyme (Hydrolase) 83,93,108 | β=0.33 | β=0.80 | β=0.80 | |||||
| 15 | −4.34 | −5.08 | −2.92 | −3.23 | −4.50 | −3.16 | −4.40 | −5.19 |
All binding free energies are in kcal/mol.
All charged ligands have been denoted by ‘*’. Note that ‘α’ denotes the electrostatic term in our study while it represents the non-electrostatic β term in studies by Åqvist and coworkers13,42 In the PDLD/S-LRA/β studies, the first column corresponds to the calculations where the protein groups are ionized with εp = 4, and εp = 20, the second column provides fitted values for column 1 and the third column corresponds to the fast version described in the main text. (For details, see Table S1 and S2; supporting information).
Figure 4.

Correlating the calculated and the experimentally observed absolute binding free energies obtained by the PDLD/S-LRA/β, the LRA/β and the LIE methods using default values i.e. same β (graphs a, c and d) and fitted values i.e. variable β (graphs b, d, and e). Note that in PDLD/S-LRA/β approach, we used ε p = 20 for the charged ligands.
The PDLD/S-LRA/β calculations of polar but uncharged ligands were performed using εp = 4, which is justified only when the full LRA procedure is applied (as discussed in ref48; this has little to do with the incorrect argument that εp = 4 is justified in regular PB treatments). The charged ligands were studied both with ε p = 4 and ε p = 20. As discussed elsewhere (see ref21,48), in highly charged systems it is hard to obtain sufficient reorganization from standard simulations and it is useful to obtain the corresponding effect implicitly by using higher dielectric constant. We also explored an additional model, which involves a two-step procedure. In this model, we convert the charged ligand to its neutral form, evaluate the electrostatic term with ε p = 4 and add the change in energy upon charging the ligand using macroscopic Coloumb’s law with an effective dielectric (ε eff = 20). This approach has been found to be effective in the studies of the charged molecules.21,48 The results of the third model are given in the supporting information (see Table S1).
In addition to the full PDLD/S-LRA/β approach, we also examined a fast version that involves running 4ps MD simulations (only 2 configurations for the charged and uncharged terms in the electrostatic calculations). The results are summarized in Table 1.
In discussing computational results, it is always important to establish the error range. This has been done in our group since the early 80s, where we examined the effect of changing the boundary conditions and long range treatment,60,70,71 the effect of increasing the simulation time72,73 and the effect of changing different simulation parameters.71 In our view, “stability” analysis (with regards to the above factors) is superior to statistical measures of the error range. An example of a part of some aspects of our approach is given in ref60,70–74. In the present case (and in earlier studies), we establish an error range of ~3 kcal/mol for the stability of the results of the PDLD/S-LRA/β method. However, this error range is not equal to the accuracy.
Overall, the PDLD/S-LRA/β approach with ε p =4 performs remarkably well for uncharged ligands. However, for charged ligands and particularly, in the case of Chorismate mutase (which is doubly charged), the version with ε p = 20 performs well and was taken as our default model. As seen from the Table and from Figure 4 the PDLD/S-LRA/β performs extremely well even without optimizing β.
The microscopic LRA/β and LIE gave reasonable results only after optimizing β for each protein separately. This is a customary approach in LIE studies and it justified in part since many screening efforts involve many drugs and a single target. It is noteworthy, however, that in previous studies we obtained (in case with a single proteins and several drugs) more accurate results by the LRA/β and LIE than by the PDLD/S-LRA/β and that LRA studies gave quite impressive results.75 However, the present work compares very different cases rather than focusing on the binding to a single protein structure.
In an attempt to improve upon the time required to calculate the absolute binding free energies, we also compared the performance of the PDLD/S-LRA/β method with that of a faster version described above. As is evident from Table 2, the computer time needed by the PDLD/S-LRA/β approach can be significantly reduced without drastically affecting the accuracy (see Table 1). The reason for the success of the PDLD/S-LRA/β is the ability to capture the electrostatic effects without extensive simulations.
Table 2.
The performance times of the different methods under study. a
| PDLD/S-LRA/β | LRA/β | LIE | PDLD/S-LRA/β (fast version) | |
|---|---|---|---|---|
| Water sampling (MD) | - | 40ps (56.56 min) | 20ps (28.28 min) | - |
| Protein sampling (MD) | 40ps (76.42 min) | 40ps (76.42 min) | 20ps (38.21 min) | 4ps (7.64 min) |
| PDLD/S calculations | 12.2 min | - | - | 1.22 min |
The results reported here are for a protein of ~170 amino acid residues. We prepare the system with a 40ps relaxation run (takes ~108.4 min). The calculations were conducted on the University of Southern California HPCC (High Performance Computing and Communication) Linux computer, using the Dual Intel P4 3.0 GHz 2GB Memory nodes.
The comparison of the PDLS/S-LRA/β and the more microscopic LRA/β and the LIE approaches require further studies, including probably full FEP calculations to detect the origin of the larger deviations. Also, since the binding process involves a change in the number of internal water molecules, this process is probably associated with a slow relaxation time. In order to overcome this challenge, we introduced recently the cycle shown in Figure 15.8 of ref,76 where the ligand was mutated to water molecules in both the protein active site and in the solution. However, more studies along this line are out of the scope of the present work.
The semi-quantitative success of the PDLD/S-LRA/β approach suggests that it may be instructive to compare this approach to the more popular molecular mechanics poisson–boltzmann (PB) and surface area (MM/PBSA) methods. Briefly, the MM/PBSA estimates the binding free energies by using a mixed scheme combining limited configurations sampled by MD simulations with explicit solvent, together with solvation energy estimation based on an implicit PB continuum solvent model77 and an estimate of the non-polar free energy with a simple surface area term.78 The MM/PBSA estimates the solute entropy (ΔS ) by QH approaches or normal mode analysis of harmonic frequencies.14 One must note that the MM/PBSA treatment (excluding the entropy calculations) is similar in many respect to the earlier PDLD/S-LRA approach, except that the latter uses a more consistent LRA averaging as well as a more consistent dielectric treatment (see the discussion in this work and in ref79).
One must note that although the PB models give fair results when dealing with surface groups (where the solvation free energy is similar to that for the solvation in water), they become problematic when dealing with the inhomogenous and preoriented nature of the interiors of the protein. Additionally, the PB results strongly depend on the assumed dielectric constant which is treated arbitrarily and usually inconsistently in the PB treatment (see discussion in ref48,80). On the other hand, the PDLD/S-LRA/β treats ε p while considering the protein reorganization explicitly and thus, provides fairly consistent method. When the MM/PBSA uses ε p = 1, it is likely to miss the compensation effects due to the protein reorganization and water penetration which is not captured by limited sampling and more seriously, by not using an LRA or FEP type approach.
In order to assess the relative performance of the PDLD/S-LRA/β and MM/PBSA approaches, we chose a set of HIV1-RT inhibitors as well as two biotin analogs as a benchmark.31,32 Here, we like to mention that the choice of the two avidin analogs is not arbitrary. We intentionally chose the two compounds whose calculated binding free energies seemed problematic. Thus, these systems present an opportunity to compare the PDLD/S-LRA/β binding free energy and the ligand configurational entropies to the corresponding values calculated by the MM/PBSA approach reported in refs.31,32 The results are summarized in Table 3.
Table 3.
The absolute binding free energy and configurational entropy calculations for a set of biotin analogs and HIV1-RT inhibitors.a
| Enzyme/ligand | (Entropy values not added) |
|
|||||||||||||
|---|---|---|---|---|---|---|---|---|---|---|---|---|---|---|---|
| PDLD/S- LRA/β | LRA/β | LIE/β | |||||||||||||
| Avidin (biotin binding protein)32 | β=0.33 | β=0.55 | β=0.81 | ||||||||||||
| 16 | −41.97 | 16.65 | 8.40 | −25.32 | −33.57 | −14.05 | −13.18 | −14.03 | −14.01 | ||||||
| 17 | −33.53 | 22.98 | 7.57 | −10.55 | −25.96 | −14.50 | −14.87 | −13.71 | −14.29 | ||||||
| HIV1-RT inhibitors31 | β=0.30 | β=0.45 | β=0.64 | ||||||||||||
| 18 | −27.60 | 15.64 | 4.90 | −11.96 | −22.70 | −11.74 | −11.79 | −11.85 | −11.87 | ||||||
| 19 | −26.28 | 15.83 | 4.22 | −10.45 | −22.06 | −11.18 | −10.49 | −11.37 | −11.69 | ||||||
| 20 | −27.28 | 15.68 | 5.41 | −11.60 | −21.87 | −10.66 | −10.48 | −10.43 | −10.60 | ||||||
| 21 | −27.72 | 17.61 | 6.82 | −10.11 | −20.90 | −11.67 | −10.66 | −10.74 | −10.44 | ||||||
| 22 | −25.58 | 15.88 | 5.27 | −9.70 | −20.31 | −9.13 | −8.62 | −7.75 | −7.81 | ||||||
All energy values are in kcal/mol.
The does not include the relevant entropic contributions, whereas the does include entropic contributions. The calculated is only for comparison to that calculated in refs31,32 using normal mode (NMODE) analysis. The is the total binding free energy calculated by MM/PBSA with entropy calculated by NMODE analysis where as the is the total binding free energy with entropy calculated by RR method.
Although it appears that combining the binding free energies obtained from MM/PBSA method with the entropy contributions estimated by the normal mode analysis provides reasonable estimate of the absolute binding free energies, one must note that are severely overestimated (for comparison purposes, we provide the more reliable configurational entropy ( ) calculated by our well established RR approach64,66,81). We realize that the problems with the MM/PBSA entropy calculation can be best highlighted by a direct comparison to the estimates obtained by experimental studies, but such estimates are currently not available for the data set presented in this study. However, we already established the reliability of the RR approach in the calculations of the configurational entropy.63,65 Furthermore, in cases where the binding entropies are known 82,83 one finds that the typical values are much smaller than those provided by the MM/PBSA treatment (for the ligands of the size considered here, the observed −TΔS is much smaller than that reported in refs31,32). Thus, a use of correct entropic contributions would lead to major overestimate of the observed binding free energy by the MM/PBSA approach.
Before we continue the analysis of the MM/PBSA method, it is crucial to clarify that the fundamental problem with MM/PBSA entropies is not a controversial issue. We are not discussing here the fact that one may try to use some other approaches (e.g. ref84,85) to get better estimate, since this is not what is done in MM/PBSA calculations. In fact, the problems with the NMODE treatment and the QH estimates were discussed before in analyzing the problems with gas phase entropies.86 We also pointed out the problems with NMODE entropic calculations in solution reaction where we establish by analyzing experiments86 and by comparing the RR calculations to the experiments.65 Regardless of what one like to assume about the reliability of MM/PBSA entropy results,87 the only way to figure this out is by comparing the calculations to the experimental results and not by considering different theoretical estimates. Undoubtedly, the RR calculation is one of the very few approaches that actively reproduces the trend in the observed binding entropies, and at present, is the only approach that can evaluate microscopically the different contributions to binding free energies (configurational and polar and hydrophobic solvation).88 To establish this point, we provide a single result from our work on the binding of benzene to T4 lysozyme to illustrate that even the RR approach slightly overestimates the binding entropy (see Table S11; supporting information). Notably, the RR results only slightly overestimate the observed effects when compared to the NMODE that drastically overestimates the correct entropic effect. Here, we also like to clarify that we are not trying to determine the origin of the overestimate in the entropic results reported in the MM/PBSA calculations ( which might be associated with the treatment of rotational and translational entropy ), but merely pointing out that this approach drastically overestimates the typical values of the observed binding entropies.
The analysis of the absolute binding entropies involves the consideration of the “cratic” free energy. This term has been defined differently by different workers89–93 and has been discussed and analyzed in great length in our works.86,94,95 Our analysis95 has also pointed out the problems in the definition of this term by Kollman and coworkers (e.g. ref92); including having a protein dependent entropy of a process that occur in water where there is no information about the process in the protein (see ref86). We bring this point here to clarify that we are well aware of the issue of cratic entropy and the possible confusions with this term. In fact, this issue has been addressed very early in our cage concept since 1978.45,62 However, the possible confusion in this respect is irrelevant to our studies of the absolute binding free energies, since we have paid special attention to the thermodynamic cycle (e.g. Figure 1 in this work as well as in ref 11) for the proper entropic contributions in each step (see ref88).
We also like to clarify that at present, despite significant progress in quantitative calculations of the ligand configurational entropies in proteins62,93,96 and in model compound,97 we are not aware of accurate calculations of the total binding entropies in proteins (at least we are not aware of works that reproduce solvation entropy contribution in studies of ligands binding to proteins, with the exception of ref66). Thus, one need (at least, temperately) a way to include this effect implicitly, and one of the ways is to use a parametric approach, which is what the β term is about. Of course, we should strive to identify the physical equivalent of β 11 or to complete the uncharged cycle in Figure 1, but this is not the subject of the present work.
Following the above discussion, we can return to Table 3, to point out that the MM/PBSA method gives incorrect absolute binding free energy once the incorrect NMODE entropies are replaced by reasonable entropic estimates calculated by the RR approach.
As a general note about the calculations of Table 3, we would like to point out that the calculations for the complexes with experimentally determined structures gave comparable results to those for which binding mode of ligand was deduced by docking. The observed binding mode of the experimentally available structure (compound 18) and the docked ligands (compounds 19-22) is shown in Figure 5. An analysis of the best docking modes for the docked tetrahydroimidazo[4,5,1-jk][1,4]-benzodiazepin-2(1H)-one (TBO) analogues revealed that they exhibited common binding characteristics, which may be due to their close structural similarity.
Figure 5.
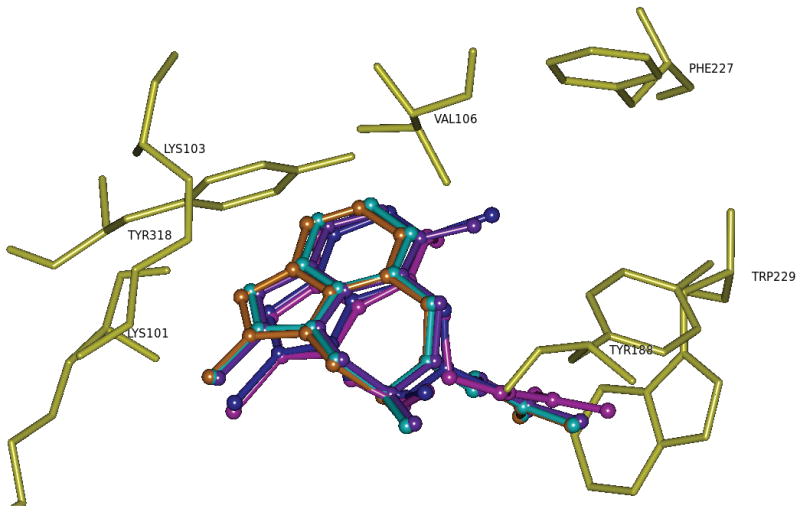
The observed binding mode for compound 18 (TBO) and its analogs, 19-22 (the structures of which were obtained by docking studies) within the active site of HIV-1 RT. Different structures have been color coded: 18 blue; 19 purple; 20 lavender; 21 cyan; and 22 orange. Hydrogen atoms are not shown for clarity purposes.
After defining the problem with the MM/PBSA entropies, we turn to the possible argument that, perhaps the method gives reasonable absolute binding energies only with the incorrect entropy values. We further focus on the problem with the electrostatic treatment of the MM/PBSA. This is done by examining two different systems; namely HIV-1 RT and Avidin and calculating the binding free energies of these cases chosen to include ligands with and without strong electrostatic interactions (see Table 3). Notably, of the several ligand binding affinities calculated using different simulation methods by the MM/PBSA reported in ref32, we use the results obtained by the method that the authors consider to be the closest to the results reported in ref15 (this reference calculates the binding free energies of the same compounds using the MM/PBSA). Interestingly, all of the predictions using different simulation methods in ref32 have a high range of error (the authors themselves report that “the maximum error in the best calculations is 14–47 kJ/mol”). Nevertheless, as one of the referees suggested, since for the same ligand the results of ref32 are different for different simulation methods and therefore, their consideration may represent a bias, we also considered binding studies of Kuhn and Kollman.15 Although this work appeared to give reasonable results for the charged ligands, it gave a deviation of ~7 kcal/mol for one of the neutral ligands. Furthermore, the results for charged ligands that appear reasonable represent a deviation of >10 kcal/mol where one uses reasonable entropy (see below).
At any rate, the reported results from the MM/PBSA include cases with deviations of 7–15 kcal/mol, which underlines the fact that the MM/PBSA have cases with very large deviations, regardless of whether the entropy is corrected or not. We are not sure what the origin of the problems is, but it seems clear that their electrostatic treatment is problematic. That is, using a PB treatment with dielectric of 1 simply cannot work with limited average on one state, as was shown in ref48. In fact, the MM/PBSA was, to the best of our knowledge, never verified by reproducing any known electrostatic energy (e.g. pKa calculations) and is unlikely to do so. Now, regardless of the origin of the problems in the MM/PBSA, we establish that this method may have very large errors in certain cases whereas the PDLD/S-LRA/β has much smaller errors.
In order to further establish the point of Table 3, we also considered the binding of 2-(4′-hydroxyazobenzene) benzoic acid (HABA) in its two tautomeric forms (for structures see Figure S in supporting information), to Avidin studied by Kuhn and Kollman, where they obtained an error of 4 kcal/mol in the azo form as against 17 kcal/mol in the hydrazone form (the reported experimental binding free energy is −7.1kcal/mol98). Using the PDLD/S-LRA/β, we obtained the binding free energies of the two tautomeric states as: −6.21 kcal/mol (azo) and −6.55 kcal/mol (hydrazone) which seem more realistic than those mentioned above.
The comparison of the trend obtained by the PDLD/S-LRA/β and the MM/PBSA is given in Figure 6. As is clear from the figure, besides the problem with the entropic effect, the MM/PBSA has other major issues, for instance, the lack of LRA treatment and the selection of ε p. Particularly, the problem with dielectric is observed with Avidin (the point at −25 kcal/mol for the MM/PBSA; see Figure 6) where the need of a dielectric screening is obvious as the MM sampling does not provide sufficient convergence to account for full protein relaxation and water penetration. The same is true with regard to the fact that the MM/PBSA does not use a proper LRA formulation, and consequently compensating for the missing non-polar term again requires the use of same implicit dielectric (see ref48).
Figure 6.
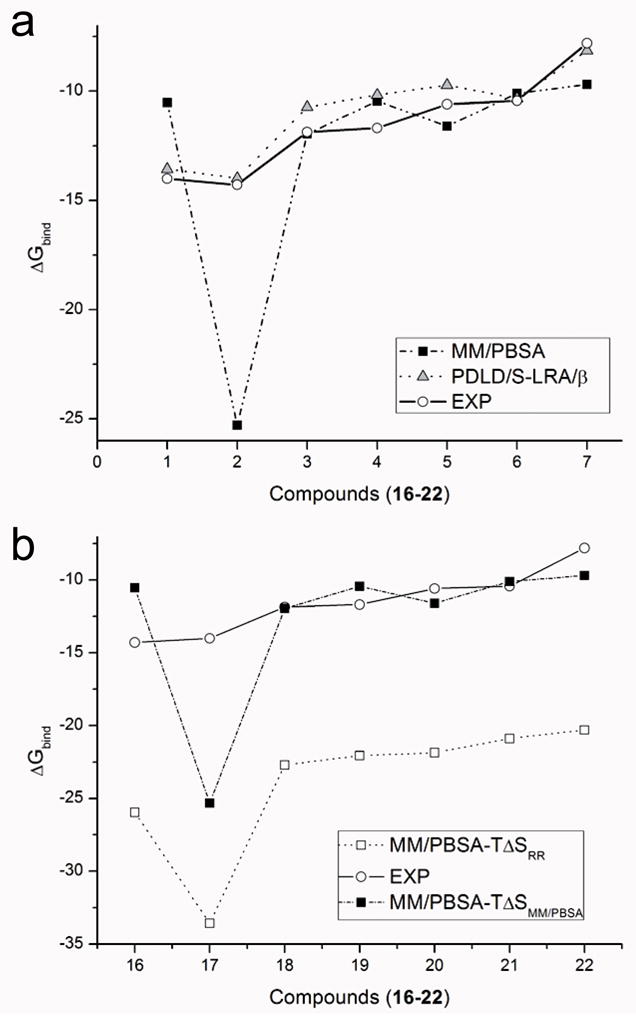
(a) A comparison of the experimental absolute binding free energies for compounds 16-22 to those obtained by MM/PBSA and the corresponding values calculated by PDLD/S-LRA/β approach (also see Table 3). (b) Illustrating the fact that the MM/PBSA appears to provide reasonable results for some molecules only because of the major overestimate of the entropic effect by comparing the absolute binding free energy calculated by MM/PBSA reported in the literature31,32 to the absolute binding free energies calculated by replacing the MM/PBSA entropy with the entropy calculated by the RR method for compounds (16-22). The experimentally determined absolute binding free energies are also provided.
The problems with the MM/PBSA highlighted here are not hypothetical ones that depend on finding specific cases with large deviations in the calculated binding energy. First, all the works we examined have large deviations in the calculated MM/PBSA energies. Second, the problems, in addition to the entropy issue, are too fundamental to be considered as a minor reflection of a specific protocol. In particular, it is important to clarify the setback in the electrostatic model used in this method. That is, the MM/PBSA evaluates the electrostatic energy by using <Emm> (the average of the molecular mechanics (mm) electrostatic potential with the charged ligand) plus the PB contribution from the surrounding solvent, minus the continuum base electrostatic energy of the ligand in solution. The <Emm> term will give twice the correct electrostatic free energy (which is <Emm>/2). For example, if we have a charged ligand in a region far from the solvent (so that the PB contribution is small) with electrostatic free energy in the protein of −50 kcal/mol (e.g. histidine residue in protein), we will get −100 kcal/mol and since the solvation in solution is reasonable (being evaluated by a continuum model), we will get an error of −50 kcal/mol. In fact, we are not aware of any attempt to validate the MM/PBSA electrostatic calculations. Furthermore, in the case of the free energy of charged groups, the van der Waals energy largely cancels in the charging process, whereas it represents a major contribution in the MM/PBSA. The problem is that the MM/PBSA has not been based on a consistent thermodynamics cycle such as the PDLD/S-LRA, and having inconsistent electrostatic treatment makes it difficult to estimate the van der Waals effect.
IV. CONCLUSION
This work examined the performance of several methods for evaluating the binding free energies of protein-ligand complexes. The data set consisted of both rigid and flexible ligands and included a range of functionally and structurally different proteins, to analyze and compare the performance of available prediction algorithms. Consistent and relatively reliable ranking was achieved with less than 3 kcal/mol maximal deviation in the absolute binding free energy (and much smaller deviation in most cases). It is noteworthy that the PDLD/S-LRA/β gave results of similar quality to those obtained by the LRA/β and LIE methods even without optimized β. Furthermore, an accelerated version of the PDLD/S-LRA/β also gave good results. This is significant since the speed of the PDLD/S-LRA/β can be utilized for the purpose of virtually screening lead molecules from large chemical databases. In this regard, we must mention that this approach is still significantly slower than the approaches used in current massive screening experiments. Nevertheless, this method may be useful in late stages of virtual screening that has reduced the possible structures to a handful of drug candidates (~10–100) where more accuracy is required to fine tune the number of hits to be submitted for biological evaluation. It is useful to point out that a simplified yet physically consistent group contribution version of PDLD/S approach47,99 can be clearly used in the massive screening studies.
In addition to examining the performance of PDLD/S-LRA/β approach, we spent significant effort in comparing the approach to the MM/PBSA method that requires similar computer time and involves key features originally introduced in the PDLD/S-LRA method. We found that the MM/PBSA involves a major problem, as its calculated entropic contributions are drastically overestimated. This was established by comparing the MM/PBSA estimates to the much more reliable RR entropies which has been validated in some cases.63,65 Furthermore, the unrealistic prediction of the MM/PBSA entropies has been established in other cases.86,100 It appears that the MM/PBSA entropies overestimate the relevant binding energies contribution from the binding entropies by more than 10 kcal/mol. The overestimate by −TΔS probably cancels a major overestimate of the other terms in the MM/PBSA treatment.
Recent attempt to improve the MM/PBSA entropic estimate has been reported by Kongsted and Ryde.101 In their paper, they study the biotin binding problem and argue that they can get more consistent entropy by introducing a buffer region in the normal mode treatment. However, the entropy estimates still seem to involve a major overestimate, reflecting the aforementioned problems with normal mode treatment. Accordingly, we believe that if one likes to use the binding entropy (instead of using the empirical β scaling), it is crucial to use more accurate approaches like our RR method. Efforts aimed at reproducing the observed binding entropies are under progress in our group.88
The MM/PBSA calculations have been assumed to be reliable perhaps because the fortuitous success of the absolute binding energy obtained with the incorrect entropic estimate.15,102 It has been implied that the MM/PBSA somehow provides converging free energy results for the Ras -Raf complex,102 which may look more consistent than the PDLD/S-LRA study of the same complex49 that has been assumed in ref102 to mainly represent some electrostatic estimate. While the result of the MM/PBSA study of the Ras Raf complex seem encouraging, it may be useful to address the possible perception that perhaps MM/PBSA are more consistent than the PDLD/S-LRA calculations because they include more explicit MM terms. We start by clarifying a point, which is still overlooked by a large part of the community, namely the fact that the LRA electrostatic calculations provide perhaps the best way to capture the changes of the total protein internal energy upon structural reorganization which play a major role in the Ras-Raf binding.49 In fact, ref49 provided what is at present the most consistent attempt to obtain the binding energy and reorganization effect in protein-protein complexation, considering all the relevant contributions (including entropy hydrophobic and van der Waals effects) in a fully consistent semi-macroscopic cycle (not done by other approaches). The fact that a consistent LRA treatment is relatively complex does not make it an oversimplified approach.
At this point one may wonder that perhaps the use of the MM/PBSA approach with the incorrect entropy values does provide a practical prescription for estimating the binding free energies. However, coming from the direction of physically based models, we like to clarify that there are other major problems with this method due to its treatment of electrostatic energies. The best way to see this point is not by looking at the correlation between the calculated and the observed results, but to focus on cases with major deviation (this has been successful strategy in analyzing pKa calculations and dielectric models).48 Following the same strategy, the avidin-biotin case (see Figure 6) clearly identifies the problems with the MM/PBSA electrostatic while illustrating that this problems do not exist in the PDLD/S-LRA/β.
We do not like to give the impression that our discussion of the problems with the MM/PBSA is hypothetical in nature. We strongly suggest that those who disagree with our assessment should try to validate the MM/PBSA by calculating the electrostatic energy of a buried ionized group (the relevant energetics is given by pKa measurements). To further clarify our point, we like to put across the idea that by taking the PDLD/S-LRA and instead of using ε p =4 and the correct LRA procedure, if one uses ε p =1 and <Emm> while arbitrarily taking the full vdW contribution (although it is clear that the vdW contribution should be scaled), one will obtain the MM/PBSA results. Doing so will amount to converting a fully consistent, well-defined free energy cycle to an arbitrary and evidently incorrect formulation. Thus, it seems to us that the MM/PBSA is merely a problematic version of the earlier and much more consistent PDLD/S-LRA.
In summary, we would like to clarify that the error range of the MM/PBSA seems to be >10kcal/mol for the cases of large deviation,32 where as the error range of the PDLD/S-LRA/β is less than 3 kcal/mol even in the extreme cases, and generally much smaller. However, the present work is clearly not the last word in the studies of binding free energies. In fact, the error range in the microscopic models remains above 2 kcal/mol making accurate screening of ligands, with similar binding affinities, hard to approach. Advances in this direction will require careful analysis of the results of the complete FEP studies of the absolute binding free energies. However, at this stage our main point is the attempt to reemphasize the usefulness of the PDLD/S-LRA/β (also, in its faster version) as an effective tool for screening purposes.
Supplementary Material
Acknowledgments
This work was supported by National Institutes of Health Grant R01 GM24492. The authors thank Dr. Z. T. Chu for his technical assistance throughout this work and Dr. Spyridon Vicatos and Anna Rychkova for their insightful suggestions to improve the manuscript.
Contributor Information
Nidhi Singh, Email: nidhi.singh@usc.edu.
Arieh Warshel, Email: warshel@usc.edu.
References
- 1.Warshel A. Electrostatic basis of structure-function correlation in proteins. Acc Chem Res. 1981;14:284–290. [Google Scholar]
- 2.Warshel A, Åqvist J. Electrostatic Energy and Macromolecular Function. Ann Rev Biophys Chem. 1991;20:267–298. doi: 10.1146/annurev.bb.20.060191.001411. [DOI] [PubMed] [Google Scholar]
- 3.Huang N, MPJ Physics-based methods for studying protein-ligand interactions. Curr Opin Drug Discov Devel. 2007;10:325–331. [PubMed] [Google Scholar]
- 4.Raha K, Merz KM., Jr Calculating binding free energy in protein-ligand interaction. Annual Reports in Computational Chemistry. 2005;1:113–130. [Google Scholar]
- 5.Shoichet BK. Virtual screening of chemical libraries. Nature. 2004;432:862–865. doi: 10.1038/nature03197. [DOI] [PMC free article] [PubMed] [Google Scholar]
- 6.Gohlke H, Klebe G. Approaches to the description and prediction of the binding affinity of small-molecule ligands to macromolecular receptors. Angew Chem Int Ed Engl. 2002;41:2644–2676. doi: 10.1002/1521-3773(20020802)41:15<2644::AID-ANIE2644>3.0.CO;2-O. [DOI] [PubMed] [Google Scholar]
- 7.Kollman P. Free Energy Calculations: Applications to Chemical and Biochemical Phenomena. Chem Rev. 1993;93:2395–2417. [Google Scholar]
- 8.Simonson T, Archontis G, Karplus M. Free energy simulations come of age: protein-ligand recognition. Acc Chem Res. 2002;35:430–437. doi: 10.1021/ar010030m. [DOI] [PubMed] [Google Scholar]
- 9.Lee FS, Chu ZT, Bolger MB, Warshel A. Calculations of antibody antigen interactions - microscopic and semimicroscopic evaluation of the free-energies of binding of phosphorylcholine analogs to Mcpc603. Protein Engg. 1992;5:215–228. doi: 10.1093/protein/5.3.215. [DOI] [PubMed] [Google Scholar]
- 10.Lee FS, Chu ZT, Warshel A. Microscopic and semimicroscopic calculations of electrostatic energies in proteins by the POLARIS and ENZYMIX programs. J Comp Chem. 1993;14:161–185. [Google Scholar]
- 11.Sham YY, Chu ZT, Tao H, Warshel A. Examining methods for calculations of binding free energies: LRA, LIE, PDLD-LRA, and PDLD/S-LRA calculations of ligands binding to an HIV protease. Proteins: Struct Funct Genet. 2000;39:393–407. [PubMed] [Google Scholar]
- 12.Hansson T, Marelius J, Åqvist J. Ligand-binding affinity prediction by linear interaction energy methods. J of Comput-Aided Mol Design. 1998;12:27–35. doi: 10.1023/a:1007930623000. [DOI] [PubMed] [Google Scholar]
- 13.Åqvist J, Hansson T. Estimation of binding free energy for HIV proteinase inhibitors by molecular dynamics simulations. Prot Eng. 1995;8:1137–1144. doi: 10.1093/protein/8.11.1137. [DOI] [PubMed] [Google Scholar]
- 14.Srinivasan J, Cheatham TE, Cieplak P, Kollman PA, Case DA. Continuum solvent studies of the stability of DNA, RNA, and phosphoramidate - DNA helices. J Am Chem Soc. 1998;120:9401–9409. [Google Scholar]
- 15.Kuhn B, Kollman PA. Binding of a diverse set of ligands to avidin and streptavidin: an accurate quantitative prediction of their relative affinities by a combination of molecular mechanics and continuum solvent models. J Med Chem. 2000;43:3786–3791. doi: 10.1021/jm000241h. [DOI] [PubMed] [Google Scholar]
- 16.Gilson MK, Rashin A, Fine R, Honig B. On the calculation of electrostatic interactions in proteins. J Mol Biol. 1985;184:503–516. doi: 10.1016/0022-2836(85)90297-9. [DOI] [PubMed] [Google Scholar]
- 17.Gohlke H, Case DA. Converging free energy estimates: MM-PB(GB)SA studies on the protein-protein complex Ras-Raf. J Comput Chem. 2004;25:238–250. doi: 10.1002/jcc.10379. [DOI] [PubMed] [Google Scholar]
- 18.Massova I, Kollman PA. Combined molecular mechanical and continuum solvent approach (MM-PBSA/GBSA) to predict ligand binding. Perspect Drug Discov Des. 2000;18:113–135. [Google Scholar]
- 19.Pearlman DA. Evaluating the molecular mechanics Poisson- Boltzmann surface area free energy method using a congeneric series of ligands to p38 MAP kinase. J Med Chem. 2005;48:7796–7807. doi: 10.1021/jm050306m. [DOI] [PubMed] [Google Scholar]
- 20.Kuhn B, Gerber P, Schulz-gasch T, Stahl M. Validation and use of the MM-PBSA approach for drug discovery. J Med Chem. 2005;48:4040–4048. doi: 10.1021/jm049081q. [DOI] [PubMed] [Google Scholar]
- 21.Warshel A, Sharma PK, Kato M, Parson WW. Modeling electrostatic effects in proteins. Biochim Biophys Acta. 2006;1764:1647–1676. doi: 10.1016/j.bbapap.2006.08.007. [DOI] [PubMed] [Google Scholar]
- 22.Vajda S, Sippl M, Novotny J. Empirical potentials and functions for protein folding and binding. Curr Opin Struct Biol. 1997;7:222–228. doi: 10.1016/s0959-440x(97)80029-2. [DOI] [PubMed] [Google Scholar]
- 23.Bohm HJ. The development of a simple empirical scoring function to estimate the binding constant for a protein-ligand complex of known three-dimensional structure. J Comput Aided Mol Des. 1994;8:243–256. doi: 10.1007/BF00126743. [DOI] [PubMed] [Google Scholar]
- 24.Eldridge MD, Murray CW, Auton TR, Paolini GV, Mee RP. Empirical scoring functions: I. The development of a fast empirical scoring function to estimate the binding affinity of ligands in receptor complexes. J Comput Aided Mol Des. 1997;11:425–445. doi: 10.1023/a:1007996124545. [DOI] [PubMed] [Google Scholar]
- 25.Gohlke H, Hendlich M, Klebe G. Knowledge-based scoring function to predict protein-ligand interactions. J Mol Biol. 2000;295:337–356. doi: 10.1006/jmbi.1999.3371. [DOI] [PubMed] [Google Scholar]
- 26.Novotny J, Bruccoleri RE, Saul FA. On the attribution of binding energy in antigen-antibody complexes McPC 603, D1.3, and HyHEL-5. Biochemistry. 1989;28:4735–4749. doi: 10.1021/bi00437a034. [DOI] [PubMed] [Google Scholar]
- 27.Böhm H, Stahl M. Rapid empiring scoring functions in virtual screening applications. Med Chem Res. 1999;9:445–462. [Google Scholar]
- 28.Bjørn Brandsdal O, Österberg F, Almlöf M, Feierberg I, Luzhkov VB, Åqvist J. Free energy calculations and ligand binding. Adv Prot Chem. 2003;66:123–158. doi: 10.1016/s0065-3233(03)66004-3. [DOI] [PubMed] [Google Scholar]
- 29.Oprea T, Marshall G. Receptor based prediction of binding affinities. Perspect Drug Discov Des. 1998;9:35–41. [Google Scholar]
- 30.Wilso C, Mace J, Agard D. Computational method for the design of enzymes with altered substrate specificity. J Mol Biol. 1991;220:495. doi: 10.1016/0022-2836(91)90026-3. [DOI] [PubMed] [Google Scholar]
- 31.Wang J, Morin P, Wang W, Kollman PA. Use of MM-PBSA in reproducing the binding free energies to HIV-1 RT of TIBO derivatives and predicting the binding mode to HIV-1 RT of efavirenz by docking and MM-PBSA. J Am Chem Soc. 2001;123:5221–5230. doi: 10.1021/ja003834q. [DOI] [PubMed] [Google Scholar]
- 32.Weis A, Katebzadeh K, Soderhjelm P, Nilsson I, Ryde U. Ligand affinities predicted with the MM/PBSA method: dependence on the simulation method and the force field. J Med Chem. 2006;49:6596–6606. doi: 10.1021/jm0608210. [DOI] [PubMed] [Google Scholar]
- 33.Warshel A. Calculations of Enzymic Reactions: Calculations of pKa, Proton Transfer Reactions, and General Acid Catalysis Reactions in Enzymes. Biochemistry. 1981;20:3167–3177. doi: 10.1021/bi00514a028. [DOI] [PubMed] [Google Scholar]
- 34.Warshel A, Sussman F, Hwang J-K. Evaluation of Catalytic Free Energies in Genetically Modified Proteins. J Mol Biol. 1988;201:139–159. doi: 10.1016/0022-2836(88)90445-7. [DOI] [PubMed] [Google Scholar]
- 35.Zwanzig RW. High-temperature equation of state by a perturbation method. i. nonpolar gases. J Chem Phys. 1954;22:1420. [Google Scholar]
- 36.Valleau JP, Torrie GM. In: Modern Theoretical Chemistry. Berne BJ, editor. Vol. 5. New York: Plenum Press; 1977. [Google Scholar]
- 37.Warshel A, Russell S, Sussman F. Computer simulation of enzymatic reactions. Israel Journal of Chemistry. 1986;27:217–224. [Google Scholar]
- 38.Warshel A, Sharma PK, Chu ZT, Åqvist J. Electrostatic Contributions to Binding of Transition State Analogues Can Be Very Different from the Corresponding Contributions to Catalysis: Phenolates Binding to the Oxyanion Hole of Ketosteroid Isomerase. Biochemistry. 2007;46:1466–1476. doi: 10.1021/bi061752u. [DOI] [PubMed] [Google Scholar]
- 39.Kubo R, Toda M, Hashitsume N. Statistical Physics II: Nonequilibrium Statistical Mechanics. Berlin: Springer-Verlag; 1985. [Google Scholar]
- 40.Hwang JK, Warshel A. Microscopic examination of free-energy relationships for electron transfer in polar solvents. J Am Chem Soc. 1987;109:715–720. [Google Scholar]
- 41.Kuharski RA, Bader JS, Chandler D, Sprik M, Klein ML, Impey RW. Molecular model for aqueous ferrous ferric electron transfer. J Chem Phys. 1988;89:3248–3257. [Google Scholar]
- 42.Åqvist J, Hansson T. On the Validity of Electrostatic Linear Response in Polar Solvents. J Phys Chem. 1996;100:9512–9521. [Google Scholar]
- 43.Morreale A, de la Cruz X, Meyer T, Gelpi JL, Luque FJ, Orozco M. Partition of protein solvation into group contributions from molecular dynamics simulations. Proteins:Struct Funct Bioinf. 2005;58:101–109. doi: 10.1002/prot.20292. [DOI] [PubMed] [Google Scholar]
- 44.Hummer G, Szabo A. Calculation of free energy differences from computer simulations of initial and final states. J Chem Phys. 1996;105:2004–2010. [Google Scholar]
- 45.Warshel A. Computer Modeling of Chemical Reactions in Enzymes and Solutions. New York: John Wiley & Sons; 1991. [Google Scholar]
- 46.Aqvist J, Luzhkov VB, Brandsdal BO. Ligand binding affinities from MD simulations. Accounts Chem Res. 2002;35:358–365. doi: 10.1021/ar010014p. [DOI] [PubMed] [Google Scholar]
- 47.Ishikita H, Warshel A. Predicting drug-resistant mutations of HIV protease. Angew Chem Int Ed. 2008;47:697–700. doi: 10.1002/anie.200704178. [DOI] [PubMed] [Google Scholar]
- 48.Schutz CN, Warshel A. What are the dielectric ‘constants’ of proteins and how to validate electrostatic models. Proteins: Struct Funct Genet. 2001;44:400–417. doi: 10.1002/prot.1106. [DOI] [PubMed] [Google Scholar]
- 49.Muegge I, Schweins T, Warshel A. Electrostatic Contributions to Protein-Protein Binding Affinities: Application to Rap/Raf Interaction. Proteins: Struct Funct Genet. 1998;30:407–423. doi: 10.1002/(sici)1097-0134(19980301)30:4<407::aid-prot8>3.0.co;2-f. [DOI] [PubMed] [Google Scholar]
- 50.Sham YY, Chu ZT, Warshel A. Consistent calculations of pKa’s of ionizable residues in proteins: Semi-microscopic and microscopic approaches. J Phys Chem B. 1997;101:4458–4472. [Google Scholar]
- 51.Cruickshank DW. Remarks about protein structure precision. Acta Crystallogr D Biol Crystallogr. 1999;55(Pt 3):583–601. doi: 10.1107/s0907444998012645. [DOI] [PubMed] [Google Scholar]
- 52.Cruickshank DW. Remarks about protein structure precision. erratum. Acta Crystallogr D Biol Crystallogr. 1999;55:1108. doi: 10.1107/s0907444999004308. [DOI] [PubMed] [Google Scholar]
- 53.Berman HM, Westbrook J, Feng Z, Gilliland G, Bhat TN, Weissig H, Shindyalov IN, Bourne PE. The Protein Data Bank. Nucleic Acids Res. 2000;28:235–242. doi: 10.1093/nar/28.1.235. [DOI] [PMC free article] [PubMed] [Google Scholar]
- 54.Bayly CI, Cieplak P, Cornell WD, Kollman PA. A well-behaved electrostatic potential based method using charge restraints for deriving atomic charges: the RESP model. J Phys Chem. 1993;97:10269–10280. [Google Scholar]
- 55.Frisch MJ, Trucks GW, Schlegel HB, Scuseria GE, Robb MA, Cheeseman JR, Montgomery JA, Vreven JT, Kudin KN, Burant JC, Millam JM, Iyengar SS, Tomasi J, Barone VBM, Cossi M, Scalmani G, Rega N, Petersson GAHN, Hada M, Ehara M, Toyota K, Fukuda RJH, Ishida M, Nakajima T, Honda Y, Kitao O, Nakai HMK, Li X, Knox JE, Hratchian HP, Cross JB, Adamo CJJ, Gomperts R, Stratmann RE, Yazyev O, Austin AJRC, Pomelli C, Ochterski JW, Ayala PY, Morokuma KGAV, Salvador P, Dannenberg JJ, Zakrzewski VGSD, Daniels AD, Strain MC, Farkas ODKM, Rabuck AD, Raghavachari K, Foresman JBJVO, Cui Q, Baboul AG, Clifford S, Cioslowski JBBS, Liu G, Liashenko A, Piskorz P, Komaromi IRLM, Fox DJ, Keith T, Al-Laham MA, Peng CYAN, Challacombe M, Gill PMW, Johnson BWC, Wong MW, Gonzalez C, Pople JA. Gaussian 03, Revision C.03. 2004 [Google Scholar]
- 56.Åqvist J, Warshel A. Free energy relationships in metalloenzyme-catalyzed reactions calculations of the effects of metal ion substitutions in Staphylococcal nuclease. J Am Chem Soc. 1990;112:2860–2868. [Google Scholar]
- 57.Oelschlaeger P, Klahn M, Beard WA, Wilson SH, Warshel A. Magnesium-cationic dummy atom molecules enhance representation of DNA polymerase beta in molecular dynamics simulations: Improved accuracy in studies of structural features and mutational effects. J Mol Biol. 2007;366:687–701. doi: 10.1016/j.jmb.2006.10.095. [DOI] [PMC free article] [PubMed] [Google Scholar]
- 58.Morris GM, Goodsell DS, Halliday RS, Huey R, Hart WE, Belew RK, Olson AJ. Automated docking using a lamarckian genetic algorithm and and empirical binding free energy function. J Comp Chem. 1998;19:1639–1662. [Google Scholar]
- 59.King G, Warshel A. A surface constrained all-atom solvent model for effective simulations of polar solutions. J Chem Phys. 1989;91:3647–3661. [Google Scholar]
- 60.Lee FS, Warshel A. A local reaction field method for fast evaluation of long-range electrostatic interactions in molecular simulations. J Chem Phys. 1992;97:3100–3107. [Google Scholar]
- 61.Gómez J, Freire E. Thermodynamic mapping of the inhibitor site of the aspartic protease endothiapepsin. J Mol Biol. 1995;252:337–350. doi: 10.1006/jmbi.1995.0501. [DOI] [PubMed] [Google Scholar]
- 62.Villà J, Štrajbl M, Glennon TM, Sham YY, Chu ZT, Warshel A. How important are entropy contributions in enzymatic catalysis? Proc Natl Acad Sci USA. 2000;97:11899–11904. doi: 10.1073/pnas.97.22.11899. [DOI] [PMC free article] [PubMed] [Google Scholar]
- 63.Kamerlin SCL, Florián J, Warshel A. Associative versus dissociative mechanisms of phosphate monoester hydrolysis: on the interpretation of activation entropies. Chem Phys Chem. 2008;9:1767–1773. doi: 10.1002/cphc.200800356. [DOI] [PubMed] [Google Scholar]
- 64.Sharma PK, Xiang Y, Kato M, Warshel A. What are the roles of substrate-assisted catalysis and proximity effects in peptide bond formation by the ribosome? Biochemistry. 2005;44:11307–11314. doi: 10.1021/bi0509806. [DOI] [PubMed] [Google Scholar]
- 65.Štrajbl M, Sham YY, Villà J, Chu ZT, Warshel A. Calculations of activation entropies of chemical reactions in solution. J Phys Chem B. 2000;104:4578–4584. [Google Scholar]
- 66.Singh N, Warshel A. Toward accurate microscopic calculation of solvation entropies: extending the restraint release approach to studies of solvation effects. J Phys Chem B. 2009;113:7372–7382. doi: 10.1021/jp811063v. [DOI] [PMC free article] [PubMed] [Google Scholar]
- 67.Karplus M, Kushick JN. Method for estimating the configurational entropy of macromolecules. Macromolecules. 1981;14:325–332. [Google Scholar]
- 68.Levy RM, Karplus M, Kushick J, Perahia D. Evaluation of the configurational entropy for proteins - application to molecular-dynamics simulations of an alpha-helix. Macromolecules. 1984;17:1370–1374. [Google Scholar]
- 69.Rosta E, Kamerlin S, Warshel A. On the interpretation of the observed linear free energy relationship in phosphate hydrolysis: a thorough computational study of phosphate diester hydrolysis in solution. Biochemistry. 2008;47:3725–3735. doi: 10.1021/bi702106m. [DOI] [PubMed] [Google Scholar]
- 70.Sham YY, Warshel A. The surface constrained all atom model provides size independent results in calculations of hydration free energies. J Chem Phys. 1998;109:7940–7944. [Google Scholar]
- 71.Alden RG, Parson WW, Chu ZT, Warshel A. Calculations of Electrostatic Energies in Photosynthetic Reaction Centers. J Am Chem Soc. 1995;117:12284–12298. [Google Scholar]
- 72.Kato M, Warshel A. Using a charging coordinate in studies of ionization induced partial unfolding. J Phys Chem B. 2006;110:11566–11570. doi: 10.1021/jp061190o. [DOI] [PubMed] [Google Scholar]
- 73.Florián J, Goodman MF, Warshel A. Theoretical investigation of the binding free energies and key substrate-recognition components of the replication fidelity of Human DNA Polymerase b. J Phys Chem B. 2002;106:5739–5753. [Google Scholar]
- 74.Florián J, Warshel A, Goodman MF. Molecular dynamics free-energy simulations of the binding contribution to the fidelity of T7 DNA Polymerase. J Phys Chem B. 2002;106:5754–5760. [Google Scholar]
- 75.Xiang Y, Oelschlaeger P, Florian J, Goodman MF, Warshel A. Simulating the effect of DNA polymerase mutations on transition-state energetics and fidelity: Evaluating amino acid group contribution and allosteric coupling for ionized residues in human Pol b. Biochemistry. 2006;45:7036–7048. doi: 10.1021/bi060147o. [DOI] [PubMed] [Google Scholar]
- 76.Kato M, Braun-Sand S, Warshel A. Computational and structural approaches to drug discovery, Ligand Protein Interactions. Royal Society of Chemistry; England: 2007. Challenges and progresses in calculations of binding free energies; what does it taketo quantify electrostatic contributions to protein ligand interactions? pp. 268–285. [Google Scholar]
- 77.Rizzo RC, Aynechi T, Case DA, Kuntz ID. Estimation of absolute free energies of hydration using continuum methods: accuracy of partial charge models and optimization of nonpolar contributions. J Chem Theory Comput. 2006;2:128–139. doi: 10.1021/ct050097l. [DOI] [PubMed] [Google Scholar]
- 78.Sitkoff D, Sharp KA, Honig B. Accurate calculation of hydration free energies using macroscopic solvent models. J Phys Chem. 1994;98:1978–1988. [Google Scholar]
- 79.Shurki A, Warshel A. Structure/function correlations of proteins using MM, QM/MM, and related approaches: Methods, concepts, pitfalls, and current progress. Adv Protein Chem. 2003;66:249–313. doi: 10.1016/s0065-3233(03)66007-9. [DOI] [PubMed] [Google Scholar]
- 80.King G, Lee FS, Warshel A. Microscopic simulations of macroscopic dielectric constants of solvated proteins. J Chem Phys. 1991;95:4366–4377. [Google Scholar]
- 81.Rosta E, Kamerlin SCL, Warshel A. On the interpretation of the observed linear free energy relationship in phosphate hydrolysis: A thorough computational study of phosphate diester hydrolysis in solution. Biochemistry. 2008;47:3725–3735. doi: 10.1021/bi702106m. [DOI] [PubMed] [Google Scholar]
- 82.Dullweber F, Stubbs MT, Musil D, Sturzebecher J, Klebe G. Factorising ligand affinity: a combined thermodynamic and crystallographic study of trypsin and thrombin inhibition. J Mol Biol. 2001;313:593–614. doi: 10.1006/jmbi.2001.5062. [DOI] [PubMed] [Google Scholar]
- 83.Liu L, Baase WA, Matthews BW. Halogenated benzenes bound within a non-polar cavity in T4 lysozyme provide examples of I…S and I…Se halogen-bonding. J Mol Biol. 2009;385:595–605. doi: 10.1016/j.jmb.2008.10.086. [DOI] [PubMed] [Google Scholar]
- 84.Carlsson J, Åqvist J. Calculations of solute and solvent entropies from molecular dynamics simulations. Phys Chem Chem Phys. 2006;8:5385–5395. doi: 10.1039/b608486a. [DOI] [PubMed] [Google Scholar]
- 85.Carlsson J, Åqvist J. Absolute hydration entropies of alkali metal ions from molecular dynamics simulations. J Phys Chem B. 2009;113:10255–10260. doi: 10.1021/jp900818z. [DOI] [PubMed] [Google Scholar]
- 86.Štrajbl M, Florián J, Warshel A. Ab initio evaluation of the free energy surfaces for the general base/acid catalyzed thiolysis of formamide and the hydrolysis of methyl thiolformate: A reference solution reaction for studies of cysteine proteases. J Phys Chem B. 2001;105:4471–4484. [Google Scholar]
- 87.Lee MS, Olson MA. Calculation of absolute protein-ligand binding affinity using path and endpoint approaches. Biophys J. 2006;90:864–877. doi: 10.1529/biophysj.105.071589. [DOI] [PMC free article] [PubMed] [Google Scholar]
- 88.Singh N, Warshel A. A comprehensive examination of the contributions to binding entropy of protein-ligand complexes. (in preparation) [DOI] [PMC free article] [PubMed] [Google Scholar]
- 89.Gurney R. Ionic processes in solutions. New York: McGraw-Hill Book Company, Inc; 1953. [Google Scholar]
- 90.Holtzer A. The “cratic correction” and related fallacies. Biopolymers. 1995;35:595–602. doi: 10.1002/bip.360350605. [DOI] [PubMed] [Google Scholar]
- 91.Amzel LM. Loss of Translational Entropy in Binding, Folding, and Catalysis. Proteins: Struct Funct Genet. 1997;28:144–149. [PubMed] [Google Scholar]
- 92.Stanton R, Peräkylä M, Bakowies D, Kollman PA. Combined ab initio and free energy calculations to study reactions in enzymes and solution: amide hydrolysis in trypsin and aqueous solution. J Am Chem Soc. 1998;120:3448–3457. [Google Scholar]
- 93.Hermans J, Wang L. Inclusion of loss of translational and rotational freedom in theoretical estimates of free energies of binding. Application to a complex of benzene and mutant T4 lysozyme. J Am Chem Soc. 1997;119:2707–2714. [Google Scholar]
- 94.Villà J, Warshel A. Energetics and dynamics of enzymatic reactions. Journal of Physical Chemistry B. 2001;105:7887–7907. [Google Scholar]
- 95.Warshel A, Parson WW. Dynamics of biochemical and biophysical reactions: insight from computer simulations. Quart Rev Biophys. 2001;34:563–670. doi: 10.1017/s0033583501003730. [DOI] [PubMed] [Google Scholar]
- 96.Carlsson J, Åqvist J. Absolute and relative entropies from computer simulation with applications to ligand binding. J Phys Chem B. 2005;109:6448–6456. doi: 10.1021/jp046022f. [DOI] [PubMed] [Google Scholar]
- 97.Luo R, Gilson MK. Synthetic Adenine Receptors: Direct Calculation of Binding Affinity and Entropy. J Am Chem Soc. 2000;122:2934–2937. [Google Scholar]
- 98.Green NM. Avidin and streptavidin. Methods Enzymol. 1990;184:51–67. doi: 10.1016/0076-6879(90)84259-j. [DOI] [PubMed] [Google Scholar]
- 99.Muegge I, Tao H, Warshel A. A fast estimate of electrostatic group contributions to the free energy of protein-inhibitor binding. Prot Eng. 1997;10:1363–1372. doi: 10.1093/protein/10.12.1363. [DOI] [PubMed] [Google Scholar]
- 100.Štrajbl M, Florián J, Warshel A. Ab Initio Evaluation of the Potential Surface for General Base-Catalyzed Methanolysis of Formamide: A Reference Solution Reaction for Studies of Serine Proteases. J Am Chem Soc. 2000;122:5354–5366. [Google Scholar]
- 101.Kongsted J, Ryde U. An improved method to predict the entropy term with the MM/PBSA approach. J Comput Aided Mol Des. 2009;23:63–71. doi: 10.1007/s10822-008-9238-z. [DOI] [PubMed] [Google Scholar]
- 102.Gohlke H, Kiel C, Case DA. Insights into protein-protein binding by binding free energy calculation and free energy decomposition for the Ras-Raf and Ras-RaIGDS complexes. Journal of Molecular Biology. 2003;330:891–913. doi: 10.1016/s0022-2836(03)00610-7. [DOI] [PubMed] [Google Scholar]
- 103.Mandal A, Hilvert D. Charge optimization increases the potency and selectivity of a chorismate mutase inhibitor. J Am Chem Soc. 2003;125:5598–5599. doi: 10.1021/ja029447t. [DOI] [PubMed] [Google Scholar]
- 104.Sarver RW, Peevers J, Cody WL, Ciske FL, Dyer J, Emerson SD, Hagadorn JC, Holsworth DD, Jalaie M, Kaufman M, Mastronardi M, McConnell P, Powell NA, Quin J, 3rd, Van Huis CA, Zhang E, Mochalkin I. Binding thermodynamics of substituted diaminopyrimidine renin inhibitors. Anal Biochem. 2007;360:30–40. doi: 10.1016/j.ab.2006.10.017. [DOI] [PubMed] [Google Scholar]
- 105.Hansson T, Åqvist J. Estimation of binding free energies for HIV proteinase inhibitors by molecular dynamics simulations. Protein Eng. 1995;8:1137–1144. doi: 10.1093/protein/8.11.1137. [DOI] [PubMed] [Google Scholar]
- 106.Steuber H, Heine A, Klebe G. Structural and thermodynamic study on aldose reductase: nitro-substituted inhibitors with strong enthalpic binding contribution. J Mol Biol. 2007;368:618–638. doi: 10.1016/j.jmb.2006.12.004. [DOI] [PubMed] [Google Scholar]
- 107.Talhout R, Engberts JB. Thermodynamic analysis of binding of p-substituted benzamidines to trypsin. Eur J Biochem. 2001;268:1554–1560. [PubMed] [Google Scholar]
- 108.Rodinger T, Howell PL, Pomes R. Calculation of absolute protein-ligand binding free energy using distributed replica sampling. J Chem Phys. 2008;129:155102. doi: 10.1063/1.2989800. [DOI] [PubMed] [Google Scholar]
- 109.ChemDraw Ultra v.11.0. Cambridge, MA 02140 USA: CambridgeSoft Corporation; 2007. [Google Scholar]
Associated Data
This section collects any data citations, data availability statements, or supplementary materials included in this article.