

Abstract
To understand the role of specific fibroblast growth factor receptors (FGFRs) in cortical development, we conditionally inactivated Fgfr2 or both Fgfr1 and Fgfr2 [Fgfr2 conditional knock-out (cKO) or double knock-out mice, respectively] in radial glial cells of the dorsal telencephalon. Fgfr1 and Fgfr2 are necessary for the attainment of a normal number of excitatory neurons in the cerebral cortex. The action of FGF receptors appears to be through increasing self-renewal of neuronal precursors within the ventricular zone. Volume measurements, assessments of excitatory neuron number, and areal marker expression suggested that the proper formation of the medial prefrontal cortex (mPFC) depends on the function of Fgfr2, whereas Fgfr1 together with Fgfr2 control excitatory cortical neuron development within the entire cerebral cortex. Fgfr2 cKO mice had fewer and smaller glutamate synaptic terminals in the bed nuclei of the stria terminalis (BST), a projection area for mPFC cortical neurons. Furthermore, Fgfr2 cKO mice showed secondary decreases in GABAergic neurons in the BST and septum. These data demonstrate that FGFR2 signaling expands the number of excitatory neurons in the mPFC and secondarily influences target neurons in subcortical stations of the limbic system.
Introduction
The cerebral cortex is assembled during embryogenesis through the contribution of two germinal layers, the neuroepithelium abutting the ventricular lumen, or ventricular zone (VZ), and the more superficial subventricular zone (SVZ). Radial glial cells in the VZ generate cortical excitatory pyramidal neurons directly and support their migration to the cortical plate. Radial glia also generate “intermediate” or “basal” progenitors that migrate to the SVZ, divide locally, and also generate neurons that migrate to the cortex (Noctor et al., 2001, 2007; Gal et al., 2006; Kowalczyk et al., 2009). Thus, the production of cortical pyramidal neurons by both radial glia and the intermediate progenitors within the SVZ contribute to expanded cortical regions and layers that have occurred during cortical evolution (Martínez-Cerdeño et al., 2006).
The prefrontal cortex (PFC) is arguably the cortical region that has undergone the most dramatic expansion during mammalian evolution, albeit by unknown mechanisms. Several members of the fibroblast growth factor (FGF) family, including FGF2, 8, 15, 17, and 18, are enriched in the anterior telencephalon from which the PFC primordium is derived. Among the three known FGF receptors (FGFRs) expressed in the brain, Fgfr1 and Fgfr2 are expressed in partially overlapping anterior–posterior decreasing gradient in the cortical neuroepithelium, whereas Fgfr3 is expressed posteriorly (Vaccarino et al., 1999; Muzio et al., 2002; Hasegawa et al., 2004). Some of the FGF ligands are crucial for the specification of anterior cortical areas. For example, Fgf8 gene expression is necessary and sufficient to expand PFC regions and germline Fgf17 knock-out (KO) mice exhibit reduced the medial PFC (mPFC) territory (Fukuchi-Shimogori and Grove, 2001; Garel et al., 2003; Cholfin and Rubenstein, 2007). In addition to early patterning, Fgf genes have a profound impact on neurogenesis in a region-specific manner. For example, the deletion of the Fgf2 gene reduces dividing precursor cells, excitatory cortical neurons, and astroglia more strongly in the PFC (Vaccarino et al., 1999; Raballo et al., 2000; Korada et al., 2002) and, similarly, Fgf8 is required for cortical neural stem cells self-renewal, whereas Fgf15 appears to be acting in an antagonistic manner (Borello et al., 2008).
FGF receptor signaling is required at early neural plate stages for the formation of the telencephalon, apparently promoting telencephalic cell survival (Paek et al., 2009). Disruption of Fgfr1 and Fgfr2 at early (preneurogenic) stages of telencephalic development demonstrated altered proliferation and cell death, particularly in midline regions (Gutin et al., 2006; Ever et al., 2008). Mice transiently expressing a dominant-negative Fgf receptor transgene able to antagonize all FGFRs in the embryonic cortical neuroepithelium exhibited decreased proliferation, cortical atrophy, and loss of T-brain 1 (TBR1)+ excitatory neurons in mPFC and temporal cortex (Shin et al., 2004); consistent with this, mice lacking all three receptors in the dorsal telencephalon demonstrate impairment in normal production of cortical stem and progenitor cells (Kang et al., 2009). However, the role of each FGF receptor type in cortical morphogenesis is still unclear. The disruption Fgfr1 is not sufficient to cause significant abnormalities in cortical neurogenesis or patterning (Hébert et al., 2003; Ohkubo et al., 2004). Fgfr2 is expressed in a partially overlapping fashion with Fgfr1 by cortical radial glia in anterior regions and may control, alone or together with Fgfr1, cell proliferation and differentiation in response to the anterior source of FGF ligands.
To understand the contribution of Fgfr1 and Fgfr2 to mPFC morphogenesis and their roles in VZ/SVZ precursors in anteromedial regions, we characterized populations of cortical neuron subtypes and precursor cells in the dorsal neuroepithelium of conditional knock-out mice with a deficiency of Fgfr2, with or without Fgfr1, in radial glial cells. We examined anteromedial regions of the forebrain suggested to be more affected in dominant-negative Fgfr1 mutant mice (Shin et al., 2004) and previous manipulations of Fgfr2 (Gutin et al., 2006) and extended our characterization to include synaptic projections and neuronal populations in key subcortical structures that receive connections from mPFC.
Materials and Methods
Animals.
The conditional Fgfr2 null allele harbors loxP recombination sites flanking regions encoding the Ig III binding and transmembrane domains of the Fgfr2 gene (Fgfr2f) (Yu et al., 2003). The conditional Fgfr1 null allele harbors loxP recombination sites flanking the transmembrane and kinase domains of the Fgfr1 gene (Fgfr1f) (Pirvola et al., 2002). Mice homozygous for Fgfr2f alleles, or for both Fgfr2f and Fgfr1f alleles, were crossed with mice expressing the Cre recombinase transgene under the control of the human GFAP promoter (hGFAP) (Zhuo et al., 2001). The hGFAP-Cre transgene targets Cre recombination to radial glia progenitors of the dorsal telencephalon starting at embryonic day 13.5 (E13.5) (see Fig. 1A,B) (Ohkubo et al., 2004). Cre-negative animals, littermates when possible, were used as control animals. To assess early time points of inhibitory neuron development, mice homozygous for both Fgfr2f and Fgfr1f alleles were crossed with GAD67-GFP (delta-neo) mice (Tamamaki et al., 2003). All experimental procedures involving animals were performed in accordance with the Yale Animal Resources Center and Institutional Animal Care and Use Committee policies.
Figure 1.
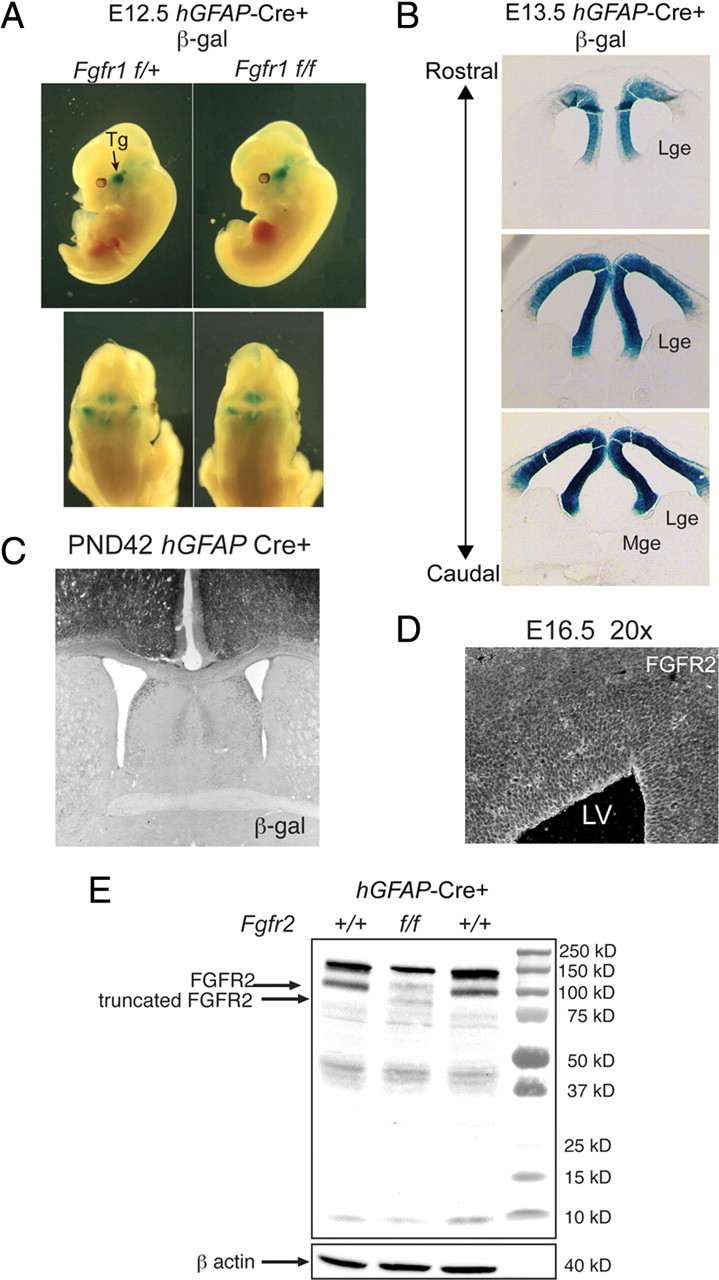
General characteristics of Fgfr2 cKOGFAP-Cre and Fgfr1;Fgfr2 cKOGFAP-Cre mice. A–C, Cre-recombination driven conditional KO of Fgfr2 as demonstrated by β-galactosidase reporter expression was not present before E13.5 (A) and was localized to the dorsal telencephalon embryonically (B) and in a 6-week-old animal (C). D, Immunohistochemistry for FGFR2 in E15.5 dorsal telencephalon. E, Western blot analysis of the cerebral cortex of Fgfr2 cKO compared with 2-month-old control littermates showing reduced amount of FGFR2, which migrates with an apparent molecular weight of 100 kDa, and the expression of an additional protein of ∼90 kDa representing the truncated mutant protein. Tg, Trigeminal ganglion; β-gal, β-galactosidase; GE, ganglionic eminences.
Immunocytochemistry.
Deeply anesthetized animals were intracardially perfused first with PBS followed by 4% paraformaldehyde in PBS. Brains were cryoprotected and cryostat (Leica; CM1900) sectioned at 20 μm and at 50 μm thickness, respectively, for embryonic ages (E15.5 and E16.5) and adult ages (6 weeks and 3 months). Free-floating immunostaining was used for adult brain tissue and slide mounted processing was used for embryonic brain tissue. Sections were processed for staining first by blocking for 1 h with 10% goat serum in PBS with 0.025% Triton X-100, 0.0125% Tween 20 (PBS++), and then incubating for 24–48 h at 4°C with 5% goat serum/PBS++ containing primary antibodies as follows: β-galactosidase (β-gal) (1:10,000; Cappel; 56028; 05036), Brain 1 (Brn-1) (1:500; M. Wegner, Friedrich-Alexander-University, Erlangen, Germany), caspase-3 (1:500; Cell Signaling; 9661), Cut-like homeobox 1 (Cux1) (1:100; Santa Cruz; sc-6327; used with unmasking reagent; Vector Laboratories; H-3300), neuronal class III β-tubulin (Tuj1) (1:1000; Promega; G7121; 131959), reelin (1:1000; Millipore Bioscience Research Reagents; MAB5364), bromodeoxyuridine (BrdU) (1:500; Accurate Chemical; OBT0030; H8913), proliferating cell nuclear antigen (PCNA) (1:100; Millipore; 05-347; 32555), phosphohistone 3 (pH3) (1:1000; Sigma-Aldrich; H9908), TBR1 (1:1000; Abcam; AB31940), paired box gene 6 (Pax6) (1:1000; Abcam; AB78545), green fluorescent protein (GFP) (1:1000; Abcam; AB13970; 660556), T-brain 2 (TBR2) (1:1000; Millipore Bioscience Research Reagents; AB9616), neurofilament heavy (SMI-32) (1:1000; Covance; 14864801), glutamic acid decarboxylase 67 (GAD67) (1:2000; Millipore Bioscience Research Reagents; MAB5406; 0606034244), calretinin (CR) (1:2000; Millipore Bioscience Research Reagents; MAB1586; 17120001), parvalbumin (PV) (1:2000; Sigma-Aldrich; P3088), somatostatin (1:1000; Abcam; AB64053), neuronal nuclei (NeuN) (1:500; Millipore Bioscience Research Reagents; MAB377), GABA (1:5000; Sigma-Aldrich; A2052), and SATB homeobox 2 (SATB2) (1:1000; V. Tarabykin, Max Planck Institute, Göttingen, Germany). Brain sections were then washed three times in PBS followed by an incubation in 5% goat serum/PBS++ containing Alexa dye-conjugated secondary antibodies (1:250–1000; Invitrogen) or AMCA (7-amino-4-methylcoumarin-3-acetic acid) (1:100; Vector Laboratories; CL-100) for fluorescent detection. Sections were coverslipped using mounting medium with 4′,6-diamidino-2-phenylindole (DAPI) (Vector Laboratories; H-1200).
Quantitative PCR.
To evaluate the timing and specificity of Cre-recombination affecting Fgfr2 gene expression, females with timed pregnancies were deeply anesthetized and killed by cervical dislocation on E13.5 and E15.5. Embryos were removed, and the dorsal and ventral regions of the telencephalon were dissected out from the embryonic brains. The cerebral cortex and hippocampus were pooled in one sample from each embryo and the ganglionic eminences for a second sample, immediately homogenized in Trizol reagent (Sigma-Aldrich), and frozen. After thawing, RNA was isolated using chloroform phase separation, precipitated with 75% alcohol, and resuspended in water. RNA concentrations were determined using a Nanodrop Spectrophotometer (Thermo Fisher Scientific). cDNA was synthesized using SuperScript III First Strand Synthesis kit (Invitrogen). Quantitative PCR was performed using TaqMan Gene Assays (Applied Biosystems) for FGFR2 IIIc isoform (ID Mm01269938) and β-Actin with GeneAmp Fast PCR Mastermix (Applied Biosystems) in a StepOne Instrument (Applied Biosystems).
Western blot.
To evaluate FGFR2 protein expression, 2-month-old mice were anesthetized and decapitated. The cerebral cortex was dissected from other brain regions and homogenized on ice in protein lysis buffer, containing the following (in mmol/L): 50 Tris-HCl, pH 8.0, 150 NaCl, 50 NaF, 1 Na3VO4, 0.1 PMSF, 1 benzamidine, and the following (in g/L): 10 Nonidet P-40, 5 sodium deoxycholate, 0.002 aprotinin, 1 × 10⁻⁵ leupeptin, and 1 × 10⁻⁵ pepstatin. Homogenates were centrifuged at 13,200 rpm for 20 min at 4°C. Supernatants were stored at −80°C until used. For Western blotting, equal amounts of homogenate (5 μl) were resolved in 10% SDS-PAGE and transferred onto a nitrocellulose membrane. Membranes were blocked at room temperature for 60 min in 5% nonfat dry milk in Tris-buffered saline with Tween 20 (TBST) [containing the following (in mmol/L): 10 Tris-HCl buffer, pH 8.0, 150 NaCl, and 0.1% Tween 20] and incubated overnight at 4°C with rabbit anti-FGFR2 antibody (1:1500; Sigma-Aldrich; F0300) in 5% nonfat dry milk in TBST. Blots were washed three times in TBST and incubated with horseradish peroxidase-conjugated donkey anti-rabbit secondary antibody (1:5000; GE Healthcare; NA934) in 5% nonfat dry milk in TBST. Bands were detected using enhanced chemiluminescence (Pierce Biotechnology). Blots were stripped and then reincubated for 1 h at room temperature with mouse anti-β-actin (1:4000; Sigma-Aldrich; 115K4825), washed, and incubated with horseradish peroxidase-conjugated sheep anti-mouse secondary antibody [1:10,000; GE Healthcare; NA931(V)] using the same procedure as above.
2-Bromodeoxyuridine treatment.
BrdU was dissolved in 0.07 N NaOH at the concentration of 5 mg/ml, sterile filtered, and injected intraperitoneally in the proportion of 100 mg/kg at E14.5, 24 or 48 h before animal perfusion.
Stereology and cell counting.
Unbiased estimates of TBR1-, pH3-, TBR2-, SMI-32-, GAD67-, CR-, PV-, NeuN-, and GABA-immunopositive cells were obtained with a computer running the StereoInvestigator software (MicroBrightField) and coupled to a Zeiss Axioskope 2 Mot Plus (Carl Zeiss) equipped with a Lucivid and calibrated motorized stage controller that allows precise control of y-, x-, and z-axes. The use of the stereological approach produced data containing consistent cell counts with variances within each sample and across sampling sites that were in a statistically acceptable range. Using stereology to comprehensively assess brain regions of interest eliminates potential chance differences and bias in the process of selecting sites to evaluate (Peterson, 1999).
Using the optical fractionator, nuclear profiles were counted in three-dimensional counting boxes. For embryonic stereological TBR2 and pH3 counts, every 10th section was used, beginning with the most anterior section that showed a clear ventricular and subventricular zone and continuing posteriorly to the last section before the hippocampus. Randomly placed sampling grids of 250 × 250 μm were used with a counting frame of 50 × 50 × 5 μm. For adult stereological results, counting frames measured 100 × 100 × 5 μm and sampling grids varied according to the region of interest [800 × 800 μm in neocortical areas; 400 × 400 μm in the medial PFC, ventral orbital frontal cortex (vOFC), cingulate cortex (CC), and septum; and 200 × 200 μm in the bed nuclei of the stria terminalis (BST)]. For counts in the neocortex and cingulate cortex, 50 μm coronal sections were counted at a frequency of 1 every 20th section. Cortical contours were drawn at the lower extent of layer 6 and excluded the archicortex with a boundary located at border with the entorhinal/insular cortex. Boundaries of the CC were defined anteriorly by the rostral extent of the corpus callosum or Probst bundles, ventrally by the cortical white matter, and dorsally by changes in layer II, which becomes less densely packed and more homogenous in the noncingulate cortical region. For mPFC and vOFC, 50 μm coronal sections were counted at a frequency of 1 every 10th section. The mPFC in rodents has been shown to encompass portions of the anterior cingulate, prelimbic, and infralimbic cortices; the mPFC boundaries (see Fig. 3) were therefore drawn using previously described cytoarchitectonic differences for these regions (Krettek and Price, 1977), including homogeneity and density of layer V (high in mPFC, low in precentral cortex), definition of overall lamination (high in mPFC, low in infralimbic), and evenness of layer II (high in mPFC, low in infralimbic). For the BST and the septum, 50 μm coronal sections were counted at a frequency of one every fifth section. Boundaries of the dorsal portion of the BST nuclei were defined by the posterior anterior commissure, laterally by the striatum, ventrally by densities of hypothalamic nuclei, and dorsomedially by the septal nuclei. Boundaries for the septal nuclei were determined dorsally by the corpus callosum or, when absent, cortex, and ventrolaterally by the striatum. Variations between counts was assessed by the Gunderson coefficients of error, and data were only used when cell count error values were sufficiently low (<0.15).
Figure 3.
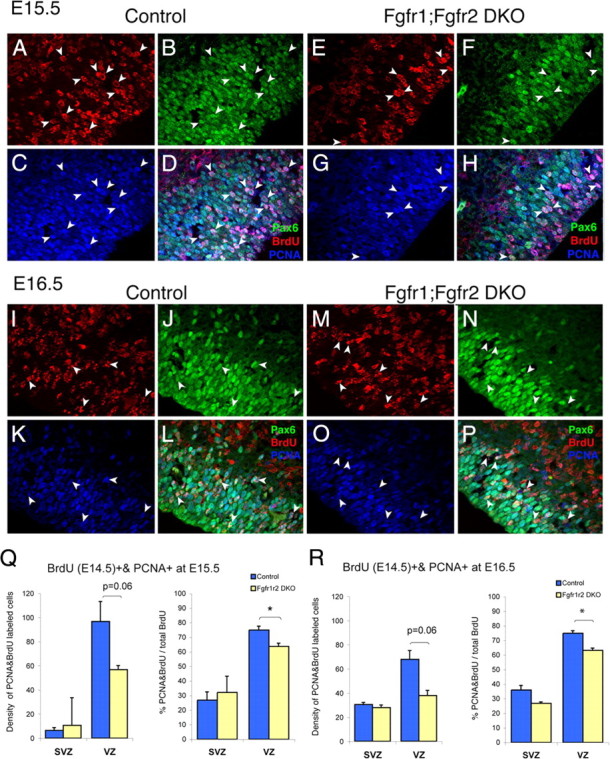
Decrease in size of VZ and number and proportion of proliferating cells reentering the cell cycle in Fgfr1;Fgfr2 DKO mice at E15.5 (A–H, Q) and E16.5 (I–P, R). A–P, PCNA, BrdU, Pax6 triple immunostaining in E15.5 (A–H) and E16.5 (I–P) dorsolateral cortex, showing reduced thickness of Pax6+ cells defining VZ and reduced number of PCNA/BrdU double-labeled cells in VZ. Q, R, Average (±SEM) density (cells/counting box measuring 7.0 × 104 μm3) and proportion of PCNA/BrdU double-labeled cells, showing significant deficits in VZ at both E15.5 and E16.5 (*p < 0.05). ANOVA, Main effect of genotype significant only in VZ (F(1,9) = 24.83; p = 0.002). There was no significant day by genotype interaction.
To evaluate densities of PCNA and PH3 cells within embryonic regions of interest, a blind method of counting cells within standardized regions of VZ and SVZ was adopted. For PCNA counts, 40× Apotome Z-stack micrographs obtained on an ApoTome equipped Axiovert 200M with Axiovision 4.5 software (Carl Zeiss) were examined in one to three representative anterior and posterior sections in each brain by an experimenter blind to the animal genotype. For PH3 counts, 5× micrographs of dorsal telencephalon were examined in two to three representative anterior and posterior sections in each brain by an experimenter blind to the animal genotype. For evaluations of cell cycle reentry, three sections in each brain triple stained with Pax6, PCNA, and BrdU were used to count nuclear profiles within the VZ and SVZ. The density of double-labeled PCNA/BrdU cells was assessed within 40× Z-stacks (total volume, 7.0 × 104 μm3), and the percentage of PCNA/BrdU double-immunostained cells versus the total number of BrdU-labeled cells was calculated.
In situ hybridization. Collection and sectioning of postnatal day 0 (P0) brain tissue was performed as described above for immunocytochemistry using RNase-free solutions. In situ hybridization was performed in frozen sections using the digoxigenin system as described previously (Ohkubo et al., 2004) with some modification. Briefly, a riboprobe incorporating digoxygenin-labeled nucleotides was synthesized from linearized plasmids for cadherin 6 (Cad6) derived from the subcloned PCR fragments. Sections were fixed in 4% paraformaldehyde, washed in PBS, and dehydrated through grades of ethanol. Sections were then air dried, treated with proteinase K in buffer, fixed again, rinsed, acetylated, rinsed again in water, and air dried. Prehybridization was done with incubation in hybridization buffer followed by washes in 2× SSC and RNAase treatment. Tissue then underwent washes in 2× SSC, 50% heat-inactivated sheep serum in PBS. Sections were incubated overnight in a solution containing anti-digoxigenin Fab fragments, conjugated to alkaline phosphatase, and preabsorbed with chick embryo powder to reduce background labeling. After antibody incubation, sections were washed and incubated in developing buffer. The color reaction was performed by incubation in developing buffer with NBT (nitroblue tetrazolium)/BCIP (5-bromo-4-chloro-3-indolyl phosphate). Finally, sections were washed in PBS, dehydrated through grades of ethanol, and mounted in Permount.
Electron microscopy.
Fifty-micrometer-thick sections containing the dorsal portion of the BST (as defined in the preceding section) were washed in 0.1 m phosphate buffer (PB). To eliminate unbound aldehydes, sections were incubated in 1% sodium borohydride and then rinsed in PB. Subsequently, sections were incubated with GAD-67 or vGlut2 antibodies (Millipore Bioscience Research Reagents), followed by incubation in biotinylated secondary Ig. Then, sections were incubated in avidin–biotin complex, and the tissue-bound peroxidase was visualized by a diaminobenzidine reaction. After immunostaining, unstained cortical perikarya (10 from each mouse) in the BST in flat embedded blocks were randomly selected. The blocks were osmicated (in 1% osmium tetroxide in PB) and dehydrated in increasing ethanol concentrations. During the dehydration, 1% uranyl acetate was added to the 70% ethanol to enhance ultrastructural membrane contrast. Dehydration was followed by flat-embedding in Araldite. Ultrathin sections were cut on a Leica ultra microtome, collected on Formvar-coated single-slot grids, and analyzed with a Tecnai 12 Biotwin (FEI Company) electron microscope.
To obtain a quantification of synaptic number, unbiased for possible changes in synaptic size, the dissector technique was used. On consecutive 90-nm-thick sections, we determined the average projected height of the synapses and used ∼30% of this value as the distance between the dissectors. On the basis of this calculation, the number of synapses was counted in two consecutive serial sections ∼270 nm apart (“reference” and “look-up” sections) of 10 immunolabeled perikarya profiles in each animal. Synapse characterization was performed at a magnification of 20,000. Symmetric and asymmetric synapses were counted on all selected neurons only if the presynaptic and/or postsynaptic membrane specializations were seen and synaptic vesicles were present in the presynaptic bouton. Immunolabeling for vGlut2 was associated with asymmetrical, excitatory synapses, and immunolabeling for GAD67 was associated with symmetrical, inhibitory connections. Synapses with neither clearly symmetric nor asymmetric membrane specializations were excluded from the assessment. The plasma membranes of selected cells were outlined on photomicrographs and their length was measured. Plasma membrane length values measured in the individual animals were added, and the total length was corrected to the magnification applied. Synaptic densities were evaluated according to the following formula: NV = Q−/Vdis, where Q− represented the number of synapses present in the “reference” section that disappeared in the “look-up” section. Vdis is the dissector volume (volume of reference), which is the area of the perikarya profile multiplied by the distance between the upper faces of the reference and look-up sections [i.e., the data are expressed as numbers of synaptic contacts per unit length (100 μm) of perikaryon membrane]. Section thickness was determined by using the minimal fold method.
Statistical analysis.
Univariate ANOVA was performed with SPSS to identify whether cell count deficits in KO animals determined by stereology were different across regions, determined by interactions between two variables: brain regions and genotype. ANOVA was also performed on zone-counted data in the VZ and SVZ to identify interactions between age and genotype. Student's t tests were performed with Microsoft Excel to compare specific brain regions and numbers of cells for stereological cell counts and densities.
Results
Targeted inactivation of the Fgfr2 gene or both the Fgfr2 and Fgfr1 genes in radial glia was accomplished via Cre-dependent recombination of the loxP-flanked sequences in the Fgfr2f and Fgfr1f alleles. FGF receptors are expressed in the developing VZ and are enriched in cells located at the apical surface, likely radial glia (Fig. 1D) (Vaccarino et al., 1999, 2001; Vaccarino, 2000; Yoon et al., 2004). Cre was driven by a human GFAP-Cre transgene (hGFAP-Cre) active in telencephalic radial glial cells beginning at E13.5–E14.5 5 (Fig. 1A–C) (Zhuo et al., 2001; Ohkubo et al., 2004; Kang et al., 2009). Mice homozygous for the recombined Fgfr2 or both Fgfr1 and Fgfr2 null alleles were referred to as Fgfr2 conditional knock-out (cKO) and Fgfr1;Fgfr2 double knock-out (DKO) (their genotypes being Fgfr2f/f;hGfapCre and Fgfr1f/f; Fgfr2f/f;hGfapCre, respectively). The hGFAP-Cre transgene was targeted to the dorsal telencephalon beginning at embryonic day 13.5 and had virtually no expression in the subcortical telencephalon, as shown by the β-galactosidase reporter (Fig. 1A–C). Quantitative PCR confirmed previous reports (Kang et al., 2009) on this mouse line that Fgfr2 mRNA was significantly decreased only in the E13.5 and E15.5 dorsal telencephalon (supplemental Table 1, available at www.jneurosci.org as supplemental material). Western blot demonstrated a clear reduction in the wild-type FGFR2 protein in the cortex of the dorsal telencephalon of adult Fgfr2 cKO mice, with appearance of a 25% smaller protein, which likely represents the Cre-deleted mutant form (Fig. 1E).
Embryonic cortical volume and cell proliferation
The inactivation of all FGFRs in cortical precursor cells using a dominant-negative Fgfr1 transiently expressed using the Otx1 promoter caused a 45% reduction in cortical pyramidal neurons expressing TBR1 (Shin et al., 2004), a transcription factor expressed by early-born excitatory neurons of the cerebral cortex (Hevner et al., 2001). Consistent with these results, TBR1 staining was decreased throughout the cortical plate of Fgfr1;Fgfr2 DKO mice at E16.5 compared with control mice (Fig. 2A–F), suggesting that Fgfr2 and Fgfr1 might be contributing to this defect.
Figure 2.

Decrease in TBR1+ neurons and proliferating progenitors in cortex of Fgfr1;Fgfr2 DKO mice. A–F, TBR1 immunostaining showing lower density of TBR1+ cells in the cerebral cortex of Fgfr1;Fgfr2 DKO mice with similar deficits in both anteromedial (A, B, 10×; E, F, 20×) and dorsolateral regions (C, D, 20×). G, H, TBR2 (green) and pH3 (red) double immunostaining, showing fewer TBR2+ and pH3+ cells in the SVZ/intermediate zone of Fgfr2 cKO mice. I, Average density (±SEM) of pH3+ cells at E16.5 by optical fractionator, corrected for measured section thickness within the VZ (n = 5 control, 3 Fgfr2 cKO, and 2 Fgfr1;Fgfr2 DKO). J, Average (±SEM) density of TBR2+ cells by optical fractionator at E16.5, corrected for measured section thickness, showing significantly reduced density in both mutant lines in the anterior cortical wall (n = 5 control, 3 Fgfr2 cKO, and 2 Fgfr1;Fgfr2 DKO).
To understand the mechanism of the deficiency in TBR1+ cells, we used an unbiased stereological approach to quantify proliferating precursors in the developing brain. We immunostained coronal sections for TBR2, a transcription factor whose expression is enriched in intermediate precursors as they become committed to this cell fate in the VZ and then migrate into SVZ where they proliferate. TBR2 expression temporally precedes TBR1 expression in neuronal precursor cells (Englund et al., 2005). The density of TBR2-immunostained cells in the anterior cortical wall, throughout VZ, SVZ, and the intermediate zone, was reduced in Fgfr2 cKO and Fgfr1;Fgfr2 DKO mice at E16.5 compared with controls (Fig. 2G,H,J). The 27% TBR2 deficit found in this sample of Fgfr1;Fgfr2 DKO mice (n = 2 per group) was confirmed in another sample of Fgfr1;Fgfr2 DKO mice (n = 2 per group) in an independent experiment, which demonstrated a 21% deficit in TBR2 density.
To understand the mechanism by which TBR2+ intermediate precursors were depleted in Fgfr2 cKO and Fgfr1;Fgfr2 DKO animals, we first evaluated whether cell proliferation was affected by using the cell cycle proteins pH3 and PCNA, which are constitutively expressed by dividing cells during M-phase and throughout the cell cycle, respectively. Consistent with the TBR2 data, the density of PCNA+ cells was reduced in the SVZ of Fgfr1;Fgfr2 DKO at E16.5 compared with control mice (supplemental Fig. 1, available at www.jneurosci.org as supplemental material). Stereological assessment of the number of pH3+ cells demonstrated a 40% reduction in the number of mitotic cells in the VZ in Fgfr1;Fgfr2 DKO (Fig. 2G–I). Furthermore, the distribution of pH3+ cells in basal versus apical regions of VZ was altered. Dividing cells within basal regions (closer to the pial surface) reflect the proliferative activity of intermediate precursors of the SVZ, whereas dividing cells within apical regions (apposing the ventricular surface) reflect proliferative activity of primary progenitors of the VZ; examining the ratio of basal to apical pH3+ cells within specific areas of developing cortex examines effects on each population while controlling for overall alterations in proliferation. The ratio of basal to apical pH3+ nuclei in the dorsal telencephalon was significantly increased in Fgfr1;Fgfr2 DKO compared with control littermates. The basal/apical ratio was more significantly affected in anterior (0.81 ± 0.23 vs 1.47 ± 0.16 in controls vs Fgfr1;Fgfr2 DKO) than posterior regions (0.68 ± 0.06 vs 0.89 ± 0.16 in controls vs Fgfr1;Fgfr2 DKO). Alterations in the pH3+ basal/apical ratio were attributable to disproportionate reductions of pH3+ apical cells in mutant mice. Indeed, the density of apical pH3+ cells was 36 ± 2.6 cells/field in controls versus 21 ± 1.8 cells/field in Fgfr1;Fgfr2 DKO, whereas the density of basal pH3+ cells was 27 ± 5.5 in controls versus 24 ± 2.6 cells/field in Fgfr1;Fgfr2 DKO. Again, this difference was almost threefold greater in anterior sections, with 55% fewer apical pH3+ cells (p < 0.05), compared with posterior sections, which showed only 21% fewer apical pH3+ cells. The specificity of this loss to the apical side suggested that FGFR signaling affected radial glial progenitors in VZ primarily.
To further understand the mechanism of these deficits in radial glial and intermediate progenitors, we evaluated cell renewal and cell death among neural precursor cells of the VZ and SVZ. Specifically, we quantified the number of dividing cells at E14.5 (labeled with BrdU) that reentered the cell cycle by E15.5 or E16.5 (as determined by double-labeling with PCNA). The fraction of BrdU-labeled cells that reentered the cell cycle (PCNA/BrdU double-labeled cells) was reduced in the VZ of Fgfr1;Fgfr2 DKO animals compared with their littermate controls (ANOVA for genotype, F(1,9) = 24.83; p = 0.002) (Fig. 3A–P; Q,R, quantification). Virtually all of these PCNA/BrdU double-labeled cells in the VZ were also positive for Pax6, a transcription factor expressed by radial glial cells. In contrast, the proportion of cells reentering the cell cycle was not significantly different in mutants versus controls in the SVZ (Pax6-negative cells), although a trend to a decrease was noted 48 h after BrdU labeling (i.e., at E16.5) (Fig. 3R). Furthermore, at both time points (i.e., E15.5 and E16.5), the thickness of the VZ, as assessed by Pax6 immunostaining, was markedly reduced in Fgfr1;Fgfr2 DKO compared with control littermates (Fig. 3, compare B, J, with F, N). Small increases in the number of dying cells were observed at E15.5 and E16.5 in Fgfr1;Fgfr2 DKO compared with littermate controls (supplemental Fig. 2, available at www.jneurosci.org as supplemental material). However, the quantity of embryonic cell death was insufficient to account for the deficit in neuronal precursors. Hence, the loss of normal FGFR signaling in dorsal telencephalic cells produces a deficient self-renewal of Pax6+ precursors in the VZ.
Adult cortical morphometry and cell number
The Fgfr2 cKO and Fgfr1;Fgfr2 DKO lacked the corpus callosum and hippocampal commissure ∼66 and 90% of the time, respectively, a more frequent occurrence of this deficit than described for the Fgfr1 cKO mice (Smith et al., 2006). Brain volume in the Fgfr2 cKO, Fgfr1;Fgfr2 DKO, and respective control animals was assessed by stereological methods. Total cortical volume was decreased by 25.8% in the Fgfr1;Fgfr2 DKO and by 9.2% in Fgfr2 cKO animals compared with control littermates (Fig. 4A–D, Table 1). Cortical surface area and thickness were both affected to the same degree in Fgfr2 cKO animals compared with controls (thickness decreased by 7.9%; surface area decreased by 6.5%).
Figure 4.
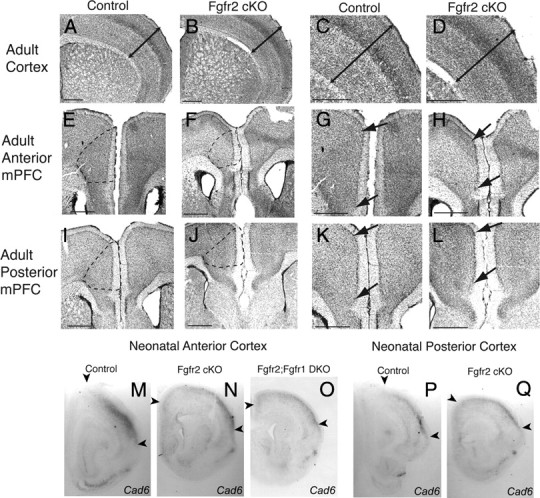
Decrease in adult (three-month-old) neocortical and mPFC volume in Fgfr2 cKO and Fgfr1;Fgfr2 DKO mice and neonatal (postnatal day 0) expression of areal markers in cerebral cortex. A–D, Cresyl violet staining demonstrating decrease in circumferential and thickness (as indicated by arrows) dimensions of the neocortex in an Fgfr2 cKO mouse (B, D) compared with a Cre− control animal (A, C). E, F, I, J, Cresyl violet staining demonstrating representative boundaries (broken lines) used to define medial prefrontal cortex and the significant decrease in size in an Fgfr2 cKO animal (F, J) compared with a control (E, I). G, H, K, L, Higher magnification of images from E, F, I, and J. Dorsal and ventral boundaries of mPFC are shown (arrows) as defined by cytoarchitectonic changes in layers II and V (top arrow marking end of gradual decrease in density of cells from mPFC to precentral cortex; bottom arrow marking decrease in evenness of layer II cells from mPFC to infralimbic cortex). M–Q, In situ hybridization for Cadherin 6 in PO brain demonstrating medially shifted distribution of expression in Fgfr2 cKO (N, Q) and Fgfr1;Fgfr2 DKO (O) mice compared with a control littermate (M, P). Scale bar, 500 μm.
Table 1.
Fgfr2 cKO and Fgfr1;Fgfr2 DKO mice exhibit decreases in cortical gray and white matter volumes compared with their respective controls
| Fgfr2 control | Fgfr2 cKO | Difference | Fgfr1;Fgfr2 control | Fgfr1;Fgfr2 DKO | Difference | |
|---|---|---|---|---|---|---|
| Total cortical volume | 63.1 ± 2.56 | 57.2 ± 1.61 | −9.2% | 69.45 ± 2.78 | 51.50 ± 1.06 | −25.8% |
| (n = 6) | (n = 5) | (p < 0.05) | (n = 6) | (n = 5) | (p < 0.005) | |
| mPFC volume | 2.55 ± 0.24 | 2.01 ± 0.13 | −21.0% | 2.60 ± 0.21 | 1.66 ± 0.19 | −36.1% |
| (n = 6) | (n = 6) | (p < 0.05) | (n = 6) | (n = 5) | (p < 0.005) | |
| vOBC volume | 2.57 ± 0.35 | 2.94 ± 0.32 | 15% | 2.83 ± 0.32 | 2.21 ± 0.23 | −21.9% |
| (n = 6) | (n = 6) | (NS) | (n = 6) | (n = 5) | (NS) | |
| CC volume | 7.19 ± 0.82 | 7.23 ± 1.03 | 0.6% | 5.67 ± 0.32 | 5.29 ± 0.72 | −6.6% |
| (n = 3) | (n = 3) | (NS) | (n = 3) | (n = 3) | (NS) | |
| White matter volume | 5.35 ± 0.39 | 2.66 ± 0.09 | −50.3% | 5.35 ± 0.39 | 2.28 ± 0.02 | −57.5% |
| (n = 3) | (n = 3) | (p < 0.005) | (n = 3) | (n = 2) | (p < 0.01) | |
| S100β count (×103) | 33.23 ± 0.96 | 35.33 ± 0.73 | 6.3% | 33.23 ± 0.96 | 38.23 ± 0.63 | 15.0% |
| (n = 3) | (n = 3) | (NS) | (n = 3) | (n = 2) | (NS) |
Volumes and cell numbers were obtained by stereological analyses in 3-month-old animals. All volumes are shown in cubic millimeters. Total cortex, Overall neocortex, not including mPFC, ventral orbital, or cingulate regions.
Values of p were obtained from unpaired, two-tailed Student's t test.
Based on previous findings that some FGF ligands binding to FGFR1 and FGFR2 are expressed in gradients emanating from the anterior midline (Maruoka et al., 1998; Xu et al., 1999; Crossley et al., 2001; Storm et al., 2006) and findings in the current study showing greater reductions in apical pH3+ cells anteriorly, anterior and medial cortical regions were subdivided on the basis of cellular architecture, as described in the rat by Krettek and Price (1977) to parcellate midline integrative areas from sensory and motor regions in more dorsal and lateral zones and from more ventral limbic cortices (Fig. 4E–L). Stereology was used to estimate the volume and neuron number in the dorsomedial frontal cortical region, also called mPFC, compared with the vOFC and CC.
As noted above, Fgfr2 cKO animals showed a decrease in cortical volume across regions compared with controls (F(1,35) = 3.900; p = 0.05), but interestingly, they also showed a genotype by region interaction (F(2,35) = 3.544; p = 0.042). Indeed, there was a 21% decrease in volume of mPFC in the Fgfr2 cKO animals, which was more than twofold as affected as the overall cortex (Fig. 4, Table 1). For the Fgfr1;Fgfr2 DKO animals, decreases in cortical volume were comparable across regions (ANOVA, genotype by region, nonsignificant). These animals showed a 36.1% decrease in mPFC volume, a deficit equivalent to that in overall cortex (Table 1). Within the mPFC, the surface area in its dorsal–ventral extent was observed to be more affected than its thickness. The other frontal and medial cortical regions, vOFC and CC, showed no significant decreases in volume in either of the mutant animals (Table 1) and were also not observed to have reductions in the surface area or thickness compared with controls.
This volume decrease in mPFC was confirmed with in situ hybridization for Cad6. Cad6, a gene that is expressed in lateral dorsal cortex (the somatosensory region), undergoes a medial shift in its expression pattern in Fgf17 mutant mice, which have a contraction of mPFC areas and a corresponding expansion of the adjacent somatosensory territory (Cholfin and Rubenstein, 2007). In Fgfr2 cKO and Fgfr1;Fgfr2 DKO mice, Cad6 expression extended more medially, consistent with a reduction in the mPFC territory without a corresponding expansion of adjacent cortical areas (Fig. 4M–Q). This is consistent with an FGFR-mediated change in neurogenesis affecting the size of mPFC neuronal population, rather than global cortical repatterning.
To assess whether the reduction in cortical volumes was attributable to a change in total neuron number, excitatory neurons in the cortex were evaluated by stereological sampling of serial sections using antibodies against two pyramidal cell markers, the transcription factor TBR1 and the neurofilament SMI-32. TBR1 is enriched in pyramidal neurons populating lower cortical layers, whereas SMI-32 is expressed by a subset of pyramidal neurons in all cortical layers (layers II, V, and VI). TBR1 neuron number in Fgfr1;Fgfr2 DKO animals was decreased to the same extent in the overall neocortex and in mPFC (33 and 31%, respectively; nonsignificant interaction of genotype and brain region by ANOVA) (Table 2). TBR1 appeared reduced in both upper and lower cortical layers (Fig. 5K,L; O,P). In contrast to TBR1, evaluation of SMI-32+ neurons demonstrated more severe reductions in number and density that were greater in mPFC (ANOVA for genotype, F(1,23) = 7.191; p = 0.016; genotype by region interaction, F(2,23) = 3.692; p = 0.016). Indeed, the number of SMI-32+ cortical neurons of Fgfr1;Fgfr2 DKO adult mice were reduced by 36 and 62% in overall neocortex and mPFC, respectively, compared with control mice (Table 3). Like TBR1, SMI32 appeared reduced in both upper and lower cortical layers (Fig. 5I,J; M,N). In the mPFC, the density of SMI-32+ neurons was also reduced: there were 4.31 ± 0.52 (SEM) SMI-32+ neurons in control and 1.78 ± 0.24 × 10⁵ cells/mm3 (p < 0.01) in Fgfr1;Fgfr2 DKO mice. The CC exhibited a lesser decrease in excitatory neuron number (19.8 and 15% for TBR1 and SMI-32, respectively), and the vOFC showed a variable effect (no significant effect for TBR1 and 52% decrease for SMI-32) (Tables 2, 3).
Table 2.
Fgfr2 cKO mice show a selective decrease in TBR1+ neuron number in mPFC compared with overall neocortex
| Fgfr2 control number (×106) | Fgfr2 cKO number (×106) | Difference | Fgfr1;Fgfr2 control number (×106) | Fgfr1;Fgfr2 DKO number (×106) | Difference | |
|---|---|---|---|---|---|---|
| Total cortical TBR1 | 7.80 ± 1.10 | 6.49 ± 0.24 | −16.8% | 6.84 ± 0.34 | 4.58 ± 0.37 | −33.0% |
| (n = 3) | (n = 3) | (NS) | (n = 6) | (n = 5) | (p < 0.001) | |
| mPFC TBR1 | 0.17 ± 0.01 | 0.11 ± 0.01 | −37.0% | 0.18 ± 0.01 | 0.12 ± 0.01 | −30.8% |
| (n = 6) | (n = 6) | (p < 0.005) | (n = 6) | (n = 5) | (p < 0.01) | |
| vOBC TBR1 | 0.15 ± 0.02 | 0.16 ± 0.02 | 7.8% | 0.17 ± 0.02 | 0.20 ± 0.03 | 16.7% |
| (n = 6) | (n = 6) | (NS) | (n = 6) | (n = 5) | (NS) | |
| CC TBR1 | 0.87 ± 0.1 | 0.67 ± 0.03 | −22.6% | 0.57 ± 0.01 | 0.46 ± 0.04 | −19.8% |
| (n = 3) | (n = 3) | (NS) | (n = 3) | (n = 3) | (p < 0.05) |
Number of TBR1+ neurons obtained by stereological analyses (±SEM) in 3-month-old animals. Total cortex, Overall neocortex, not including mPFC, ventral orbital, or cingulate regions.
Values of p were obtained from unpaired Student's t test, two-tailed for Fgfr2 cKO and one-tailed for Fgfr1;Fgfr2 DKO.
Figure 5.
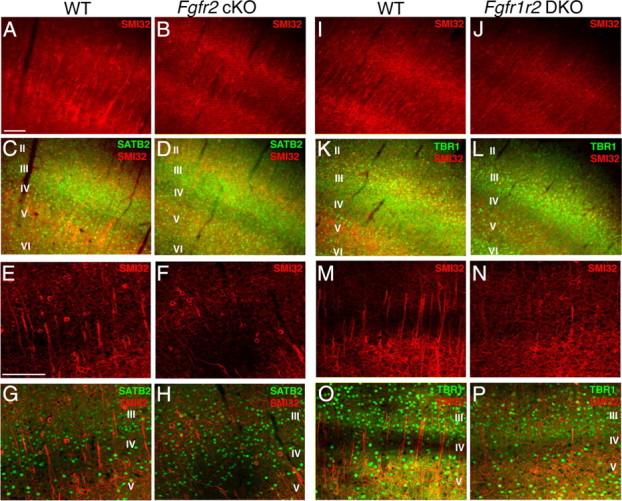
Excitatory neurons decreased in neocortex of Fgfr2 cKO and Fgfr1;Fgfr2 DKO mice compared with controls at 3 months of age. SMI-32 immunostaining showing reduced pyramidal cell number in the neocortex of Fgfr2 cKO (A–H) and DKO (I–P) animals. C, D, G, H, Relative thickness of cortical layers shown with SATB2 and SMI-32 double staining was similar in control and Fgfr2 cKO animals. K, L, O, P, TBR1+ cells were decreased in a Fgfr1;Fgfr2 DKO animals, with greater reductions in upper layers. Scale bar, 100 μm.
Table 3.
Fgfr2 cKO and Fgfr1;Fgfr2 DKO mice show stronger decreases in SMI-32 excitatory neuron number in mPFC compared with overall neocortex
| Fgfr2 control number (×105) | Fgfr2 cKO number (×105) | Difference | Fgfr1;Fgfr2 control number (×105) | Fgfr1;Fgfr2 DKO number (×105) | Difference | |
|---|---|---|---|---|---|---|
| Total cortical SMI-32 | 10.4 ± 0.14 | 6.78 ± 0.05 | −35% | 24.44 ± 3.96 | 15.77 ± 3.44 | −36.0% |
| (n = 3) | (n = 3) | (p < 0.05) | (n = 3) | (n = 3) | (p = 0.08) | |
| mPFC SMI-32 | 0.28 ± 0.05 | 0.13 ± 0.02 | −51.6% | 0.85 ± 0.11 | 0.33 ± 0.05 | −62% |
| (n = 3) | (n = 3) | (p < 0.05) | (n = 3) | (n = 3) | (p < 0.01) | |
| vOBC SMI-32 | 0.28 ± 0.08 | 0.20 ± 0.04 | −28.5% | 1.03 ± 0.14 | 0.50 ± 0.02 | −52% |
| (n = 3) | (n = 3) | (NS) | (n = 3) | (n = 3) | (p < 0.01) | |
| CC SMI-32 | 0.77 ± 0.05 | 0.68 ± 0.06 | −12.1 | 3.01 ± 0.55 | 2.55 ± 0.14 | −15% |
| (n = 3) | (n = 3) | (NS) | (n = 3) | (n = 3) | (NS) |
Number of SMI-32+ neurons obtained by stereological analyses (±SEM) in 3-month-old animals. Total cortex, Overall neocortex, not including mPFC, ventral orbital, or cingulate regions.
Values of p were obtained from unpaired Student's t test, two-tailed for Fgfr2 cKO and one-tailed for Fgfr1;Fgfr2 DKO.
We next analyzed the phenotype of Fgfr2 cKO mutants. The Fgfr2 cKO animals also showed significant deficits in TBR1+ neuron numbers in cortex compared with controls (ANOVA for genotype, F(1,29) = 4.373; p = 0.047). Interestingly, the Fgfr2 cKO animals showed a 37% deficit in TBR1 neuron number in mPFC, comparable with that observed in the Fgf1;Fgfr2 DKO mice (Table 2); however, the interaction between genotype and brain region only approached significance (F(2,29) = 3.124; p = 0.062). The density of TBR1+ neurons in mPFC was also decreased by 27% (0.74 ± 0.05 and 0.54 ± 0.05 × 10⁵ cells/mm3 in control and Fgfr2 cKO mice, respectively; p < 0.05). In contrast, neither the vOFC, CC, nor the neocortex of Fgfr2 cKO animals had significant decreases in TBR1 number and density compared with controls (Table 2). To assess any gradient of effect on TBR1+ cell density in cortex, cell density was quantified separately in three regions: rostral, intermediate, and caudal cortex. A gradient of the TBR1+ cell deficiency demonstrated that the lack of Fgfr2 affected rostral cortical regions to a greater extent than caudal regions (supplemental Fig. 3, available at www.jneurosci.org as supplemental material).
The more widely distributed excitatory neurons labeled with SMI-32 were decreased to a greater extent in the Fgfr2 cKO mutant cortex than TBR1 neurons (Fig. 5A–H, Table 3) (ANOVA, F(1,17) = 6.948; p = 0.022). In overall neocortex, there was a 35% decrease in both number and density of SMI-32+ neurons in Fgfr2 cKO animals compared with controls (Table 3). However, there was a stronger 52% decrease in SMI-32 neuron number within the mPFC in Fgfr2 cKO animals (Table 3). The interaction of cortical SMI-32 number between genotype and region was statistically significant (F(2,17) = 5.797; p = 0.017). The density of SMI-32+ neurons in overall neocortex was also decreased (i.e., 1.53 ± 0.28 and 1.01 ± 0.02 × 10⁵ cells/mm3 in control and Fgfr2 cKO mice, respectively) (p < 0.05). In vOFC and CC, SMI-32 counts were lower in mutants than in controls, but differences were not shown to be significant. The similarity in pyramidal neuron loss in mPFC among Fgfr1;Fgfr2 DKO and Fgfr2 cKO animals (−62 and −52% for SMI-32 and −31 and −37% for TBR1, respectively) suggest that the Fgfr2 gene, but not the Fgfr1 gene, is important for the acquisition of an appropriate number of pyramidal cells and volume expansion of the mPFC. Despite the overall reduction in cortical thickness, layer distribution did not appear significantly different as assessed by SATB2 and SMI-32 staining (Fig. 5C,D; G,H).
The loss of TBR1+ and SMI-32+ neurons was consistent with the volume losses documented for the overall cortex and prefrontal regions. In addition, decreases in the density of excitatory neurons in mutant mice might also suggest that a compensatory expansion of some nonexcitatory neuron elements was enacted in cortical development. However, DAPI cell density within mPFC demonstrated a deficit in Fgfr2 cKO mice (18.24 × 10⁻⁵ cells/mm3) compared with controls (22.35 × 10⁻⁵ cells/mm3), which was higher than the cumulative loss of SMI-32 and TBR1+ neuron density in mPFC. This suggests that mutant mice had no compensatory proliferation of cells within cortex and that the decrease in excitatory neuron density is attributable to an expansion of the neuropil.
Last, despite the overall reduction in cortical thickness, layer distribution did not appear significantly different. Fgfr2 cKO and Fgfr1;Fgfr2 DKO mice were similar to control littermates in the distribution of lower layers, assessed by SATB2 and SMI-32 staining (Fig. 5C,D; G,H), as well as upper layers, assessed by Brn-1, Cux-1, expressed in cortical layers II and III, and Reelin, a marker for cortical layer I (supplemental Fig. 4, available at www.jneurosci.org as supplemental material).
Consistent with the pyramidal neuron deficits, adult animals lacking either Fgfr2 (Fig. 6) or both Fgfr1 and Fgfr2 (Table 1) showed significant reductions in cortical white matter compared with controls. White matter volume in Fgfr2 cKO animals was reduced by one-half, and white matter tracts were clearly reduced. Fgfr2 cKO animals frequently lacked a corpus callosum, which contributed to deficits in white matter found in medial compartments of cortical white matter (−68%; p < 0.005). However, white matter volume was also reduced in lateral compartments (−37%; p < 0.01). S100β+ glial cells populating white matter regions showed no deficit in the brains of either Fgf receptor knock-out animal lines (Table 1). As no deficit in oligodendrocytes or myelin has been observed in mice lacking Fgfr2 in oligodendrocyte progenitors (Kaga et al., 2006), and Cre recombination does not affect the diencephalon in our mutants, the data suggest that the deficit in white matter volume is likely attributable to a decrease in number, caliber, and/or branching of efferent cortical neuronal fibers of pyramidal cells.
Figure 6.
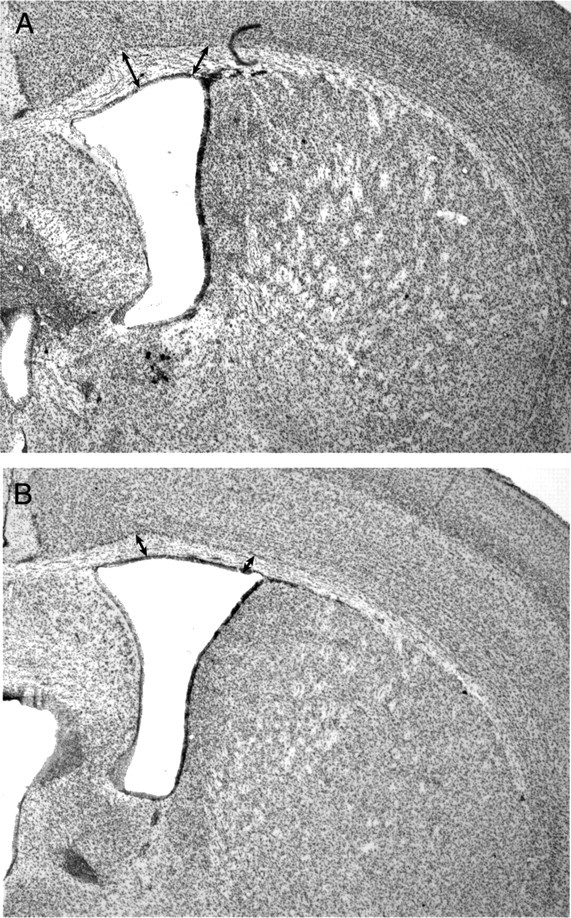
Decrease in cortical white matter volume in 3-month-old Fgfr2 cKO mice. A, B, Cresyl violet staining demonstrating decrease in thickness (as indicated by arrows) of cortical white matter in Fgfr2 cKO mice (B) compared with a Cre− control animal (A).
Glutamate terminals in subcortical regions
The observed decrease in cortical excitatory neurons, particularly in mPFC, and cortical white matter suggested that projections to subcortical regions would be affected in mice lacking Fgfr2. Glutamatergic projections were evaluated with electron microscopy in the BST, a known site of projection for the mPFC (Heidbreder and Groenewegen, 2003). A 73% reduction in excitatory synaptic terminals immunostained with the glutamate transporter vGlut2 was identified in the BST of Fgfr2 cKO mice compared with controls (p < 0.05) (Fig. 7). Inhibitory synapses within the same brain region were not reduced, demonstrating a specific deficit in efferent synapses likely attributable to reduced projections from mPFC.
Figure 7.
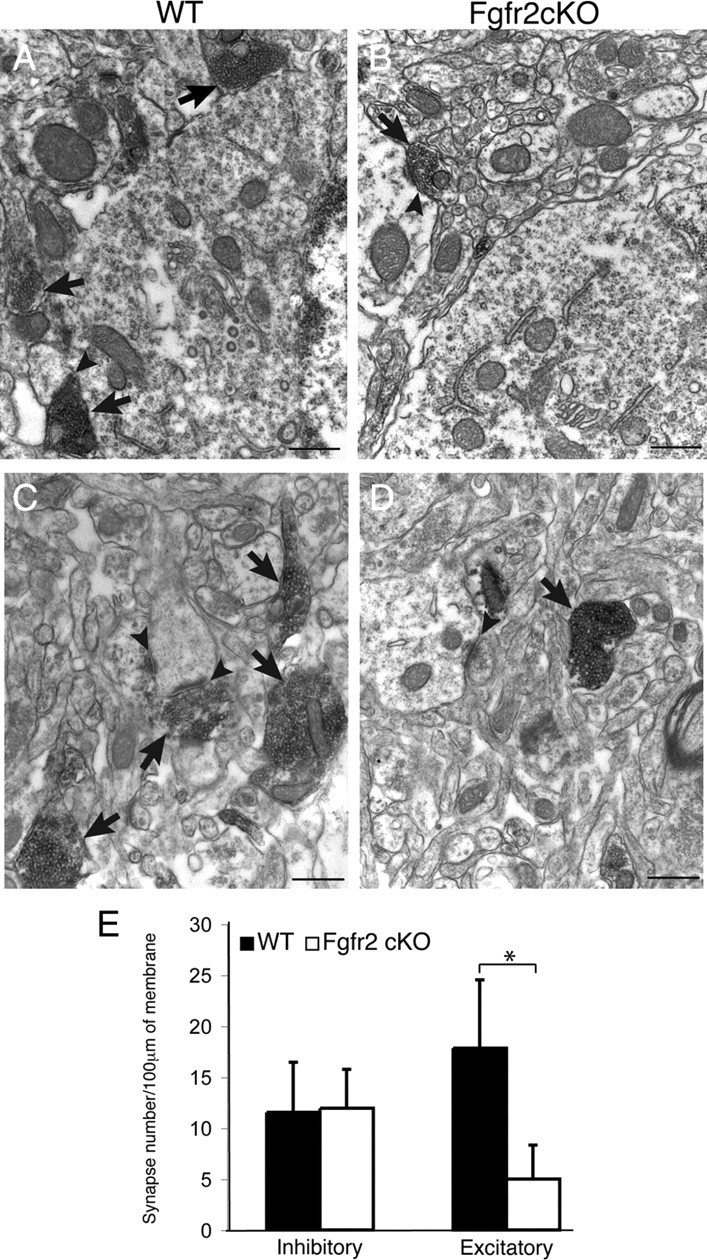
Subcortical projections of mPFC are decreased in 3-month-old Fgfr2 cKO animals. A–D, Electron micrographs of vGlut2 focused on cell bodies (A, B) and axons (C, D) preembedding immunocytochemistry, demonstrating reduced density and size of projections (arrows) and synapses (arrowheads) in the BST of Fgfr2 cKO animals (B, D) compared with Cre− controls (A, C). Scale bars, 1 μm. E, Quantification of inhibitory and excitatory synapse density in BST (n = 3, 3) demonstrating no decrease in inhibitory synapses but significant decrease in excitatory synapses (*p < 0.05) in Fgfr2 cKO animals compared with Cre− controls. Error bars indicate SEM.
Subcortical inhibitory neurons
To evaluate whether the loss of mPFC neurons and their synaptic terminals secondarily affect neurons in target regions, we examined two subcortical regions that receive projections from mPFC, the BST and the septal nuclei. Compared with control mice, adult Fgfr2 cKO mice exhibited strong decreases of 80 and 62% in inhibitory neurons immunoreactive for GABA within the BST and septum, respectively (Fig. 8C,D, Table 4). Similarly, significant decreases of 54 and 38% were found in the densities of CR+ neurons in BST and septum, respectively, of Fgfr2 cKO mice compared with controls. A 48% deficit in somatostatin+ cells was found restricted to the BST (Table 4). Neurons immunoreactive for calbindin showed a trend to decreased densities in both the BST and septum. Notably, Cre recombination did not affect these regions (Fig. 1A), suggesting that cell deficiencies were attributable to secondary effects. Examinations of a pan-neuronal marker, NeuN, in the septum of adult animals demonstrated deficits of neuronal densities of 23.6% in septum and 33.0% in BST (n = 2, 2). GABA+ cells were ∼60% of total NeuN+ cell numbers in both regions, suggesting that the loss of GABA+ and CR+ cells was a true cellular deficit, accounted for by a proportional loss in total neuron number.
Figure 8.
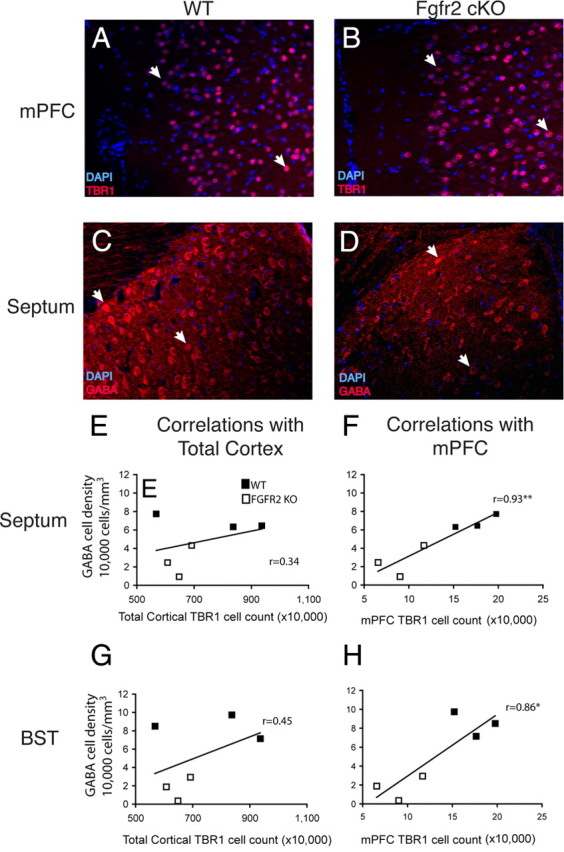
Correlations of TBR1+ cell number in mPFC and density of GABA+ cell density in subcortical septum and BST in 3-month-old mice. A, B, TBR1 immunostaining showing reduced cell number in mPFC of a Fgfr2 cKO animal (B) compared with a Cre− control (A). Examples are shown of positive cells counted for stereological results (arrows). C, D, GABA staining in the same Fgfr2 cKO (D) and Cre− control (C) animals showing reduced cell density in the dorsolateral septum. Examples are shown of positive cells counted for stereological results (arrows). E–H, Correlation plots showing the absence of correlation between total cortical TBR1 number and GABA neuron density in septum (E) and BST (G) and the significant correlations (*p < 0.05; **p < 0.01) between TBR1 neuron number in mPFC and GABA neuron density in septum (F) and BST (H).
Table 4.
Inhibitory neurons in subcortical regions of Fgfr2 cKO mice were significantly decreased in density compared with Cre− controls
| Fgfr2 control density (×103/mm3) | Fgfr2 cKO density (×103/mm3) | Difference | |
|---|---|---|---|
| BST GABA | 84.73 ± 7.48 | 17.35 ± 7.48 | −79.5% |
| (n = 3) | (n = 3) | (p < 0.005) | |
| Septum GABA | 68.45 ± 4.49 | 25.70 ± 9.81 | −62.5% |
| (n = 3) | (n = 3) | (p < 0.01) | |
| BST calretinin | 31.68 ± 5.44 | 14.70 ± 2.56 | −53.6% |
| (n = 7) | (n = 6) | (p < 0.01) | |
| Septum calretinin | 20.37 ± 2.56 | 12.47 ± 2.14 | −38.8% |
| (n = 7) | (n = 6) | (p < 0.05) | |
| BST somatostatin | 5.09 ± 0.40 | 2.34 ± 0.56 | −48% |
| (n = 3) | (n = 3) | (p < 0.01) | |
| Septum somatostatin | 5.83 ± 1.90 | 5.19 ± 0.50 | −11.0% |
| (n = 3) | (n = 3) | (NS) | |
| BST calbindin | 21.28 ± 5.63 | 14.93 ± 5.67 | −29.8% |
| (n = 3) | (n = 3) | (NS) | |
| Septum calbindin | 12.92 ± 3.65 | 8.05 ± 0.82 | −37.7% |
| (n = 3) | (n = 3) | (NS) | |
| BST parvalbumin | 1.49 ± 0.44 | 1.49 ± 0.52 | 0.5% |
| (n = 5) | (n = 3) | (NS) | |
| Septum parvalbumin | 2.88 ± 0.48 | 2.54 ± 0.28 | −11.9% |
| (n = 3) | (n = 3) | (NS) |
Number of inhibitory neurons types obtained by stereological analyses (±SEM) in 3-month-old animals.
Values of p were obtained from two-tailed, unpaired Student's t test.
To explore the mechanism of the inhibitory neuron losses, we examined neonatal and P7 animals. The septum of Fgfr2 cKO and Fgfr1;Fgfr2 DKO mice and control littermates demonstrated comparable densities of GAD67+ and GABA+ cells at P0 and P7, respectively (supplemental Fig. 5A–D,K,L, available at www.jneurosci.org as supplemental material). Calretinin+ cells, which were decreased in the septum of adult animals, were not altered in the septum of control and mutant animals at P0 and P7 (supplemental Fig. 5E,F; I,J, available at www.jneurosci.org as supplemental material). We also analyzed Fgfr1;Fgfr2 DKO animals carrying a GAD67-GFP transgene, which labels all GABAergic interneurons from the time they are generated during embryogenesis (Tamamaki et al., 2003). GAD67-GFP+ cells showed no deficiency in the developing septum of Fgfr1;Fgfr2 DKO animals at P0 (supplemental Fig. 5G,H, available at www.jneurosci.org as supplemental material). Together, the data suggest that the loss of GABAergic cells develops sometime in the postnatal period.
We then examined potential relationships between the cerebral cortical and subcortical phenotypes by statistical analyses. The density of GABA+ cells in BST and septum in WT and Fgfr2 cKO mice correlated with the number of TBR1+ cells in mPFC (r = 0.86, p < 0.05 for BST; r = 0.93, p < 0.01 for septum) (Fig. 8F,H) but not with the number of TBR1-positive cells in total cortex (Fig. 8E,G). The density of GABA-positive cells in BST but not in septum also correlated with cortical white matter volume (r = 0.92, p < 0.01 for BST, and r = 0.78 for septum, respectively).
Discussion
The present results demonstrate that the inactivation of Fgfr2 or both Fgfr1/Fgfr2 caused a reduction in excitatory cortical neurons within the neocortex, with a stronger reduction in mPFC. The decrease in excitatory cortical neurons is attributable to FGFRs being required for upregulating the self-renewal of radial glial precursor cells in the VZ, particularly in anterior regions of the VZ. Neurons in mPFC were reduced in Fgfr2 cKO mice to an extent comparable with that of mice lacking both receptors, suggesting that Fgfr2 by itself plays the major role in mPFC development. Excitatory glutamatergic projections within the dorsal BST, a subcortical structure that receives axon terminals from the mPFC, were also significantly reduced in Fgfr2 cKO mice. Furthermore, both the dorsal BST and septum, which also receives projections from the mPFC, showed decreased numbers of inhibitory neurons, which can be attributed to impaired postnatal survival secondary to the lack of excitatory mPFC afferents.
Given that the hGFAP-Cre driver induces recombination of the Fgfr1 and Fgfr2 genes beginning at E13.5, after most of cortical layer VI is already generated, this mouse model allows us to assess the role of FGF signaling in the development of layers II–V. In accordance, we observed that Fgfr2 cKO and DKO mice have greater deficiencies in SMI-32+ neurons, which localize to many layers of cortex, than Tbr1+ neurons, which is primarily, albeit not exclusively, expressed by layer VI cells. Nevertheless, the lack of FGFR1 and FGFR2 did not affect the overall layer structure of the cerebral cortex.
Multiple analyses demonstrated a pronounced shrinkage of mPFC volume in Fgfr2 cKO as well as Fgfr1;Fgfr2 DKO mice. Whereas a relatively modest, albeit significant, 35% decrease in SMI-32+ cells was observed in the overall neocortex of Fgfr2 cKO and Fgfr1;Fgfr2 DKO mice, the number of SMI-32+ excitatory neurons was more strongly reduced (50–60%) in the mPFC of these mutant animals compared with littermate controls. Furthermore, Fgfr2 cKO and double KO mice had comparable deficits in SMI-32+ excitatory neurons in mPFC as well as neocortex, suggesting that defects in cortical pyramidal cells of layers V–II of these mutants are primarily attributable to the loss of Fgfr2. Equivalent defects in TBR1+ cells were found in the mPFC of both mutant lines, confirming that Fgfr2 contributes more to mPFC development. The more marked decrease in TBR1+ neurons in the neocortex of DKO mice suggested that Fgfr1 and Fgfr2 together are required for the development of TBR1+ neurons in more posterior cortical regions. Together with previous findings of midline deficits with earlier disruptions of Fgfr2 (Gutin et al., 2006), these data implicate Fgfr2 uniquely in the growth of anteromedial cortex, whereas recent data implicate Fgfr3 in the growth of caudolateral (occipitotemporal) cortex (Thomson et al., 2009). The data also suggest that the FGF ligands, including FGF8 and FGF17, which are expressed in the rostromedial portion of the telencephalon (MacArthur et al., 1995; Chellaiah et al., 1999; Bachler and Neubüser, 2001) interact preferentially with FGFR2 to affect neurogenesis in mPFC.
The Fgfr2 cKO examined here starts during neurogenesis, after patterning of frontal and frontomedial cortex involving FGF8 and FGF17 is thought to have already occurred (Fukuchi-Shimogori and Grove, 2001; Garel et al., 2003; Storm et al., 2006; Cholfin and Rubenstein, 2007). Our data suggest that FGF ligand/receptor interactions may continue to regulate cortical area formation by different mechanisms at later stages of development (Hoch et al., 2009). We propose that FGF8 and FGF17 first specify the anterior cortical territory by acting on patterning genes, and then, through interaction with FGFR2, expand this territory by promoting progenitor self-renewal and the addition of more excitatory neurons to anterior regions of the cortical plate. FGF receptors are required for self-renewal of radial glial cells in the VZ rather than SVZ precursors, since (1) proliferating VZ cells, but not SVZ intermediate precursors, were less likely to reenter the cell cycle in Fgfr1;Fgf2 DKO mice; (2) DKO mice also demonstrated a disproportionate loss of apical mitoses, which involve primarily radial glial cells. A recent report (Kang et al., 2009) suggests that the loss of all three FGF receptors at E13.5 decreases radial glial cell self-renewal by increasing their differentiation into TBR2+ intermediate progenitors.
Previous results have suggested that Fgfr3 overexpression leads to an increase of TBR2+ cells in the SVZ of caudal cortical regions (Thomson et al., 2009). SVZ Tbr2+ cells are thought to be precursors for TBR1+ excitatory pyramidal cortical neurons (Pontious et al., 2008), and TBR2 expression is necessary for appropriate cortical thickness, surface area, and neuron number (Sessa et al., 2008). Notwithstanding the primary cell renewal defect we found in the VZ, defects in mitotically active cells in the SVZ and TBR2+ intermediate precursors that we observed likely represent a deficit in progenitors contributed to SVZ from VZ. Entirely ruling out a specific defect in the SVZ will require fate mapping of SVZ cells.
The data presented here do not address the possibility that cell cycle length was affected by the conditional elimination of Fgfr2 and Fgfr1;Fgfr2. In our previous reports on FGF2, thought to bind and signal through FGFR1 and FGFR2, a decrease in the total population of proliferating progenitors but no cell cycle length alterations were observed (Vaccarino et al., 1999; Zheng et al., 2004), consistent with a recent report on hGFAP-Cre Fgfr1;Fgfr2 flox, Fgfr3 null mice (Kang et al., 2009).
Our data do not exclude that FGFRs may also be involved in the generation of the earliest contingent of TBR1+ excitatory neurons from the VZ, which are thought to migrate to the cortical plate without sojourning in the SVZ (Miyata et al., 2001); future experiments using earlier expressed Cre drivers are required to demonstrate this. A much earlier cKO of Fgfr2, produced using the FoxG1::Cre line, however, did not produce gross abnormalities, although mPFC or neocortical volume and neuron number were not quantitatively assessed; rather, these mutants exhibited an increase in the density of proliferative markers in the VZ (Ever et al., 2008). This may be explained both by differences in the methodology used for morphometric analyses and by functional redundancy of Fgfr2 with other Fgfr at this early stage of development.
In summary, the expression of Fgfr1 and Fgfr2 within radial glial cells of the telencephalic VZ (Hasegawa et al., 2004; Yoon et al., 2004; Gregg and Weiss, 2005; Smith et al., 2006) combined with the results presented here reinforce the idea that FGFR may induce cell cycle reentry of Pax6+ cells in the VZ and therefore contribute to radial glia self-renewal rather than differentiation in the embryonic cerebral cortex. Although deficits in the density of TBR2+ at E16.5 (25–40%) are similar to deficits in SMI-32+ cells at 3 months of age, a continuing role of these receptors on the postnatal maturation of the cortex cannot be excluded.
Deficiencies in subcortical inhibitory neurons were also observed in Fgfr2 cKO. The inhibitory neuron defect is likely not induced by cell-autonomous means. Precursors for these neurons in mouse do not arise from dorsal telencephalic radial glia, but from the ventral ganglionic eminences, which are not targeted by the hGFAP-Cre transgene (Fig. 1) (Ohkubo et al., 2004). Consistently, no differences in septal inhibitory neuron populations were evident at birth, suggesting that the prenatal development of these cells was likely not affected. Our observation that the density of inhibitory neurons in the BST and septum is correlated with TBR1 neuron number in mPFC and cortical white matter volume supports an indirect mechanism for the effects of FGF signaling, through appropriate cortical development and innervation of subcortical regions. The distinct deficit in glutamatergic terminals in the BST of mice lacking Fgfr2 also supports this hypothesis as a substantial proportion of non-GABAergic inputs to the BST arise from frontal cortex (Dong et al., 2001). Furthermore, NeuN+ cell counts confirmed that this decrease of inhibitory neurons was attributable to a loss of cells, not downregulation of immunohistochemical marker expression. Together, the data suggest that the cells themselves are likely absent because of nonsurvival contributed in part by loss of afferents. Thus, the survival of inhibitory neuron phenotypes in subcortical stations of the limbic system may require FGF signaling in the mPFC. Similar processes have been shown to be involved in olfactory pathways and intrahippocampal networks, in which appropriate cell survival and maturation depends on the normal development of afferent projections (Capurso et al., 1997; Marqués-Marí et al., 2007). These findings demonstrate the crucial role of Fgfr2 for mPFC development and, indirectly, for the development of inhibitory neurons in subcortical regions.
Our findings provide a rationale for variations in Fgf gene transcripts that have been discovered in affective disorders (Evans et al., 2004; Gaughran et al., 2006) and suggest a cellular mechanism that may be involved in psychiatric illnesses. The disproportionate decrease in PFC growth found in Fgf2 cKO mice mimic phenotypes in human structural studies of schizophrenia and bipolar disorder (Selemon et al., 1998; Hirayasu et al., 1999; Ananth et al., 2002; MacDonald and Carter, 2003). The changes within subcortical limbic structures point to the crucial role of PFC in controlling both development and function of the limbic system, which is likely to be altered in psychiatric illness (Hains and Arnsten, 2008).
Footnotes
This work was supported by National Institutes Health Grant R01 MH067715, National Alliance for Research on Schizophrenia and Depression, and National Institutes of Health Grants T32 MH018268, R25 MH071584, and R25 MH077823. We acknowledge Shawna Ellis and Rosie Deegan for laboratory and animal care assistance and Yasushi Ohkubo and Brian Rash for their intellectual contribution to this work. We also thank Yuchio Yanagawa for the GAD67-GFP (delta-neo) mice.
References
- Ananth H, Popescu I, Critchley HD, Good CD, Frackowiak RS, Dolan RJ. Cortical and subcortical gray matter abnormalities in schizophrenia determined through structural magnetic resonance imaging with optimized volumetric voxel-based morphometry. Am J Psychiatry. 2002;159:1497–1505. doi: 10.1176/appi.ajp.159.9.1497. [DOI] [PubMed] [Google Scholar]
- Bachler M, Neubüser A. Expression of members of the Fgf family and their receptors during midfacial development. Mech Dev. 2001;100:313–316. doi: 10.1016/s0925-4773(00)00518-9. [DOI] [PubMed] [Google Scholar]
- Borello U, Cobos I, Long JE, McWhirter JR, Murre C, Rubenstein JL. FGF15 promotes neurogenesis and opposes FGF8 function during neocortical development. Neural Dev. 2008;3:17. doi: 10.1186/1749-8104-3-17. [DOI] [PMC free article] [PubMed] [Google Scholar]
- Capurso SA, Calhoun ME, Sukhov RR, Mouton PR, Price DL, Koliatsos VE. Deafferentation causes apoptosis in cortical sensory neurons in the adult rat. J Neurosci. 1997;17:7372–7384. doi: 10.1523/JNEUROSCI.17-19-07372.1997. [DOI] [PMC free article] [PubMed] [Google Scholar]
- Chellaiah A, Yuan W, Chellaiah M, Ornitz DM. Mapping ligand binding domains in chimeric fibroblast growth factor receptor molecules. J Biol Chem. 1999;274:34785–34794. doi: 10.1074/jbc.274.49.34785. [DOI] [PubMed] [Google Scholar]
- Cholfin JA, Rubenstein JL. Patterning of frontal cortex subdivisions by Fgf17. Proc Natl Acad Sci U S A. 2007;104:7652–7657. doi: 10.1073/pnas.0702225104. [DOI] [PMC free article] [PubMed] [Google Scholar]
- Crossley PH, Martinez S, Ohkubo Y, Rubenstein JL. Coordinate expression of Fgf8, Otx2, Bmp4, and Shh in the rostral prosencephalon during development of the telencephalic and optic vesicles. Neuroscience. 2001;108:183–206. doi: 10.1016/s0306-4522(01)00411-0. [DOI] [PubMed] [Google Scholar]
- Dong HW, Petrovich GD, Swanson LW. Topography of projections from amygdala to bed nuclei of the stria terminalis. Brain Res Brain Res Rev. 2001;38:192–246. doi: 10.1016/s0165-0173(01)00079-0. [DOI] [PubMed] [Google Scholar]
- Englund C, Fink A, Lau C, Pham D, Daza RA, Bulfone A, Kowalczyk T, Hevner RF. Pax6, Tbr2, and Tbr1 are expressed sequentially by radial glia, intermediate progenitor cells, and postmitotic neurons in developing neocortex. J Neurosci. 2005;25:247–251. doi: 10.1523/JNEUROSCI.2899-04.2005. [DOI] [PMC free article] [PubMed] [Google Scholar]
- Evans SJ, Choudary PV, Neal CR, Li JZ, Vawter MP, Tomita H, Lopez JF, Thompson RC, Meng F, Stead JD, Walsh DM, Myers RM, Bunney WE, Watson SJ, Jones EG, Akil H. Dysregulation of the fibroblast growth factor system in major depression. Proc Natl Acad Sci U S A. 2004;101:15506–15511. doi: 10.1073/pnas.0406788101. [DOI] [PMC free article] [PubMed] [Google Scholar]
- Ever L, Zhao RJ, Eswarakumar VP, Gaiano N. Fibroblast growth factor receptor 2 plays an essential role in telencephalic progenitors. Dev Neurosci. 2008;30:306–318. doi: 10.1159/000112521. [DOI] [PubMed] [Google Scholar]
- Fukuchi-Shimogori T, Grove EA. Neocortex patterning by the secreted signaling molecule FGF8. Science. 2001;294:1071–1074. doi: 10.1126/science.1064252. [DOI] [PubMed] [Google Scholar]
- Gal JS, Morozov YM, Ayoub AE, Chatterjee M, Rakic P, Haydar TF. Molecular and morphological heterogeneity of neural precursors in the mouse neocortical proliferative zones. J Neurosci. 2006;26:1045–1056. doi: 10.1523/JNEUROSCI.4499-05.2006. [DOI] [PMC free article] [PubMed] [Google Scholar]
- Garel S, Huffman KJ, Rubenstein JL. Molecular regionalization of the neocortex is disrupted in Fgf8 hypomorphic mutants. Development. 2003;130:1903–1914. doi: 10.1242/dev.00416. [DOI] [PubMed] [Google Scholar]
- Gaughran F, Payne J, Sedgwick PM, Cotter D, Berry M. Hippocampal FGF-2 and FGFR1 mRNA expression in major depression, schizophrenia and bipolar disorder. Brain Res Bull. 2006;70:221–227. doi: 10.1016/j.brainresbull.2006.04.008. [DOI] [PubMed] [Google Scholar]
- Gregg C, Weiss S. CNTF/LIF/gp130 receptor complex signaling maintains a VZ precursor differentiation gradient in the developing ventral forebrain. Development. 2005;132:565–578. doi: 10.1242/dev.01592. [DOI] [PubMed] [Google Scholar]
- Gutin G, Fernandes M, Palazzolo L, Paek H, Yu K, Ornitz DM, McConnell SK, Hébert JM. FGF signalling generates ventral telencephalic cells independently of SHH. Development. 2006;133:2937–2946. doi: 10.1242/dev.02465. [DOI] [PubMed] [Google Scholar]
- Hains AB, Arnsten AF. Molecular mechanisms of stress-induced prefrontal cortical impairment: implications for mental illness. Learn Mem. 2008;15:551–564. doi: 10.1101/lm.921708. [DOI] [PubMed] [Google Scholar]
- Hasegawa H, Ashigaki S, Takamatsu M, Suzuki-Migishima R, Ohbayashi N, Itoh N, Takada S, Tanabe Y. Laminar patterning in the developing neocortex by temporally coordinated fibroblast growth factor signaling. J Neurosci. 2004;24:8711–8719. doi: 10.1523/JNEUROSCI.3070-04.2004. [DOI] [PMC free article] [PubMed] [Google Scholar]
- Hébert JM, Lin M, Partanen J, Rossant J, McConnell SK. FGF signaling through FGFR1 is required for olfactory bulb morphogenesis. Development. 2003;130:1101–1111. doi: 10.1242/dev.00334. [DOI] [PubMed] [Google Scholar]
- Heidbreder CA, Groenewegen HJ. The medial prefrontal cortex in the rat: evidence for a dorso-ventral distinction based upon functional and anatomical characteristics. Neurosci Biobehav Rev. 2003;27:555–579. doi: 10.1016/j.neubiorev.2003.09.003. [DOI] [PubMed] [Google Scholar]
- Hevner RF, Shi L, Justice N, Hsueh Y, Sheng M, Smiga S, Bulfone A, Goffinet AM, Campagnoni AT, Rubenstein JL. Tbr1 regulates differentiation of the preplate and layer 6. Neuron. 2001;29:353–366. doi: 10.1016/s0896-6273(01)00211-2. [DOI] [PubMed] [Google Scholar]
- Hirayasu Y, Shenton ME, Salisbury DF, Kwon JS, Wible CG, Fischer IA, Yurgelun-Todd D, Zarate C, Kikinis R, Jolesz FA, McCarley RW. Subgenual cingulate cortex volume in first-episode psychosis. Am J Psychiatry. 1999;156:1091–1093. doi: 10.1176/ajp.156.7.1091. [DOI] [PMC free article] [PubMed] [Google Scholar]
- Hoch RV, Rubenstein JL, Pleasure S. Genes and signaling events that establish regional patterning of the mammalian forebrain. Semin Cell Dev Biol. 2009;20:378–386. doi: 10.1016/j.semcdb.2009.02.005. [DOI] [PubMed] [Google Scholar]
- Kaga Y, Shoemaker WJ, Furusho M, Bryant M, Rosenbluth J, Pfeiffer SE, Oh L, Rasband M, Lappe-Siefke C, Yu K, Ornitz DM, Nave KA, Bansal R. Mice with conditional inactivation of fibroblast growth factor receptor-2 signaling in oligodendrocytes have normal myelin but display dramatic hyperactivity when combined with Cnp1 inactivation. J Neurosci. 2006;26:12339–12350. doi: 10.1523/JNEUROSCI.3573-06.2006. [DOI] [PMC free article] [PubMed] [Google Scholar]
- Kang W, Wong LC, Shi SH, Hébert JM. The transition from radial glial to intermediate progenitor cell is inhibited by FGF signaling during corticogenesis. J Neurosci. 2009;29:14571–14580. doi: 10.1523/JNEUROSCI.3844-09.2009. [DOI] [PMC free article] [PubMed] [Google Scholar]
- Korada S, Zheng W, Basilico C, Schwartz ML, Vaccarino FM. Fibroblast growth factor 2 is necessary for the growth of glutamate projection neurons in the anterior neocortex. J Neurosci. 2002;22:863–875. doi: 10.1523/JNEUROSCI.22-03-00863.2002. [DOI] [PMC free article] [PubMed] [Google Scholar]
- Kowalczyk T, Pontious A, Englund C, Daza RA, Bedogni F, Hodge R, Attardo A, Bell C, Huttner WB, Hevner RF. Intermediate neuronal progenitors (basal progenitors) produce pyramidal-projection neurons for all layers of cerebral cortex. Cereb Cortex. 2009;19:2439–2450. doi: 10.1093/cercor/bhn260. [DOI] [PMC free article] [PubMed] [Google Scholar]
- Krettek JE, Price JL. The cortical projections of the mediodorsal nucleus and adjacent thalamic nuclei in the rat. J Comp Neurol. 1977;171:157–191. doi: 10.1002/cne.901710204. [DOI] [PubMed] [Google Scholar]
- MacArthur CA, Lawshé A, Xu J, Santos-Ocampo S, Heikinheimo M, Chellaiah AT, Ornitz DM. FGF-8 isoforms activate receptor splice firms that are expressed in mesenchymal regions during development. Development. 1995;121:3603–3613. doi: 10.1242/dev.121.11.3603. [DOI] [PubMed] [Google Scholar]
- MacDonald AW, 3rd, Carter CS. Event-related FMRI study of context processing in dorsolateral prefrontal cortex of patients with schizophrenia. J Abnorm Psychol. 2003;112:689–697. doi: 10.1037/0021-843X.112.4.689. [DOI] [PubMed] [Google Scholar]
- Marqués-Marí AI, Nacher J, Crespo C, Gutièrrez-Mecinas M, Martínez-Guijarro FJ, Blasco-Ibáñez JM. Loss of input from the mossy cells blocks maturation of newly generated granule cells. Hippocampus. 2007;17:510–524. doi: 10.1002/hipo.20290. [DOI] [PubMed] [Google Scholar]
- Martínez-Cerdeño V, Noctor SC, Kriegstein AR. The role of intermediate progenitor cells in the evolutionary expansion of the cerebral cortex. Cereb Cortex. 2006;16(Suppl 1):i152–i161. doi: 10.1093/cercor/bhk017. [DOI] [PubMed] [Google Scholar]
- Maruoka Y, Ohbayashi N, Hoshikawa M, Itoh N, Hogan BL, Furuta Y. Comparison of the expression of three highly related genes, Fgf8, Fgf17 and Fgf18, in the mouse embryo. Mech Dev. 1998;74:175–177. doi: 10.1016/s0925-4773(98)00061-6. [DOI] [PubMed] [Google Scholar]
- Miyata T, Kawaguchi A, Okano H, Ogawa M. Asymmetric inheritance of radial glial fibers by cortical neurons. Neuron. 2001;31:727–741. doi: 10.1016/s0896-6273(01)00420-2. [DOI] [PubMed] [Google Scholar]
- Muzio L, DiBenedetto B, Stoykova A, Boncinelli E, Gruss P, Mallamaci A. Emx2 and Pax6 control regionalization of the pre-neuronogenic cortical primordium. Cereb Cortex. 2002;12:129–139. doi: 10.1093/cercor/12.2.129. [DOI] [PubMed] [Google Scholar]
- Noctor SC, Flint AC, Weissman TA, Dammerman RS, Kriegstein AR. Neurons derived from radial glial cells establish radial units in neocortex. Nature. 2001;409:714–720. doi: 10.1038/35055553. [DOI] [PubMed] [Google Scholar]
- Noctor SC, Martínez-Cerdeño V, Kriegstein AR. Contribution of intermediate progenitor cells to cortical histogenesis. Arch Neurol. 2007;64:639–642. doi: 10.1001/archneur.64.5.639. [DOI] [PubMed] [Google Scholar]
- Ohkubo Y, Uchida AO, Shin D, Partanen J, Vaccarino FM. Fibroblast growth factor receptor 1 is required for the proliferation of hippocampal progenitor cells and for hippocampal growth in mouse. J Neurosci. 2004;24:6057–6069. doi: 10.1523/JNEUROSCI.1140-04.2004. [DOI] [PMC free article] [PubMed] [Google Scholar]
- Paek H, Gutin G, Hébert JM. FGF signaling is strictly required to maintain early telencephalic precursor cell survival. Development. 2009;136:2457–2465. doi: 10.1242/dev.032656. [DOI] [PMC free article] [PubMed] [Google Scholar]
- Peterson DA. Quantitative histology using confocal microscopy: implementation of unbiased stereology procedures. Methods. 1999;18:493–507. doi: 10.1006/meth.1999.0818. [DOI] [PubMed] [Google Scholar]
- Pirvola U, Ylikoski J, Trokovic R, Hébert JM, McConnell SK, Partanen J. FGFR1 is required for the development of the auditory sensory epithelium. Neuron. 2002;35:671–680. doi: 10.1016/s0896-6273(02)00824-3. [DOI] [PubMed] [Google Scholar]
- Pontious A, Kowalczyk T, Englund C, Hevner RF. Role of intermediate progenitor cells in cerebral cortex development. Dev Neurosci. 2008;30:24–32. doi: 10.1159/000109848. [DOI] [PubMed] [Google Scholar]
- Raballo R, Rhee J, Lyn-Cook R, Leckman JF, Schwartz ML, Vaccarino FM. Basic fibroblast growth factor (Fgf2) is necessary for cell proliferation and neurogenesis in the developing cerebral cortex. J Neurosci. 2000;20:5012–5023. doi: 10.1523/JNEUROSCI.20-13-05012.2000. [DOI] [PMC free article] [PubMed] [Google Scholar]
- Selemon LD, Rajkowska G, Goldman-Rakic PS. Elevated neuronal density in prefrontal area 46 in brains from schizophrenic patients: application of a three-dimensional, stereologic counting method. J Comp Neurol. 1998;392:402–412. [PubMed] [Google Scholar]
- Sessa A, Mao CA, Hadjantonakis AK, Klein WH, Broccoli V. Tbr2 directs conversion of radial glia into basal precursors and guides neuronal amplification by indirect neurogenesis in the developing neocortex. Neuron. 2008;60:56–69. doi: 10.1016/j.neuron.2008.09.028. [DOI] [PMC free article] [PubMed] [Google Scholar]
- Shin DM, Korada S, Raballo R, Shashikant CS, Simeone A, Taylor JR, Vaccarino F. Loss of glutamatergic pyramidal neurons in frontal and temporal cortex resulting from attenuation of FGFR1 signaling is associated with spontaneous hyperactivity in mice. J Neurosci. 2004;24:2247–2258. doi: 10.1523/JNEUROSCI.5285-03.2004. [DOI] [PMC free article] [PubMed] [Google Scholar]
- Smith KM, Ohkubo Y, Maragnoli ME, Rasin MR, Schwartz ML, Sestan N, Vaccarino FM. Midline radial glia translocation and corpus callosum formation require FGF signaling. Nat Neurosci. 2006;9:787–797. doi: 10.1038/nn1705. [DOI] [PubMed] [Google Scholar]
- Storm EE, Garel S, Borello U, Hébert JM, Martinez S, McConnell SK, Martin GR, Rubenstein JL. Dose-dependent functions of Fgf8 in regulating telencephalic patterning centers. Development. 2006;133:1831–1844. doi: 10.1242/dev.02324. [DOI] [PubMed] [Google Scholar]
- Tamamaki N, Yanagawa Y, Tomioka R, Miyazaki J, Obata K, Kaneko T. Green fluorescent protein expression and colocalization with calretinin, parvalbumin, and somatostatin in the GAD67-GFP knock-in mouse. J Comp Neurol. 2003;467:60–79. doi: 10.1002/cne.10905. [DOI] [PubMed] [Google Scholar]
- Thomson RE, Kind PC, Graham NA, Etherson ML, Kennedy J, Fernandes AC, Marques CS, Hevner RF, Iwata T. Fgf receptor 3 activation promotes selective growth and expansion of occipitotemporal cortex. Neural Dev. 2009;4:4. doi: 10.1186/1749-8104-4-4. [DOI] [PMC free article] [PubMed] [Google Scholar]
- Vaccarino FM. Stem cell diversity in the developing CNS. Neuroscientist. 2000;6:338–352. [Google Scholar]
- Vaccarino FM, Schwartz ML, Raballo R, Nilsen J, Rhee J, Zhou M, Doetschman T, Coffin JD, Wyland JJ, Hung YT. Changes in cerebral cortex size are governed by fibroblast growth factor during embryogenesis. Nat Neurosci. 1999;2:246–253. doi: 10.1038/6350. [DOI] [PubMed] [Google Scholar]
- Vaccarino FM, Ganat Y, Zhang Y, Zheng W. Stem cells in neurodevelopment and plasticity. Neuropsychopharmacology. 2001;25:806–815. doi: 10.1016/S0893-133X(01)00349-9. [DOI] [PubMed] [Google Scholar]
- Xu J, Lawshe A, MacArthur CA, Ornitz DM. Genomic structure, mapping, activity and expression of fibroblast growth factor 17. Mech Dev. 1999;83:165–178. doi: 10.1016/s0925-4773(99)00034-9. [DOI] [PubMed] [Google Scholar]
- Yoon K, Nery S, Rutlin ML, Radtke F, Fishell G, Gaiano N. Fibroblast growth factor receptor signaling promotes radial glial identity and interacts with Notch1 signaling in telencephalic progenitors. J Neurosci. 2004;24:9497–9506. doi: 10.1523/JNEUROSCI.0993-04.2004. [DOI] [PMC free article] [PubMed] [Google Scholar]
- Yu K, Xu J, Liu Z, Sosic D, Shao J, Olson EN, Towler DA, Ornitz DM. Conditional inactivation of FGF receptor 2 reveals an essential role for FGF signaling in the regulation of osteoblast function and bone growth. Development. 2003;130:3063–3074. doi: 10.1242/dev.00491. [DOI] [PubMed] [Google Scholar]
- Zheng W, Nowakowski RS, Vaccarino FM. Fibroblast growth factor 2 is required for maintaining the neural stem cell pool in the mouse brain subventricular zone. Dev Neurosci. 2004;26:181–196. doi: 10.1159/000082136. [DOI] [PubMed] [Google Scholar]
- Zhuo L, Theis M, Alvarez-Maya I, Brenner M, Willecke K, Messing A. hGFAP-cre transgenic mice for manipulation of glial and neuronal function in vivo. Genesis. 2001;31:85–94. doi: 10.1002/gene.10008. [DOI] [PubMed] [Google Scholar]