

Abstract
This study demonstrates that collagen, the most abundant protein in animals, exists as a distribution of nanoscale morphologies in teeth, bones, and tendons. This fundamental characteristic of Type I collagen has not previously been reported and provides a new understanding of the nanoscale architecture of this ubiquitous and important biological nanomaterial. Dentin, bone and tendon tissue samples were chosen for their differences in cellular origin and function, as well as to compare mineralized tissues with a tissue which lacks mineral in a normal physiological setting. A distribution of morphologies was present in all three tissues, confirming that this characteristic is fundamental to Type I collagen regardless of the presence of mineral, cellular origin of the collagen (osteoblast versus odontoblast versus fibroblast), anatomical location or mechanical function of the tissue.
Introduction
The collagens are the most abundant structural proteins in animals.1 In humans, there are currently 28 proteins known as collagens2 serving a variety of structural roles including shaping and organizing extracellular matrices (ECM), providing a scaffolding for tissue formation, cell adhesion and migration, as well serving as the principal source of tensile strength in animal tissues.3 The hallmark characteristic of collagen is a macromolecule composed of trimeric polypeptide chains, each comprised of regions including a repeating Gly-X-Y triplet (X and Y are often proline and hydroxyproline, respectively). One major classification of collagen is the fibrillar-forming type which have an approximately 300 nm long, uninterrupted triple helix (with the exceptions of Type XXIV and XXVII).2
Type I collagen is archetypal in that it is trimeric, possesses an uninterrupted Gly-X-Y triple helix and assembles into structural fibrils.2 With the exception of cartilaginous tissues,1 Type I collagen is found throughout the body in tissues such as teeth, bones, tendons, skin, arterial walls and the cornea.3 Type I collagen is also synthesized in response to injury and is present in scar tissue. Based on the seminal work of Hodge and Petruska in 1963 (and earlier work by many others), the primary morphological characteristic of Type I collagen fibrils, the D-periodic axial gap/overlap spacing, was shown to be 67 nm based on theoretical models of a single collagen fibril in isolation.4 In the 46 years since this assertion, x-ray diffraction5 and electron microscopy6, 7 studies have supported this singular spacing value within the error of the individual technique. Given the complexity of the collagen fibril itself, the range of tissues in which these fibrils are incorporated and the potential for morphology variation with disease, it seems unlikely that a single spacing value would exist for all fibrils. A recent study using atomic force microscopy (AFM) noted a distribution of fibril spacing values in dentin, but did not statistically analyze the distribution or discuss its biological or mechanical significance.8
Measuring and understanding morphological features of the ultrastructure of collagen in collagen-based tissues is imperative to our understanding of normal tissue architecture. The need for accurate quantitative analytical methods to assess collagen's nanoscale morphology with as little disruption to the tissue as possible has prompted us to study the collagen ultrastructure of various tissues using AFM. As opposed to other methods which are used to image the Type I collagen ultrastructure of tissues, samples imaged using AFM remain intact to a greater degree, increasing confidence that measured properties are sample characteristics rather than artifacts of processing or imaging.9 Although AFM has been used by other groups to image the collagen matrix in mineralized dentin8 and bone10-13, and other non-mineralized tissues14-16, the current study uses a quantitative and statistically powered technique to analyze the nanoscale morphology of individual Type I collagen fibrils in multiple tissues from the same animal.
In the current study, it was hypothesized that AFM could be used to image and quantitatively analyze the morphology of Type I collagen fibrils in fully intact and mineralized teeth and bones as well as in non-mineralized tendons to learn more about the normal nanoscale properties of these materials. These three tissues were chosen based on their differences in cellular origin and function. Further, since tendons lack mineral under normal physiological conditions, tendon samples served as an internal control to verify that the demineralization process used on bone and dentin samples did not disrupt the native collagen structure of these tissues within the detection limits of the AFM methodology.
Materials and Methods
Animals
Eight week old male mice from the mixed Sv129/CD-1/C57BL/6S background strain were used with prior approval (University of Michigan, UCUCA protocol #09637). After sacrifice by CO2 inhalation, femora, mandibular incisors and tails were harvested, wrapped in gauze soaked with calcium-buffered saline and stored at -20°C.
Atomic Force Microscopy (AFM) imaging and analysis
Before use, the proximal (above the third trochanter) and distal ends of each left femur were removed using a low-speed sectioning saw (South Bay Technology, Model 650; San Clemente, CA) with a diamond wafering blade (Mager Scientific) leaving approximately 7 mm of compact bone of the diaphysis (Figure 1). The marrow cavity of each bone was cleaned using a small tube brush.
Figure 1. Schematic Representation of the Processed Mouse Femur.
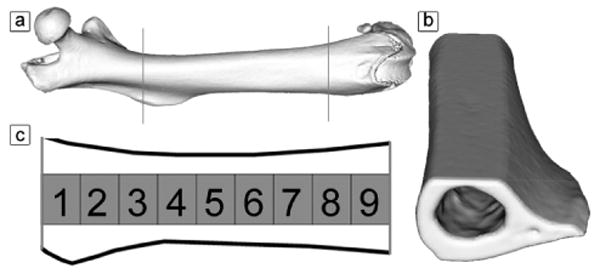
Panel a shows a 3D image of a mouse femur, with the anterior surface of the femur facing the reader (proximal end left, distal end right). The femur was polished to create a flat intracortical region to image (panel b). Along the length of the femur, 9 locations were analyzed to investigate the collagen fibril ultrastructure (panel c).
Mandibular incisors were cleaned of soft tissue and surrounding bone. Bones (anterior side facing up) and teeth (lateral side facing up) were mounted to a steel disk using a thin layer of cyanoacrylate glue. A flat polished surface was created using a 3 μm polycrystalline water-based diamond suspension and a 0.05 μm deagglomerated alumina suspension (Buehler LTD; Lake Bluff, Il). This polishing exposed intracortical bone in the bone samples and dentin in the teeth samples. The bones and teeth were sonicated for 15 seconds to remove polishing residue and debris. To remove extrafibrillar surface mineral and expose underlying collagen fibrils, each bone and tooth was demineralized using 0.5M EDTA at a pH of 8.0 for up to 15 minutes, then vigorously rinsed with ultrapure water and soaked at 4°C for at least 16 hours 17. EDTA is often used in mineralized tissue research to remove mineral while keeping collagen and cells intact and viable 18, 19. This demineralization technique is slower than other treatments and allowed us to maintain the integrity of the native collagen structure along with the intrafibrillar mineral 20. Before imaging, each sample was briefly sonicated to remove any mineral that was still bound to the surface.
To isolate tendons from each tail, the tip of the tail was removed using a scalpel. The skin was peeled back at the base of the tail and removed in a base-to-tip direction, exposing the underlying tendons. Tendons were removed whole, minced using a scalpel and scissors, then homogenized in 1-2 mL of ultrapure water to disrupt the fascicle structure and release collagen fibrils. Fibril-containing solutions were deposited onto freshly-cleaved mica surfaces and allowed to dry at room temperature.
Samples were imaged in air using a PicoPlus 5500 AFM (Agilent). Dentin and bone were imaged in tapping mode using silicon cantilevers (VistaProbes T300R, tip radius < 10 nm, force constant 40 N/m, resonance frequency 300 kHz; nanoScience Instruments; Phoenix, AZ). Tendon fibrils were imaged in contact mode using silicon nitride cantilevers (Veeco DNP, tip radius ∼20 nm, force constant 0.58 N/m). Images were acquired from 3 locations in each of 5 teeth, 9 locations in each of 4 bones (designated 1-9 beginning at the proximal end of the sample, Figure 1), and several locations in each of 4 tendon samples. At each location, 3.5 μm × 3.5 μm amplitude or deflection images were analyzed to investigate the D-periodic spacing. In teeth, 15-20 fibrils were analyzed in each location. In bones, 5-10 fibrils were analyzed in each location (with the exception of 1 bone which lost locations 8 and 9 during polishing). In each tendon sample, 35-50 fibrils were analyzed. Representative images and line scans from each tissue type are shown in Figure 2.
Figure 2. Representative Line Scans From Each Tissue.
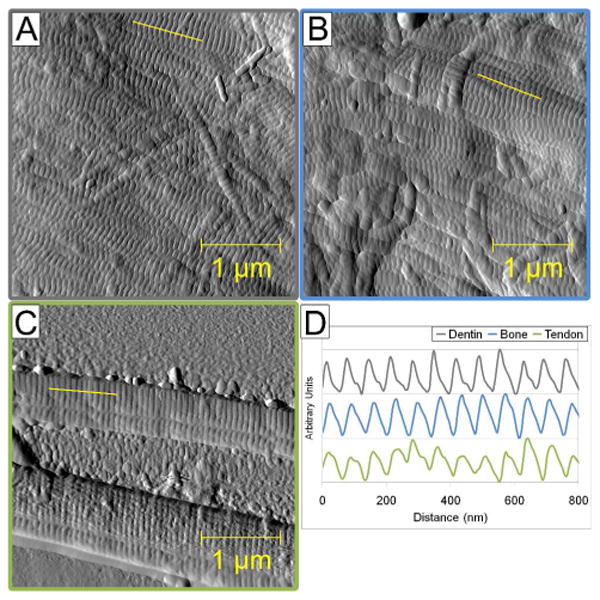
This figure shows representative 3.5 μm × 3.5 μm amplitude images from dentin (A) and bone (B), and a deflection image from tendon (C). The yellow line in each panel is where a representative line scan was performed (as shown in panel D). The line scans in panel D are shown on a normalized height scale for comparison purposes.
Image Analysis
Following image capture, a rectangular region of interest (ROI) was chosen along straight segments of individual fibrils (Figure 3a; SPIP v4.8.2, Image Metrology; Hørsholm, Denmark, Figure 2). The ROI was drawn to ensure that it started and ended at the edge of a gap zone, which minimizes edge effects that can degrade resolution. For each evaluated fibril, a two dimensional Fast Fourier Transform (2D FFT) was performed and the primary peak from the 2D power spectrum was used to determine the value of the D-periodic gap/overlap spacing (Figure 3b). This process decouples the measured D-Period repeat distance from both pixel size and fibril orientation. In total, 291 dentin fibrils, 288 bone fibrils and 160 tendon fibrils were analyzed.
Figure 3. Schematic Representation of Two Dimensional Fast Fourier Transform Measurements.
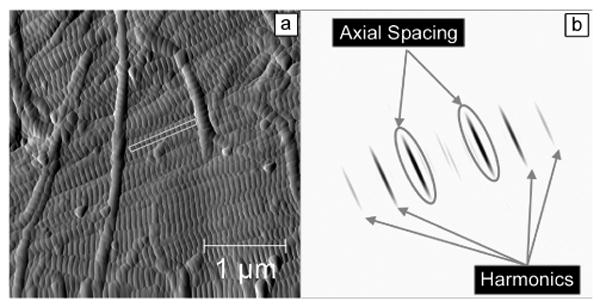
Panel a shows a representative 3.5 μm × 3.5 μm amplitude image from a bone sample that was used to measure the collagen fibril D-periodicity. The box represents a fibril that was chosen for measurement. Panel b shows the corresponding 2D FFT from this fibril. As indicated, the 2D power spectrum contains information about the harmonic characteristics of the fibril. The circled peaks are the first harmonic of the spectrum. The maximum value in this peak corresponds to the D-Periodic repeat distance of the fibril.
Making absolute x-y distance measurements with AFM has multiple limitations. Prior to sampling, calibration of the system was performed according manufacturer guidelines. A calibration grating with a 10 μm period was imaged with the scan size set just under the range of the piezo (80 μm scan size) at 512 pixels by 512 pixels. This results in a pixel size of roughly 160 nm. To overcome limitations imposed by pixel size, multiple consecutive periods were measured. The measured period was defined as the total measured length divided by the number of periods. The calibration was adjusted until the measured period was within 25 nm of the actual 10 μm period. This calibration method results in a maximum error of 0.25%, which is less than the 1% tolerance specified by the manufacturer. For the imaging of collagen fibrils, scan sizes were reduced to 3.5 μm at 512 × 512 pixels. Because of the effective linearity of the piezo, error scales with the reduction of scan size reducing the 25 nm tolerance to 1.1 nm.
Statistical Analysis
All statistical analyses utilized SPSS (Version 16.0, SPSS Inc.). For all investigations, a value of p<0.05 was considered significant. To investigate differences in fibril morphology as a function of tissue type, D-periodic axial spacing values measured from an individual sample were pooled, yielding an average value for that sample. The values from dentin (n=5), bone (n=4) and tendon (n=4) were then compared by One Way ANOVA with post-hoc Bonferroni tests.
To examine differences in the distribution of fibril morphology between tissue types, histograms and the Cumulative Distribution Function (CDF) of each group were computed. The CDF shows what fraction of a given sample is contained up to a particular value, easily demonstrating differences between distributions in both mean and standard deviation. In Figure 5b, Cumulative Total (%) is used on the y-axis to make it clear that the CDF is a percentage within each group up to each spacing value. To test for statistical significance between distributions, Kolmogorov-Smirnov (K-S) tests were then applied to the data. This test is sensitive to changes in both the mean value and standard deviation of a distribution.
Figure 5. D-Periodic Gap/Overlap Spacings from Murine Tissues.
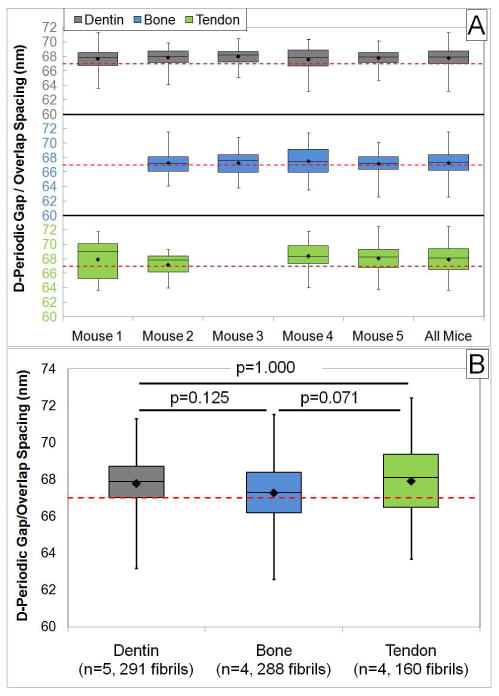
Panel A shows the boxplot representation from each sample in each tissue. The rightmost boxplot for each tissue in panel A is the boxplot for all measured fibrils within the tissue type. This boxplot is repeated in panel B. When the groups were compared by One Way ANOVA with post hoc Bonferroni tests, there were no significant differences between any of the groups (p-values indicated for each comparison).
Results and Discussion
The D-periodic axial gap/overlap spacing was chosen as the key metric of fibril morphology. This measure captures aspects of fibril structure which may be related to the state of the individual molecular triple helices, post-translational modifications and cross-linking. The most commonly accepted value for the D-periodic spacing of Type I collagen is 67 nm (as predicted by Hodge and Petruska),4 but this value is based on a theoretical model of a single collagen fibril in isolation. The molecular origin of this morphological feature has not been completely elucidated. A recent study performed AFM and TEM analyses on identical collagen fibrils.6 The paper suggested that the taller protrusions seen on the surface of collagen fibrils using AFM register perfectly with the dark bands seen in TEM, suggesting that there is more material in these bumps and that this material is better at scattering electrons. As mentioned by the authors, this observation does not rule out the existence of gap zones as proposed by Hodge and Petruska. Regardless of the origin of the D-periodic spacing, this morphological feature is well resolved with AFM and easy to quantify.
To quantitatively assess the D-periodic spacing in Type I collagen-based tissues as a function of tissue type, mandibular incisors, femora and tails were harvested from 8 week old male mice. The use of a specific age, gender and background strain of mouse guarantees that the known influence of these properties on skeletal structure and function were avoided.
Along the length of each bone, measurements were made at 9 axial locations (Figure 1). By pooling data from the 4 bones at each of the 9 location and analyzing the D-periodic spacing, it was confirmed that there were no systemic changes in Type I collagen morphology as a function of axial location in the bone (Figure 4). The boxes represent the middle 50% of the data and the whiskers depict the data extremes. The diamond is the mean and the line within the box is the median of each group. The dashed horizontal line is for reference and corresponds to the 67 nm axial spacing that is predicted by the Hodge-Petruska model.4 This type of data presentation is only possible for the bone samples. Dentin samples were measured from 3 locations in each tooth. However, because of differences in tooth geometry, these locations were not identical from tooth to tooth. Further, the tendon samples were adsorbed on mica so anatomical location is not applicable.
Figure 4. D-Periodic Spacing as a Function of Axial Location in Bones.
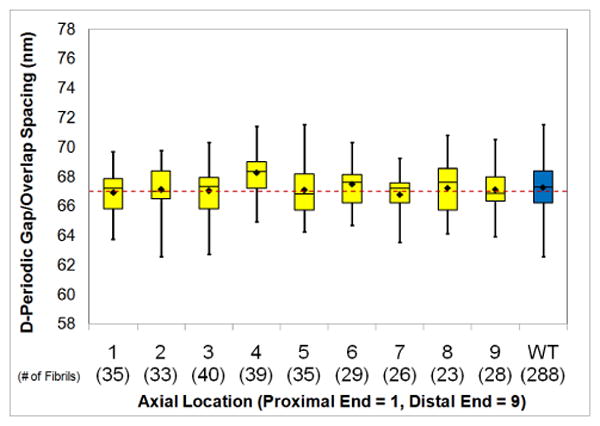
This figure shows the boxplot representation of the D-periodic spacing as a function of axial location in the bone samples. Data from the four bones were pooled at each location. This figure confirms that there were no systematic changes in collagen morphology as a function of location in the bone.
Measurements within each tooth, bone and tail sample were pooled to yield the mean fibril spacing for that sample. Tooth (n=5), bone (n=4) and tendon samples (n=4) were then compared; the overall mean values within each tissue type were 67.8 nm, 67.3 nm and 67.9 nm for dentin, bone and tendon, respectively (Figure 5). Based on a system calibration, the ability to measure absolute distances has an error of approximately 1.1 nm. Therefore, it is not possible to state that the measured means in this study are different from the 67 nm value predicted by Hodge and Petruska. When the mean values in each group were compared by One Way ANOVA with post-hoc Bonferroni tests, no differences were present between any of the groups (Figure 5B; a p-value of <0.05 was considered significant).
Figure 6 shows that a distribution of fibril morphologies existed in each group. The concept of a distribution is often overlooked in measurements of collagen, and the mean value for the D-periodic spacing is reported without explanation.21, 22 In fact, this fundamental characteristic of Type I collagen was not discussed in a thorough recent book that presents a detailed review of collagen structure and mechanics.23 The main population of fibrils in each group was selected such that the bins contained the mean of the bone fibrils ± 1 standard deviation (66 nm to 69 nm, Figure 5a). Within this range, 75% of bone fibrils were found in comparison to 85% for dentin and 60% for tendon fibrils. As a second method to visualize the distributions, the Cumulative Distribution Function (CDF) was computed from the measurements in each group (Figure 5b). To test for statistical significance between distributions, Kolmogorov-Smirnov (K-S) tests were applied to the data. This test is sensitive to changes in both the mean value and standard deviation of a distribution. The distributions from the three tissue types were statistically distinguishable from one another (Figure 4b: Dentin vs. Bone, p<0.001; Dentin vs. Tendon, p=0.004; Bone vs. Tendon; p<0.001). Despite these differences, the presence of a distribution was a common feature in all three tissues, indicating that a distribution of fibril morphologies is a defining nanoscale characteristic of Type I collagen.
Figure 6. Histogram and Cumulative Density Function of D-Periodic Spacings from Murine Tissues.
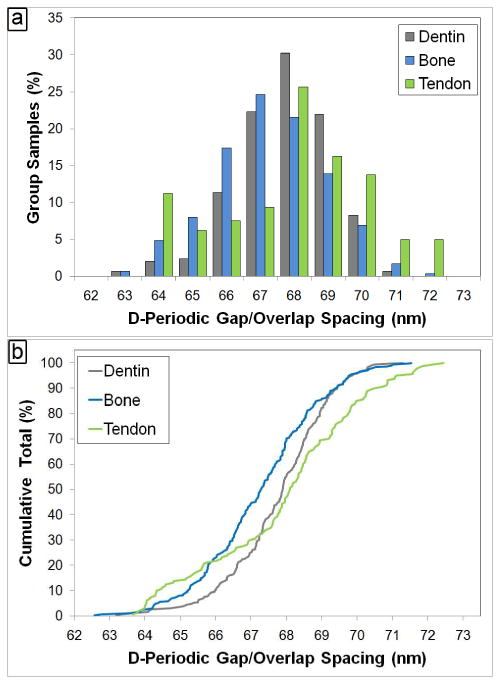
Panel a shows the histogram representation of the D-Periodic gap/overlap spacing from dentin, bone and tendon samples (1 nm bin size). Panel b displays the Cumulative Density Function (CDF) calculated from each group. The CDF shows what fraction of a given sample is contained up to a particular value. A Kolmogorov-Smirnov test performed on the data indicates that there are significant differences in the population distributions between all the three groups.
The presence of a distribution in fibrils is interesting and important, as this distribution may hold the key to understanding important aspects of the ultrastructure of many collagen-based tissues. Explaining the reasons behind the presence of a distribution in fibril morphologies is not trivial. Because of the structural hierarchy of collagen fibrils,1 a distribution in the D-periodic spacing near the ideal value predicted by Hodge and Petruska is most likely driven by alterations in the end-to end spacing of collagen molecules within the fibril, or by a change in the tightness of the twist of the fibril.24, 25 Either of these mechanisms could cause the measured D-period spacing at the fibrillar-level to change. Another possibility is the presence of proteins both within and on the surface of collagen fibrils which may lead to changes in the observed spacings.26, 27 Another potential source of variation is the presence of intramolecular and intermolecular crosslinks which could not only add heterogeneity to the structure, but could also allow the spacing to further change as the crosslinks mature.28
One drawback when working with mineralized tissues like bone and dentin is that in order to analyze the organic component by AFM, some portion of the inorganic mineral must be removed to expose the underlying structure. Regardless of the method used, there is the possibility that this treatment could have important effects on the properties that one hopes to measure. Many methods are used in the literature to remove this mineral for imaging studies such as AFM. A majority of studies use some form of acid which etches mineral from the surface to expose collagen. 12,20,21,29,30 In our hands, these methods worked rapidly and often completely destroyed the surface (e.g. crater-like hole would appear on the surface with 1-2 minutes but no defined collagen fibrils were visible). In contrast to these acid treatments, EDTA is a chelating agent which is slow at removing calcium from bone 31 and is close to physiological pH. With long term treatment (days to weeks), EDTA can fully demineralize bone and dentin. 32-36 In fact, EDTA is often used to remove mineral and liberate trapped osteocytes for cell culture experiments.19 In the current study, every effort was made to treat the samples for as little time as possible to expose the underlying collagen fibrils.
It is important to keep in mind that although reports vary, roughly 1/3 of the mineral present in the extracellular matrix (ECM) of mineralized tissues is intrafibrillar (i.e. present within the collagen fibrils themselves).37 This fact suggests that short periods of EDTA treatment are likely to preferentially remove extrafibrillar mineral first, leaving behind the intrafibrillar mineral which helps to stabilize the structure of the ECM. Two recent AFM studies directly assess the effects of Citric Acid 20 or EDTA 12 on mineralized collagen fibrils. The first paper follows the effects of citric acid over time and found that intrafibrillar mineral is protected from demineralization, even after 30 minutes of continuous treatment. The second study showed that treatment with both NaF and EDTA removed extrafibrillar mineral while leaving the underlying collagen structure intact. In the current study, non-mineralized tendon samples served as an internal control to verify that the demineralization process used on bone and dentin samples did not alter collagen structure within the ability of our AFM technique to detect changes in morphology. The comparison of tendon to bone and dentin also verified that the presence of mineral is not the source of the observed distributions in bone and dentin.
The tissues analyzed in the current study serve a variety of mechanical roles. Dentin is less mineralized and less brittle than the enamel that covers it and primarily supports compressive loads from mastication (dentin in the mouse mandibular incisor may also be subject to tensile loads given its shape). Tendons provide a link between bones and muscles and are subject to tensile loading. Bone is a heterogeneous tissue and depending on location, bone can be subjected to a highly complex loading state including tension, compression and torsion. Despite these differences in mechanical need, all three tissues displayed a similar distribution of collagen fibril morphologies. The influences that such a distribution may have on the mechanical integrity of a tissue are unknown. However, it is possible that as the spacing in a fibril gets shorter, less space is available in the fibril for the presence of water or mature crosslinks. This could detrimentally impact the viscoelastic and post-yield properties of the tissue 23, while possibly leading to a stiffer fibril. The impacts that such changes have on the structural-level properties of a tissue are difficult to understand given the hierarchical complexity of collagen-containing tissues. Therefore, the links between morphology and mechanics will require further investigation in future studies.
Given the ubiquitous nature of Type I collagen in animals,3 and the number of disease that can affect collagen-containing tissues, it seems probable that alterations in the Type I collagen ultrastructure will occur with disease. In fact, a recent publication demonstrates that for samples from normal and estrogen depleted sheep (all of which were treated and imaged in the exact same way), not only is the mean fibril spacing significantly changed, but so too is the distribution of fibril morphologies 17. The fact that disease-induced changes in the distribution of fibril morphologies was observed further indicates that the presence of a distribution is not driven by artifact. The paper further demonstrates that age-dependent diseases such as estrogen depletion-related osteoporosis, which is not correlated with genetic alteration, can lead to collagen pathologies which are detectable using AFM. Therefore, monitoring this distribution may represent a new diagnostic technique for disease in a number of collagen based-tissues.
Some concern may be raised over the imaging conditions used in the current study. Studies have suggested that dehydration of collagen fibrils can change the normal d-periodic spacing of the fibrils 38. The majority of these observations were made using electron microscopy, a method that not only fully dehydrates the tissue, but also requires ultra-high vacuum. When using AFM in the current study (a method that does not require ultra-high vacuum), tissues were processed and stored wet. Just before imaging, the surface of the bones and teeth were briefly blown dry with nitrogen and imaged immediately under atmospheric pressure. The tendon samples are allowed to dry in air for around 1 hour, then imaged under the same conditions. It is likely that the sample was not fully dehydrated even after the entire sample had been imaged. Regardless, all samples in the current study were imaged under identical conditions, and only relative differences between tissue types were analyzed.
In conclusion, the current study demonstrates that regardless of cellular origin or anatomical location, normal Type I collagen-based tissues contain a distribution of nanoscale collagen morphologies as measured using the D-periodic gap/overlap spacing. The mean differences in the D-period spacing are not statistically significant; however, the differences in the distributions of the D-period spacing as a function of tissue type are statistically significant. This is a new and important observation on the nanoscale ultrastructure of the most abundant protein in animals. The presence of this distribution may hold powerful information about the ultrastructure of collagen-based tissues. Further, monitoring this distribution may represent a new diagnostic technique for disease in a number of collagen based-tissues. Future studies will be directed at correlating morphology with functional mechanical integrity at the ultrastructural-level.
Supplementary Material
Acknowledgments
The authors thank Jeff Meganck from the University of Michigan, Department of Biomedical Engineering and Orthopaedic Surgery, for providing the mice used in the current study. This work was partially supported by the National Institute of Dental and Craniofacial Research (National Institutes of Health) through a Ruth L. Kirschstein National Service Award (Grant number 1F32DE018840-01 A1).
Footnotes
Supporting Information Available: Plots of D-periodic spacing as a function of fibril angle which clearly demonstrate that the spacing distribution is not being caused by possible x versus y calibration differences of the AFM. This material is available free of charge via the Internet at http://pubs.acs.org.
Contributor Information
Joseph M. Wallace, Email: jmwallac@umich.edu.
Mark M. Banaszak Holl, Email: mbanasza@umich.edu.
References
- 1.Kadler KE, Holmes DF, Trotter JA, Chapman JA. Biochemical Journal. 1996;316:1–11. doi: 10.1042/bj3160001. [DOI] [PMC free article] [PubMed] [Google Scholar]
- 2.Kadler KE, Baldock C, Bella J, Boot-Handford RP. J Cell Sci. 2007;120:1955. doi: 10.1242/jcs.03453. [DOI] [PubMed] [Google Scholar]
- 3.Canty EG, Kadler KE. J Cell Sci. 2005;118:1341–1353. doi: 10.1242/jcs.01731. [DOI] [PubMed] [Google Scholar]
- 4.Hodge AJ, Petruska JA. Recent Studies with the Electron Microscope on Ordered Aggregates of the Tropocollagen Molecule. In: Ramachandran GN, editor. Aspects of Protein Structure. Academic Press; New York: 1963. p. 289. [Google Scholar]
- 5.Bigp A, Koch M, Panzavolta S, Roverp N, Rubinp K. Connect Tissue Res. 2000;41:37–43. doi: 10.3109/03008200009005640. [DOI] [PubMed] [Google Scholar]
- 6.Lin AC, Goh MC. Proteins Structure Function and Genetics. 2002;49:378–384. doi: 10.1002/prot.10224. [DOI] [PubMed] [Google Scholar]
- 7.Chapman JA, Tzaphlidou M, Meek KM, Kadler KE. Electron Microsc Rev. 1990;3:143–182. doi: 10.1016/0892-0354(90)90018-n. [DOI] [PubMed] [Google Scholar]
- 8.Habelitz S, Balooch M, Marshall SJ, Balooch G, Marshall GW., Jr J Struct Biol. 2002;138:227–236. doi: 10.1016/s1047-8477(02)00029-1. [DOI] [PubMed] [Google Scholar]
- 9.Morris VJ, Kirby AR, Gunning AP. Atomic force microscopy for biologists. Imperial College Press; Norwich, UK: 1999. [Google Scholar]
- 10.Hassenkam T, Fantner GE, Cutroni JA, Weaver JC, Morse DE, Hansma PK. Bone. 2004;35:4–10. doi: 10.1016/j.bone.2004.02.024. [DOI] [PubMed] [Google Scholar]
- 11.Baranauskas V, Garavello-Freitas I, Jingguo Z, Cruz-Höfling MA. Journal of Vacuum Science & Technology A: Vacuum, Surfaces, and Films. 2001;19:1042. [Google Scholar]
- 12.Kindt JH, Thurner PJ, Lauer ME, Bosma BL, Schitter G, Fantner GE, Izumi M, Weaver JC, Morse DE, Hansma PK. Nanotechnology. 2007;18:135102. doi: 10.1088/0957-4484/18/13/135102. [DOI] [PubMed] [Google Scholar]
- 13.Tai K, Qi HJ, Ortiz C. J Mater Sci Mater Med. 2005;16:947–959. doi: 10.1007/s10856-005-4429-9. [DOI] [PubMed] [Google Scholar]
- 14.Jiang F, Hörber H, Howard J, Müller DJ. J Struct Biol. 2004;148:268–278. doi: 10.1016/j.jsb.2004.07.001. [DOI] [PubMed] [Google Scholar]
- 15.Cisneros DA, Hung C, Franz CM, Muller DJ. J Struct Biol. 2006;154:232–245. doi: 10.1016/j.jsb.2006.02.006. [DOI] [PubMed] [Google Scholar]
- 16.Strasser S, Zink A, Janko M, Heckl WM, Thalhammer S. Biochem Biophys Res Commun. 2007;354:27–32. doi: 10.1016/j.bbrc.2006.12.114. [DOI] [PubMed] [Google Scholar]
- 17.Wallace JM, Erickson B, Les CM, Orr BG, Banaszak Holl MM. Bone. 2009 doi: 10.1016/j.bone.2009.11.020. [DOI] [PMC free article] [PubMed] [Google Scholar]
- 18.Jonsson R, Tarkowski A, Klareskog L. J Immunol Methods. 1986;88:109–114. doi: 10.1016/0022-1759(86)90058-x. [DOI] [PubMed] [Google Scholar]
- 19.Klein-Nulend J, Burger EH, Semeins CM, Raisz LG, Pilbeam CC. J Bone Miner Res. 1997;12:45–51. doi: 10.1359/jbmr.1997.12.1.45. [DOI] [PubMed] [Google Scholar]
- 20.Balooch M, Habelitz S, Kinney JH, Marshall SJ, Marshall GW. J Struct Biol. 2008;162:404–410. doi: 10.1016/j.jsb.2008.02.010. [DOI] [PMC free article] [PubMed] [Google Scholar]
- 21.El Feninat F, Ellis TH, Sacher E, Stangel I. J Biomed Mater Res. 1998;42:549–553. doi: 10.1002/(sici)1097-4636(19981215)42:4<549::aid-jbm10>3.0.co;2-l. [DOI] [PubMed] [Google Scholar]
- 22.Revenko I, Sommer F, MINH DUCT, Garrone R, Franc JM. Biology of the Cell. 1994;80:67–69. doi: 10.1016/0248-4900(94)90019-1. [DOI] [PubMed] [Google Scholar]
- 23.Fratzl P. Collagen: Structure and Mechanics. Springer: 2008. [Google Scholar]
- 24.Israelowitz M, Rizvi SWH, Kramer J, von Schroeder HP. Protein Engineering Design and Selection. 2005;18:329–335. doi: 10.1093/protein/gzi037. [DOI] [PubMed] [Google Scholar]
- 25.Zhang W, Liao S, Cui F. Chem Mater. 2003;15:3221–3226. [Google Scholar]
- 26.Raspanti M, Congiu T, Guizzardi S. Arch Histol Cytol. 2002;65:37–43. doi: 10.1679/aohc.65.37. [DOI] [PubMed] [Google Scholar]
- 27.Raspanti M, Alessandrini A, Ottani V, Ruggeri A. J Struct Biol. 1997;119:118–122. doi: 10.1006/jsbi.1997.3865. [DOI] [PubMed] [Google Scholar]
- 28.Knott L, Bailey AJ. Bone. 1998;22:181–187. doi: 10.1016/s8756-3282(97)00279-2. [DOI] [PubMed] [Google Scholar]
- 29.Bozec L, de Groot J, Odlyha M, Nicholls B, Horton MA. In Mineralised tissues as nanomaterials: analysis by atomic force microscopy. Nanobiotechnology IEE Proceedings. 2005;152:183–186. doi: 10.1049/ip-nbt:20050004. [DOI] [PubMed] [Google Scholar]
- 30.Ge J, Cui FZ, Wang X, Wang Y. Materials Science & Engineering C. 2007;27:46–50. [Google Scholar]
- 31.Kiviranta I, Tammi M, Lappalainen R, Kuusela T, Helminen HJ. Histochem Cell Biol. 1980;68:119–127. doi: 10.1007/BF00489507. [DOI] [PubMed] [Google Scholar]
- 32.Fois M, Lamure A, Fauran MJ, Lacabanne C. J Appl Polym Sci. 2001;79:2527–2533. [Google Scholar]
- 33.Carvalho RM, Tay F, Sano H, Yoshiyama M, Pashley DH. J Adhes Dent. 2000;2:193–199. [PubMed] [Google Scholar]
- 34.Wang X, Li X, Bank RA, Agrawal CM. Calcif Tissue Int. 2002;71:186–192. doi: 10.1007/s00223-001-1082-2. [DOI] [PubMed] [Google Scholar]
- 35.Charman J, Reid L. Biotechnic & Histochemistry. 1972;47:173–178. [Google Scholar]
- 36.Tuross N, Fogel ML, Hare PE. Geochim Cosmochim Acta. 1988;52:929–935. [Google Scholar]
- 37.Pidaparti RM, Chandran A, Takano Y, Turner CH. J Biomech. 1996;29:909–916. doi: 10.1016/0021-9290(95)00147-6. [DOI] [PubMed] [Google Scholar]
- 38.Wess TJ, Orgel JP. Thermochimica Acta. 2000;365:119. [Google Scholar]
Associated Data
This section collects any data citations, data availability statements, or supplementary materials included in this article.