

Both our cross-sectional and longitudinal data showed that with-the-rule astigmatism is common among children with infantile nystagmus syndrome and increases in magnitude with age during the first 8 years of life.
Abstract
Purpose.
The purpose of this study was to examine the onset and progression of with-the-rule (WTR) astigmatism during the first 8 years of life in children with idiopathic infantile nystagmus syndrome (INS) or INS associated with albinism and to compare their development with that of normal children. Also explored was whether early WTR astigmatism influences emmetropization in children with INS and whether there is evidence of meridional emmetropization.
Methods.
Cycloplegic refractions culled from medical records were converted into power vector components: M (spherical equivalent), J0 (positive J0 indicates WTR astigmatism), and J45 (oblique astigmatism). Two diagnostic groups (idiopathic, n = 106; albinism, n = 95) were evaluated and compared with a reference normal group (n = 495). Four age subgroups were evaluated: age≤0.5 year, 0.5<age≤1 year, 1<age≤4 year, and 4<age≤8 year; in the normal group, no data were available for 4- to 8-year-olds. In addition, two longitudinal groups of children with INS (idiopathic, n = 22; albinism, n = 27) were studied.
Results.
WTR astigmatism was prevalent among children with INS, even during infancy. Both the prevalence and magnitude of WTR astigmatism increased with age in both INS groups. Predicted J0 from the fitted longitudinal data agreed with cross-sectional data. Moreover, the spherical equivalent of children with INS demonstrated little emmetropization during the first 8 years of life.
Conclusions.
Both the cross-sectional and longitudinal data showed that WTR astigmatism was common among children with INS and increased in magnitude with age during the first 8 years of life. Changes observed in meridional refractive error with age were consistent with meridional emmetropization in children with INS and WTR astigmatism.
Infantile nystagmus syndrome (INS) is a disorder of the slow eye movement system that results in involuntary oscillations of the eyes beginning in the first 6 months of life.1 The most common form of INS is idiopathic, in which there is no discernable abnormality of the sensory system. INS also can be associated with visual sensory abnormalities such as albinism, Leber's congenital amaurosis, or optic nerve hypoplasia.
With-the-rule (WTR) astigmatism has been reported frequently in school-age children and adults with INS.2–6 In normal infants, astigmatism typically decreases with age (reviewed in Refs. 7–11) and most astigmatic infant eyes have against-the-rule (ATR) astigmatism.10 It is unknown currently whether the astigmatic refractive errors in patients with INS are congenital or develop in conjunction with nystagmus.
Jethani et al.12 reported that WTR astigmatism was common in children with INS, that astigmatism developed in some children only after 4 years of age, and that the amount of astigmatism increased with age. However, this study had several limitations. First, age was grouped only as less than or more than 4 years. Refractive errors change dramatically during the first year of life in normal children (reviewed in Refs. 7, 13), so Jethani et al. may have missed important features of early refractive development in children with INS. Second, the study used a traditional description of astigmatism—cylinder power and axis—in which astigmatism is not independent from the spherical error and the axis is rounded to classify WTR and ATR astigmatism. This method does not allow for straightforward statistical comparisons between groups or as a function of age. Third, there were no longitudinal data to evaluate individual developmental changes in astigmatism.
Even a small amount of transient infantile ATR astigmatism can affect long-term emmetropization, resulting in a higher risk of development of myopia.14 Therefore, it is necessary to explore how the considerable WTR astigmatism present in the eyes of many children with INS may affect emmetropization. If one meridian is chronically in focus while the orthogonal meridian is chronically blurred, the rate of emmetropization may be different for each meridian—that is, “meridional emmetropization.” In hyperopic adults with albinism and WTR astigmatism,5,6 the vertical meridian (the less hyperopic meridian) is consistently nearer emmetropia than is the horizontal meridian (the more hyperopic meridian). Wildsoet et al.9 suggested that this finding supports meridional emmetropization in INS. However, this is necessarily the situation in a cohort of hyperopic individuals who have WTR astigmatism, based on the definitions of hyperopia and WTR astigmatism. Only data on the developmental course of meridional refractive errors can address this question adequately.
The purpose of the present study was to examine the developmental course of refractive errors, especially astigmatism, in infants and young children with idiopathic INS and INS associated with albinism. We examined whether WTR astigmatism was present during the first 6 months of life and documented the progression of astigmatic errors during infancy and early childhood in cross-sectional and longitudinal cohorts. In addition, we explored whether early WTR astigmatism influences emmetropization in children with INS and whether there is evidence of meridional emmetropization.
Methods
Participants
Refractive-error data were culled from medical records of patients enrolled in an ongoing prospective study of visual development in INS at the Retina Foundation of the Southwest. The albinism group included all patients with INS associated with albinism (n = 95) and the idiopathic group included all patients with idiopathic INS (n = 106). Each INS group was divided into four age subgroups: age≤0.5 year; 0.5<age≤1 year; 1<age≤4 year; 4<age≤8 year. Patients born preterm (≤32 weeks) and patients with developmental delay were excluded. These data were compared with raw data from a reference normal group provided to us through a data-sharing agreement—that is, the shared tabulated raw data from a recently published normative cohort13 (normal group; N = 495) chosen because of age and ethnic distribution similar to that of our patient groups. The reference normal group's data were divided into the same age subgroups, except that no 4- to 8-year-old data were available. The normal group was composed of 80% white and 20% other races. The racial distributions of the albinism, idiopathic and reference normal groups (Table 1) were similar. Table 1 shows the age distribution and the number of subjects in each group and subgroup. Informed consent was obtained from one or both parents before each infant's enrollment. This research protocol was approved by the Institutional Review Board of the UT Southwestern Medical Center and was conducted in accordance with the tenets of the Declaration of Helsinki.
Table 1.
Summary of Number and Age of Patients in Each Group
| Age Group | Albinism | Mean Age (mo) | Idiopathic | Mean Age (mo) | Normal13 | Mean Age (mo) |
|---|---|---|---|---|---|---|
| Age≤0.5 y | 29 | 3.5 ± 1.6 | 23 | 4.2 ± 1.2 | 209 | 3.2 ± 1.9 |
| 0.5<Age≤1 y | 12 | 8.9 ± 2.0 | 19 | 8.8 ± 2.0 | 84 | 10.4 ± 1.5 |
| 1<Age≤4 y | 33 | 27.6 ± 10.5 | 40 | 30.7 ± 11.5 | 202 | 30.3 ± 9.8 |
| 4<Age≤8 y | 21 | 71.6 ± 11.7 | 24 | 68.7 ± 13.5 | NA | NA |
| Total | 95 | 106 | 495 |
Diagnostic Criteria
Idiopathic INS was diagnosed when the binocular conjugate nystagmus was uniplanar and predominantly horizontal, remained horizontal in upgaze and downgaze, and was not associated with retinal, optic nerve, or central nervous system abnormalities, as determined in complete ophthalmic examinations. The ophthalmic examination included medical history, pupillary responses, ocular motility, and funduscopic examination. In a few cases, MRIs were performed to confirm the absence of optic nerve and/or central nervous system abnormalities. Albinism was diagnosed when, along with conjugate, uniplanar, horizontal nystagmus, there were findings of iris transillumination, foveal hypoplasia, and a deficit of pigmentation in the retina.
Refractive Error and Data Analysis
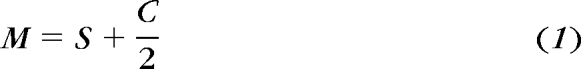
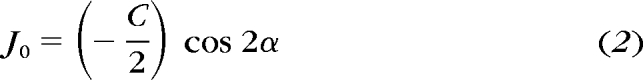
The refractive error data of patients with INS were determined with cycloplegic streak retinoscopy (with 1% cyclopentolate or, in two of the youngest infants, CycloMydril; Alcon Laboratories, Randburg, South Africa) at a working distance of 40 cm by collaborating pediatric ophthalmologists as part of routine medical care. The refractive error data of the normal group also were obtained by using cycloplegic streak retinoscopy (with 1% cyclopentolate) and a 40-cm working distance. Both the data from patients with INS and the raw normative data obtained at a separate site13 were recorded originally in conventional form as sphere (S), plus cylinder (C), and axis (α) and then were converted by using a custom spreadsheet (Excel; Microsoft, Inc., Redmond, WA) into their power vector components: M (spherical equivalent), J0 (positive J0 indicates WTR astigmatism and negative J0 indicates ATR astigmatism), and J45 (oblique astigmatism).15 The conversion equations are:
 |
 |
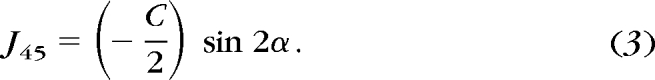 |
M, J0, and J45 are independent of each other. In interpreting the power vector description of astigmatism, it may be useful to consider that cylindrical power is defined as two times the square root of the sum of (J0)2 and (J45)2: C = 2 × . Typically, eyes have near-zero J45 (oblique astigmatism), and so 0.5 D of J0 in power vector notation corresponds to 1 D of cylinder in conventional notation.
To better understand the relationship between astigmatism and emmetropization, we applied meridional analysis. We assumed that astigmatic individuals tend to focus the meridian closer to the retina to minimize the accommodative effort required (i.e., hyperopic children accommodate to bring the less hyperopic axis into focus and myopic children accommodate to bring the more hyperopic axis into focus.) Based on this assumption, the meridian whose focus is closer to the retina is the optimal meridian, and the orthogonal one is the nonoptimal meridian. We evaluated meridional emmetropization by comparing the emmetropization of the optimal and nonoptimal meridians.
Longitudinal Data
Some of the patients with INS, in addition to the single visits included in the cross-sectional study, returned for at least two more follow-up visits separated by at least 3 months (typically by 6 months). These children were included in the longitudinal study (n = 27 in the albinism longitudinal group; n = 22 in the idiopathic longitudinal group). In both longitudinal cohorts, J0 from each individual across ages was fitted by linear regression (Matlab; The MathWorks, Natick, MA). The mean of the slope of the best-fitting lines was used to quantify the change in astigmatism as a function of age. Changes in the axis of astigmatism were also evaluated.
Statistical Analyses
Refractive error data were analyzed in power vector coordinates (Excel; Microsoft and Statistica; Statsoft, Tulsa, OK). Factorial ANOVA was used to analyze the data, with age and subject group as factors. When statistical comparisons were made between the reference normal group and the patient groups, only the three age-matched subgroups ≤4 years of age were included. The characteristics of the distributions of spherical equivalents (M) for the patient subgroups were analyzed, and the significance of kurtosis and skewness in each subgroup's distribution was determined. The relationship between refractive error and visual acuity was assessed by calculating correlation coefficients between both M and J0 and binocular visual acuity. Because we were interested in whether larger astigmatic errors are associated with poorer visual acuity, a one-tailed t-test was used to evaluate the statistical significance of the observed correlations.
Results
Cross-sectional Data
Astigmatism.
The mean and SD of power vector components for the albinism and idiopathic groups are displayed in Table 2. The mean of J45 (oblique astigmatism) was negligible (within ±0.16 D) in all subgroups. For comparison, the mean and SD of power vector components in the reference normal group is also shown in Table 2; J45 was negligible.
Table 2.
Power Vector Components (D) in the Right Eye of the Three Groups
| Group/Age Subgroup | n | M | J0 | J45 |
|---|---|---|---|---|
| Albinism | ||||
| Age≤0.5 y | 29 | 1.86 ± 1.93 | 0.33 ± 0.48 | −0.07 ± 0.31 |
| 0.5<Age≤1 y | 12 | 2.22 ± 1.96 | 0.56 ± 0.52 | −0.16 ± 0.59 |
| 1<Age≤4 y | 33 | 1.60 ± 2.92 | 0.69 ± 0.64 | −0.03 ± 0.24 |
| 4<Age≤8 y | 21 | 1.67 ± 2.98 | 1.25 ± 0.81 | 0.08 ± 0.33 |
| Idiopathic | ||||
| Age≤0.5 y | 23 | 1.39 ± 2.22 | 0.21 ± 0.59 | 0.01 ± 0.08 |
| 0.5<Age≤1 y | 19 | 1.54 ± 1.43 | 0.07 ± 0.44 | 0.00 ± 0.19 |
| 1<Age≤4 y | 40 | 1.71 ± 2.28 | 0.41 ± 0.59 | 0.04 ± 0.28 |
| 4<Age≤8 y | 24 | 1.56 ± 2.67 | 0.55 ± 0.51 | −0.06 ± 0.3 |
| Normal13 | ||||
| Age≤0.5 y | 209 | 2.13 ± 1.34 | −0.02 ± 0.39 | −0.03 ± 0.17 |
| 0.5<Age≤1 y | 84 | 1.49 ± 0.96 | −0.15 ± 0.33 | −0.02 ± 0.09 |
| 1<Age≤4 y | 202 | 1.23 ± 0.83 | −0.08 ± 0.29 | 0.00 ± 0.06 |
Data are expressed as the mean ± SD.
The positive mean J0 of the albinism group indicated significant WTR astigmatism. The amount of astigmatism increased significantly with age (F3,91 = 9.1644, P < 0.001; Fig. 1). The positive mean J0 of the idiopathic group also indicated WTR astigmatism. The mean J0 of the idiopathic group increased significantly with age (F3,102 = 3.367, P = 0.0215; Fig. 1). Comparing the two INS groups, on average, WTR astigmatism in the albinism group was significantly larger than in the idiopathic group (F1,193 = 20.779, P < 0.001). The albinism group exhibited a greater mean J0 (1.252 ± 0.806 D) than did the idiopathic group (0.547 ± 0.507 D), especially in the 4- to 8-year olds (t43 = 3.558; P < 0.001).
Figure 1.

Mean J0 component of the right eye in three groups as a function of age. Also shown for comparison is the mean J0 component derived from our power vector analysis of tabulated raw cycloplegic refraction data from the previously published reference normal group.13 Error bars, SE.
In comparison, the mean J0 of the reference normal group was small (within ±0.1 D), and, on average, in the ATR direction (mean = −0.067 ± 0.345 D) and varied slightly but significantly among age subgroups (F2,492 = 4.333; P = 0.014). The J0 component of astigmatic error in the albinism group was significantly different from the age-matched reference normal group (F1,563 = 8.987; P < 0.001). Similarly, the J0 of the idiopathic group differed significantly from that of the reference normal group (F2,571 = 4.107; P = 0.0169), particularly after 1 year of age.
Astigmatism may be considered clinically significant when the cylinder correction reaches 0.5 to 1.0 D. In this study, J0 of 0.375 D of was used as the criterion for significant astigmatism, which corresponds to a 0.75-D cylinder astigmatism in conventional notation, when J45 is negligible (see Table 2). With this criterion, WTR astigmatism (J0 ≥ 0.375 D) was prevalent among children with INS even during infancy (combining age≤0.5 year; 0.5<age≤1 year; Fig. 2). The prevalence of WTR astigmatism increased with age in both the albinism (t48 = 3.379, P < 0.001; one-tailed) and idiopathic (t45 = 2.884, P = 0.002) groups. In comparison with the reference normal group, the prevalence of WTR astigmatism in both groups of children with INS was significantly higher in all age groups (t-tests, P < 0.001), except for the idiopathic subgroup <0.5 year old (t230 =0.085, P = 0.5). The prevalence of WTR astigmatism decreased with age in the reference normal group (t409 = 3.445, P < 0.001).
Figure 2.

Prevalence of significant WTR astigmatism (J0 ≥ 0.375 D) in the albinism and idiopathic groups as a function of age. Also shown for comparison is the prevalence of significant WTR astigmatism (J0 ≥ 0.375 D) derived from our power vector analysis of tabulated raw cycloplegic refraction from the previously published reference normal group.13 Error bars, SE.
Emmetropization.
Children in the INS groups demonstrated little change in the mean value of M with age (albinism: F3,91 = 0.1952; P = 0.8994; idiopathic: F3,102 = 0.1045; P = 0.9572; Fig. 3). In the idiopathic group, only the distribution of spherical equivalent refractive error in the 4- to 8-year-old subgroup had significant kurtosis (4.13; 95% CI, 1.17–13.59). None of distributions of the spherical equivalent refractive error in the albinism subgroups had significant kurtosis.
Figure 3.

Mean M (spherical equivalent) component of the right eye in the albinism and idiopathic groups as a function of age. Also shown for comparison is the mean M component derived from our power vector analysis of tabulated raw cycloplegic refraction data from the previously published reference normal group.13 Error bars, SE.
In comparison, between the <0.5-year and the 1- to 4-year-old subgroups, the reference normal group showed evidence of emmetropization; the average value of M (spherical equivalent) decreased by 0.9 D (F2,492 = 35.7353; P < 0.001; Fig. 3), and the SD of M decreased from ±1.34 to ±0.83 D (F409 = 4.333; P = 0.014). The distributions of spherical equivalents in the normal group exhibited significant kurtosis in the 0.5 to 1 (2.26; 95% CI, 0.52–5.83) and 1- to 4-year-old subgroups (2.84; 95% CI, 1.13–5.94), but not in the <0.5-year age group (0.53; 95% CI, −0.02 to 1.42). In addition, the distributions of spherical equivalents in the 1- to 4-year-old subgroup of the reference normal group exhibited positive skew (0.77; 95% CI, 0.08–1.57; i.e., a longer tail for hyperopia than for myopia). The average M values of both INS groups were not significantly different from that in the reference normal group (albinism: F1,563 = 2.1659, P = 0.1416; idiopathic: F1,571 = 0.2193, P = 0.6397).
Meridional emmetropization was observed in the albinism and idiopathic groups. Figure 4 demonstrates that the optimal meridian in the albinism group showed more of an emmetropization trend (decreasing from 1.560 ± 0.374 D in the ≤0.5-year-old group to 0.702 ± 0.559 D in the 4- to 8-year-old group) than the nonoptimal meridian (increasing from 2.155 ± 0.377 D in the ≤0.5-year-old group to 2.63 ± 0.819 D in the 4- to 8-year-old group). The optimal meridian in the idiopathic group also showed a relatively small emmetropization trend (decreasing from 1.184 ± 0.497 D in the ≤0.5-year-old group to 1.052 ± 0.505 D in the 4- to 8-year-old group); whereas, the nonoptimal meridian showed no emmetropization trend (increasing from 1.587 ± 0.460 D in the ≤0.5-year-old group to 2.073 ± 0.611 D in the 4- to 8-year-old group). In contrast, hyperopia in the reference normal group decreased at approximately the same rate (−0.6 D/year) for the optimal and the nonoptimal meridians over 4 years.
Figure 4.

Mean spherical refractive errors in the optimal meridian (bold bar profile) and in the nonoptimal meridian (dashed line bar profile) of the right eye in the albinism and idiopathic groups as a function of age. Also shown for comparison is the reference normal group.13 Optimal, the optimal meridian; NonOptimal, the nonoptimal meridian, which is orthogonal to the optimal meridian. Error bars, SE.
Longitudinal Data
In both INS longitudinal groups, most children showed a similar developmental trend for changes in J0 with age; WTR astigmatism increased by 0.5 to 1.0 D over the next 4 to 8 years of follow-up (Fig. 5). Averaging the individual slopes, the mean J0 dioptric increase with age was similar in the albinism and idiopathic longitudinal groups: ∼0.01 D/mo or ∼0.5 D over the first 4 years of life (Table 3). Because J45 is negligible, a change in J0 of 0.5 D corresponds to a 1.0-D increase in WTR cylinder in conventional notation. In Table 4, we used the longitudinal data to predict the J0 mean (with 95% CI) in each age subgroup and compared the result to the cross-sectional data. The observed cross-sectional J0 mean agreed well with the predicted means derived from the longitudinal data.
Figure 5.

Linear fits of J0 (D) against age in months in the (left) albinism (n = 27) and (right) idiopathic (n = 22) longitudinal groups. Gray lines: results for individual subjects, fitted only to the age range within which refractive data were measured. Black line: the average, fit to the results of the albinism and idiopathic longitudinal groups, respectively.
Table 3.
Summary of Fitted Longitudinal Changes in J0
| Albinism | Idiopathic | |
|---|---|---|
| Mean slope of fitting (D/mo) | 0.010 ± 0.013 | 0.011 ± 0.020 |
| Mean intercept | 0.459 ± 0.538 | 0.068 ± 0.405 |
| Predicted J0 (D) change within 4 y | 0.48 | 0.52 |
Table 4.
J0 Predicted from Longitudinal Data Compared with Cross-sectional Data
| Group/Age | Average Age (mo) | Age SD | Predicted J0 (D) |
Cross-sectional J0 (D) | ||
|---|---|---|---|---|---|---|
| Mean J0 | Lower 95% | Upper 95% | ||||
| Albinism | ||||||
| 1–4 y | 27.6 | 10.5 | 0.735 | 0.3762 | 1.0938 | 0.69 ± 0.64 |
| 4–8 y | 71.6 | 11.7 | 1.175 | 0.2442 | 2.1058 | 1.25 ± 0.81 |
| Idiopathic | ||||||
| 1–4 y | 30.7 | 11.5 | 0.406 | −0.2083 | 1.0197 | 0.41 ± 0.59 |
| 4–8 y | 68.7 | 13.5 | 0.824 | −0.5503 | 2.1977 | 0.55 ± 0.51 |
In the Albinism longitudinal group, 30% of patients progressed from no clinically significant astigmatism (J0 < 0.375 D) to WTR astigmatism, 52% had WTR on all visits, and 15% had no significant astigmatism on any visit. Only one patient, who originally had no astigmatism, developed ATR astigmatism. In the idiopathic longitudinal group, 55% of patients progressed from no astigmatism to WTR astigmatism, 32% had WTR on all visits, and 9% had no significant astigmatism on any visit. Only one patient changed from ATR to WTR astigmatism during follow-up.
Power Vectors (M, J0) and Visual Acuity
Some 4- to 8-year-old children with INS (n = 32, including children from both albinism and idiopathic groups) had visual acuity measured on the same visit in which cycloplegic refraction was obtained or within 2 months of that visit. Visual acuity was measured with different methods according to the age of the children, including HOTV, EDTRS, or Snellen acuity. Children wore their habitual spectacle prescriptions. The correlation coefficient between J0 and binocular visual acuity was 0.38 (t30 = 2.25, P = 0.016). The correlation coefficient between M and binocular visual acuity was 0.25 (t30 = 1.414, P = 0.08). Calculated separately, the correlation coefficient between J0 and visual acuity in the idiopathic group was 0.40 (t11 = 1.447, P = 0.09) and in the albinism group was 0.31 (t17 = 1.344, P = 0.10). Although the sample size precluded statistical significance for the separate groups, the similarity of the observed correlations in both groups suggests that the overall correlation is not simply due to the poorer visual acuity in the albinism group.
Discussion
Several other studies previously reported WTR astigmatism in children and adults with INS (see Table 5 for a summary). The high prevalence of WTR astigmatism in the 4- to 8-year-old group reported herein is similar to that reported by Nathan et al.4 Higher prevalence was observed in studies of adults.5,6 In the ≤4-year age range, Jethani et al.12 reported a lower prevalence of WTR astigmatism than that found in the present study, and the difference between the two studies was even more pronounced in the >4-year age range. Several differences in methodology and subject selection could be causes of the observed differences. The power vector description used in this study provides more precise characterization of astigmatism than does the conventional description, in which the cylinder axis is rounded to define WTR astigmatism. Note, however, that the criterion for significant astigmatism in the present study was J0 ≥ 0.375 D, which is similar to the criterion of ≥0.75 D in the conventional notation used by Jethani et al.12 Both our study and that of Jethani et al., refractions were performed with complete cycloplegia; however, the children with nystagmus in Jethani et al. had a wider range of associated conditions, such that idiopathic INS and INS associated with albinism comprised only 40% of their sample. Despite differences among the studies, all agree that INS is associated with a high prevalence of WTR astigmatism.
Table 5.
Comparison of Prevalence of WTR in the Current and Previous Studies
| Study | Age | WTR |
Astigmatism Criteria | ||
|---|---|---|---|---|---|
| Albinism | Idiopathic | Normal13 | |||
| Results in this paper | Age≤0.5 y | 0.379 | 0.174 | 0.167 | J0 ≥0.375 D or |
| 0.5<Age≤1 y | 0.500 | 0.263 | 0.048 | Cylinder ≥0.75 D | |
| 1<Age≤4 y | 0.636 | 0.400 | 0.059 | ||
| 4<Age≤8 y | 0.857 | 0.583 | NA | ||
| Nathan et al.4 | 7–13 y | 0.786 | 0.573 | NA | Cylinder ≥1 D |
| Jethani et al.12 | ≤4 y | 0.427 | NA | Cylinder ≥0.75 D | |
| >4 y | 0.488 | ||||
| Sampath and Bedell5 | Adults | 0.890 | 0.717 | NA | Cylinder ≥0.25 D |
| Wildsoet et al.6 | Adults | 1 | NA | NA | Cylinder ≥1 D |
A unique contribution of the present study is that the data were classified in narrow age groups, so as to investigate the early refractive development in children with INS. Data from the two youngest age groups (≤0.5-year-old and 0.5–1-year-old) demonstrate that WTR astigmatism was already present in those children during infancy. Infantile astigmatism is known to have long-term consequences for refractive development. For example, myopia with astigmatism is prevalent among school-age children with a history of infantile ATR astigmatism.14
WTR astigmatism in INS may result from or be exacerbated by postnatal mechanical distortion of the cornea; Dickinson and Abadi2 measured corneal topography and found that astigmatism in adult patients with INS was mainly corneal. They suggested that WTR astigmatism may result from pressure of the eyelids on the constantly moving cornea. Similar hypotheses have been suggested for other groups of patients with astigmatism (e.g., the high prevalence of oblique astigmatism in children with Down syndrome has been attributed to mechanical pressure on the cornea from the upward slanting palpebral fissures).16 Although the mechanical distortion hypothesis is appealing, it has not yet been directly evaluated in children with INS.
The albinism group had a significantly greater mean magnitude of WTR astigmatism and a significantly higher prevalence of clinically significant WTR astigmatism than did the reference normal group before 6 months of age. This finding supports the idea that at least some of the prevalence of WTR astigmatism in children with albinism may be congenital. Neither the mean magnitude of WTR astigmatism nor the prevalence of clinically significant WTR astigmatism of the idiopathic group differed significantly from the reference normal group before 6 months of age. Longitudinal data showed that the average rate of change of WTR astigmatism in both INS groups was similar: ∼0.01 D per month or ∼0.5 D of J0 change over 4 years. Therefore, the increasing magnitude of astigmatic error with age in both INS groups may result from common postnatal factors, such as mechanical distortion.
The present study provided no evidence of emmetropization in the children with INS. They most often remained hyperopic, and the mean spherical equivalent remained larger than in the reference normal group throughout the first 8 years of life. Adults with albinism have more hyperopia (spherical equivalent) than do adults with idiopathic INS.5 However, no significant difference was found between the infants and children in these two groups in the present study. In addition, the spherical equivalent distributions in the INS groups had larger standard deviations than in the reference normal group and did not show significant kurtosis (a hallmark of emmetropization). These results are similar to those in previous report of refractive errors in adults with INS5 and demonstrate that emmetropization is affected in children with INS. It is not clear whether the large amount of astigmatism in children with INS interferes with their emmetropization. McLean and Wallman17 found that even very large amounts of astigmatic blur (5 D of J0) did not interfere with spherical spectacle lens compensation (emmetropization) in chicks. It may be that astigmatic blur plays a different role in human emmetropization or that patients with INS have abnormal refractive development, irrespective of astigmatism. For example, patients with INS had higher initial hyperopic refractive error on average compared with the reference normal group, and moderate-to-high hyperopia may be associated with a different rate of emmetropization than low hyperopia.18
INS, which is composed primarily of horizontal nystagmus, may interfere with emmetropization, because it smears the retinal image of vertically oriented targets, and emmetropization depends on the availability of unblurred retinal images.19,20 Retinal image motion can also limit visual acuity; in normal adults, visual acuity is reduced by as little as 2 to 4 deg/s of retinal image motion.21–23 Degraded visual acuity in INS patients, especially in the albinism group, may interfere with emmetropization. In the present study, a correlation was found between WTR astigmatism and visual acuity, but not between spherical equivalent refractive error and visual acuity. A similar correlation between astigmatism and visual acuity was reported previously in adults with INS.5,24 In contrast, Weiss and Kelly25 reported no relationship between visual acuity and either the spherical equivalent or the magnitude of astigmatism among infants and children with idiopathic nystagmus.
Although normal children showed similar rates of change in refractive error in their optimal and nonoptimal meridian with age (−0.6 D/y), children with INS had a much smaller decrease in power of the optimal meridian with age and an increase in power of the nonoptimal meridian. This unusual pattern of refractive change in children with INS is suggestive of meridional emmetropization. The emmetropization literature, in general, refers to changes in spherical refractive error as a function of axial elongation of the posterior pole of the eye. Meridional emmetropization, in contrast, must rely entirely on optical factors in the anterior segment of the eye, so the mechanisms and time course may be quite different. Kee et al.26 reported that cylinder-lens–reared infant monkeys emmetropized toward one of two focal planes associated with the astigmatic principal meridians (insensitive to orientation), but, also note that the SE is 0.00 (mixed astigmatism with one myopic axis and one hyperopic axis), whereas our young patients mostly had hyperopia in both principal meridians.
Meridional emmetropization assumes that the axis of astigmatism remains the same throughout refractive-error development. In support of this assumption, our longitudinal data showed that 98% of patients with INS maintained the same axis direction once astigmatism developed. Further, the refractive errors in the optimal meridian (i.e., the meridian focused closer to the retina) showed a greater trend toward emmetropization than in the nonoptimal meridian, in both the albinism and idiopathic groups. Our results therefore support the occurrence of meridional emmetropization in patients with INS, who frequently have considerable WTR astigmatism.
A limitation of our study is that we compared data from patients with INS in the Dallas-Fort Worth area to normative data obtained by Mayer et al.13 in the Boston area several years ago. It is possible that there are systematic differences in technique or criteria used in retinoscopy by the examiners. We attempted to minimize these by identifying a normative group that was examined with a method comparable to that used with the children with INS (i.e., streak retinoscopy after 1% cyclopentolate and at 40-cm working distance). Nonetheless, it is possible that some examiners inadvertently, but consistently under- or overestimate their working distance or that examiners have slightly different criteria for retinoscopy. These small residual differences in technique, however, should primarily affect spherical power rather than the amount or axis of astigmatism.27 This minor disagreement is exactly the type that occurs between two examiners and was reported by Mayer et al.13
Many studies report that normal infants have predominantly ATR astigmatism,8,10,28,29 although a few8,10 have reported that the prevalence of WTR astigmatism in normal children increases with the age. On the other hand, Mutti et al.30 found that WTR astigmatism is prevalent during infancy and that the prevalence of significant WTR astigmatism (cylinder ≥1 D) decreases between 3 and 36 months of age in normal children. Despite the controversy about the most prevalent axis of astigmatism during infancy, all studies agree that the magnitude of astigmatism decreases with age in normal children.
In conclusion, both our cross-sectional and longitudinal data demonstrated that WTR astigmatism was common among the infants and children with INS in our study and that it increased in magnitude with age during the first 8 years of life. In addition, emmetropization was abnormal among children with INS. The mean spherical equivalent showed little or no change in hyperopia over the first 8 years of life. Our longitudinal results were consistent with meridional emmetropization in children with INS and WTR astigmatism.
Acknowledgments
The authors thank Luisa Mayer and Anne B. Fulton for generously providing normative raw data and allowing us to conduct analyses on those data, and Ying-sheng Hu (Biostatistician, University of Houston) for the calculations of kurtosis and skewness.
Footnotes
Supported by National Institutes of Health Grant EY05236.
Disclosure: J. Wang, None; L.M. Wyatt, None; J. Felius, None; D.R. Stager, Jr, None; D.R. Stager, Sr, None; E.E. Birch, None; H.E. Bedell, None
References
- 1.Committee for the Classification of Eye Movement Abnormalities and Strabismus (CEMAS) Workshop. Classification of Eye Movement Abnormalities and Strabismus (CEMAS) Bethesda, MD: National Eye Institute; November, 2001 [Google Scholar]
- 2.Dickinson CM, Abadi RV. Corneal topography of humans with congenital nystagmus. Ophthalmic Physiol Opt 1984; 4(1): 3–13 [PubMed] [Google Scholar]
- 3.Hertle RW. Examination and refractive management of patients with nystagmus. Surv Ophthalmol 2000; 45(3): 215–222 [DOI] [PubMed] [Google Scholar]
- 4.Nathan J, Kiely PM, Crewther SG, Crewther DP. Astigmatism occurring in association with pediatric eye disease. Am J Optom Physiol Opt 1986; 63(7): 497–504 [DOI] [PubMed] [Google Scholar]
- 5.Sampath V, Bedell HE. Distribution of refractive errors in albinos and persons with idiopathic congenital nystagmus. Optom Vis Sci 2002; 79(5): 292–299 [DOI] [PubMed] [Google Scholar]
- 6.Wildsoet CF, Oswald PJ, Clark S. Albinism: its implications for refractive development. Invest Ophthalmol Vis Sci 2000; 41(1): 1–7 [PubMed] [Google Scholar]
- 7.Saunders KJ. Early refractive development in humans. Surv Ophthalmol 1995; 40(3): 207–216 [DOI] [PubMed] [Google Scholar]
- 8.Abrahamsson M, Fabian G, Sjostrand J. Changes in astigmatism between the ages of 1 and 4 years: a longitudinal study. Br J Ophthalmol 1988; 72(2): 145–149 [DOI] [PMC free article] [PubMed] [Google Scholar]
- 9.Atkinson J, Braddick O, French J. Infant astigmatism: its disappearance with age. Vision Res 1980; 20(11): 891–893 [DOI] [PubMed] [Google Scholar]
- 10.Dobson V, Fulton AB, Sebris SL. Cycloplegic refractions of infants and young children: the axis of astigmatism. Invest Ophthalmol Vis Sci 1984; 25(1): 83–87 [PubMed] [Google Scholar]
- 11.Howland HC, Sayles N. Photorefractive measurements of astigmatism in infants and young children. Invest Ophthalmol Vis Sci 1984; 25(1): 93–102 [PubMed] [Google Scholar]
- 12.Jethani J, Prakash K, Vijayalakshmi P, Parija S. Changes in astigmatism in children with congenital nystagmus. Graefes Arch Clin Exp Ophthalmol 2006; 244(8): 938–943 [DOI] [PubMed] [Google Scholar]
- 13.Mayer DL, Hansen RM, Moore BD, Kim S, Fulton AB. Cycloplegic refractions in healthy children aged 1 through 48 months. Arch Ophthalmol 2001; 119(11): 1625–1628 [DOI] [PubMed] [Google Scholar]
- 14.Gwiazda J, Grice K, Held R, McLellan J, Thorn F. Astigmatism and the development of myopia in children. Vision Res 2000; 40(8): 1019–1026 [DOI] [PubMed] [Google Scholar]
- 15.Thibos LN, Wheeler W, Horner D. Power vectors: an application of Fourier analysis to the description and statistical analysis of refractive error. Optom Vis Sci 1997; 74(6): 367–375 [DOI] [PubMed] [Google Scholar]
- 16.Haugen OH, Hovding G, Lundstrom I. Refractive development in children with Down's syndrome: a population based, longitudinal study. Br J Ophthalmol 2001; 85(6): 714–719 [DOI] [PMC free article] [PubMed] [Google Scholar]
- 17.McLean RC, Wallman J. Severe astigmatic blur does not interfere with spectacle lens compensation. Invest Ophthalmol Vis Sci 2003; 44(2): 449–457 [DOI] [PubMed] [Google Scholar]
- 18.Saunders KJ, Woodhouse JM, Westall CA. Emmetropisation in human infancy: rate of change is related to initial refractive error. Vision Res 1995; 35(9): 1325–1328 [DOI] [PubMed] [Google Scholar]
- 19.Wallman J, Winawer J. Homeostasis of eye growth and the question of myopia. Neuron 2004; 43(4): 447–468 [DOI] [PubMed] [Google Scholar]
- 20.Wildsoet CF. Active emmetropization: evidence for its existence and ramifications for clinical practice. Ophthalmic Physiol Opt 1997; 17(4): 279–290 [PubMed] [Google Scholar]
- 21.Russell-Eggitt I, Harris CM, Kriss A. Delayed visual maturation: an update. Dev Med Child Neurol 1998; 40(2): 130–136 [DOI] [PubMed] [Google Scholar]
- 22.Stang HJ. Developmental disabilities associated with congenital nystagmus. J Dev Behav Pediatr 1991; 12(5): 322–323 [PubMed] [Google Scholar]
- 23.Tresidder J, Fielder AR, Nicholson J. Delayed visual maturation: ophthalmic and neurodevelopmental aspects. Dev Med Child Neurol 1990; 32(10): 872–881 [PubMed] [Google Scholar]
- 24.Bedell HE, Loshin DS. Interrelations between measures of visual acuity and parameters of eye movement in congenital nystagmus. Invest Ophthalmol Vis Sci 1991; 32(2): 416–421 [PubMed] [Google Scholar]
- 25.Weiss AH, Kelly JP. Acuity development in infantile nystagmus. Invest Ophthalmol Vis Sci 2007; 48(9): 4093–4099 [DOI] [PubMed] [Google Scholar]
- 26.Kee CS, Hung LF, Qiao Y, Smith EL., 3rd Astigmatism in infant monkeys reared with cylindrical lenses. Vision Res 2003; 43(26): 2721–2739 [DOI] [PubMed] [Google Scholar]
- 27.Keech PM. The effect of cycloplegia on the determination of refractive error by the Ophthalmetron. Am J Optom Physiol Opt 1979; 56(4): 228–230 [DOI] [PubMed] [Google Scholar]
- 28.Ehrlich DL, Braddick OJ, Atkinson J, et al. Infant emmetropization: longitudinal changes in refraction components from nine to twenty months of age. Optom Vis Sci 1997; 74(10): 822–843 [DOI] [PubMed] [Google Scholar]
- 29.Thorn F, Held R, Fang LL. Orthogonal astigmatic axes in Chinese and Caucasian infants. Invest Ophthalmol Vis Sci 1987; 28(1): 191–194 [PubMed] [Google Scholar]
- 30.Mutti DO, Mitchell GL, Jones LA, et al. Refractive astigmatism and the toricity of ocular components in human infants. Optom Vis Sci 2004; 81(10): 753–761 [DOI] [PubMed] [Google Scholar]