

Abstract
Background
Vγ9+Vδ2+ γδ T cells (Vδ2+ T cells) are activated by Mycobacterium tuberculosis and secrete interferon (IFN)–γ. Vδ2+ T cells recognize phosphoantigens, such as bromohydrin pyrophosphate (BrHPP), and link innate and adaptive immunity.
Methods
A whole-blood assay was developed that used IFN-γ secretion in response to BrHPP as a measurement of Vδ2+ T cell function.
Results
Peak IFN-γ levels were detected after stimulating whole blood with BrHPP for 7–9 days. IFN-γ production in whole blood in response to BrHPP paralleled IFN-γ production and Vδ2+ T cell expansion of peripheral-blood mononuclear cells. The assay was used to evaluate Vδ2+ T cell function in subjects in the United States (n = 24) and Uganda (n = 178) who were or were not infected with M. tuberculosis and/or human immunodeficiency virus (HIV) type 1. When 50 μmol/L BrHPP was used, 100% of healthy subjects produced IFN-γ. The Vδ2+ T cell response was independent of the tuberculin skin test response. In Uganda, Vδ2+ T cell responses were decreased in patients with tuberculosis (n = 73) compared with responses in household contacts (n = 105). HIV-1–positive household contacts had lower responses than did HIV-1–negative household contacts. HIV-1–positive patients with tuberculosis had the lowest Vδ2+ T cell responses.
Conclusions
Tuberculosis and HIV-1 infection are associated with decreased Vδ2+ T cell function. Decreased Vδ2+ T cell function may contribute to increased risk for tuberculosis in HIV-1–positive patients.
γδ T cells represent 1%–5% of circulating human T cells [1, 2]. Vγ9+Vδ2+ γδ T cells (Vδ2+ T cells), the dominant circulating γδ T cell subset in adults, are activated in response to intracellular pathogens, such as Mycobacterium tuberculosis [3–7]. Vδ2+ T cells secrete interferon (IFN)–γ and have cytotoxic T lymphocyte and natural killer cell–like effector function. Vδ2+ T cells recognize small organic phosphate antigens (phosphoantigens) and other nonpeptidic molecules. The tuberculosis antigens found inside M. tuberculosis bacilli were among the first phosphoantigens to be purified [8, 9]. Others include isopentenyl pyrophosphate (IPP) [10, 11] and 3-formyl-1-butyl pyrophosphate [12]. The synthetic analogue bromohydrin pyrophosphate (BrHPP) activates Vδ2+ T cells at nanomolar concentrations [13, 14]. Phosphoantigens are produced by many pathogens and are recognized in a non–major histocompatibility complex–restricted manner. Thus, Vδ2+ T cells can provide a link between innate and adaptive immunity to a wide range of pathogens.
In primates, Vδ2+ T cell responses increase during primary mycobacterial infection and increase further on challenge after vaccination with bacille Calmette-Guérin (BCG) [15, 16]. BCG vaccination of adults increases Vδ2+ T cell responses [17]. Vδ2+ T cells are activated in vitro by M. tuberculosis [18]. Studies investigating total γδ or Vδ2+ T cell function in peripheral blood and lungs of patients with tuberculosis, their household contacts, and healthy subjects have provided contradictory results. Some studies demonstrated increased numbers of γδ T cells in peripheral blood of patients with tuberculosis [19, 20], and others demonstrated decreased γδ T cell responses to M. tuberculosis antigens in patients with tuberculosis [21–27]. This variability was likely due to the different antigens used to activate γδ T cells, the stage of infection or disease, and the age of the subjects.
Alterations in the γδ T cell repertoire and its function also have been described in HIV-1–positive patients and simian immunodeficiency virus–infected primates [28–32]. Vδ2+ T cell activation is dependent on interleukin (IL)–2 produced by CD4+ T cells, which is diminished in HIV-1 infection [33]. Vδ2+ T cells lyse HIV-1–infected cells and block entry of HIV-1 via β-chemokine secretion [34]. Therefore, decreased Vδ2+ T cell function may contribute not only to the loss of anti–HIV-1 immunity but also to diminished immune protection against M. tuberculosis.
Most studies of γδ T cell function have applied multicolor flow cytometry to enumerate Vδ2+ T cells in mixed populations of peripheral-blood mononuclear cells (PBMCs) stimulated with crude microbial antigens and rely on IL-2 produced by CD4+ T cells for Vδ2+ T cell expansion. Flow-cytometric assays are not optimal for field studies in settings of endemicity for tuberculosis. A growing literature has validated the use of whole-blood assays to measure immune function in population-based studies of M. tuberculosis infection and disease [35–38]. We have developed a simple whole-blood assay that measures IFN-γ secretion in response to the phosphoantigen BrHPP in the presence of IL-2 to assess Vδ2+ T cell function independent of CD4+ T cell responses. This assay was used to assess Vδ2+ T cell responses in M. tuberculosis– and HIV-1–positive patients in the United States and Uganda.
SUBJECTS, MATERIALS, AND METHODS
Study populations
In Cleveland, Ohio, 24 healthy health care workers and laboratory personnel, 20–48 years old, were recruited. Nine had a history of positive results for the tuberculin skin test (TST) (induration, ≥5 mm), and 15 had negative results for the TST. Five received BCG vaccination.
In Kampala, Uganda, patients with tuberculosis and their household contacts were enrolled as part of the Kawempe Community Study, which is an ongoing epidemiological study of M. tuberculosis infection and disease in households in the Kawempe Division of Kampala and was patterned after an earlier household transmission study [39]. Patients with tuberculosis were identified at the Uganda National TB and Leprosy Program treatment center at Old Mulago Hospital. The diagnosis of tuberculosis was based on clinical findings, a positive result of chest radiography, and a positive result of culture of sputum. Seventy-three patients with tuberculosis and 105 household contacts >15 years old were recruited between November 2002 and May 2004, as described elsewhere [39]. Household contacts were evaluated at baseline with standardized questionnaires about tuberculosis risk and a limited physical examination that included ascertainment of a BCG scar, chest radiography, HIV-1 serological assessment, and the TST. Blood for immune function studies was drawn before the TST was administered. The TST was performed using the Mantoux method (Tubersol; Connaught Laboratories), and responses were assessed 48–72 h after testing. Indurations ≥5 mm were considered to indicate a positive result. The study was approved by institutional review boards in Cleveland and Kampala. Written, informed consent was obtained from all adult subjects and parents or guardians of adolescents <18 years old.
Antibodies and antigens
Leu-4 (phycoerythrin [PE]–conjugated CD3), Leu-3a (fluorescein isothiocyanate [FITC]–conjugated CD4), Leu-2a (FITC-conjugated CD8), γδ T cell receptor (TCR; clone 11F2), Vδ2 TCR (clone B6.1), αβ TCR, and isotypic control antibodies were purchased from BD Pharmingen.
BrHPP was provided by Christian Belmant (Innate Pharma). IPP was purchased from Sigma, and purified protein derivative from M. tuberculosis was obtained from Wyeth-Lederle Vaccines. M. tuberculosis H37Ra was cultured as described elsewhere [14].
Expansion of peripheral-blood γδ T cells by M. tuberculosis or phosphoantigen
PBMCs were isolated, and expansion of γδ T cells by M. tuberculosis or phosphoantigens was performed as described elsewhere [14]. Cells were harvested on days 0, 3, 5, 7, and 9. The percentages of CD3+, γδ TCR+, CD4+, and CD8+ T cells were assessed by flow cytometry (FACScan; Becton Dickinson) with CellQuest software (version 3.3; Becton Dickinson). γδ T cells were depleted from PBMCs by positive selection with antibody-coated magnetic beads (Miltenyi Biotec).
Whole-blood IFN-γ assay
Blood (10 mL) was collected in heparinized 20-mL syringes (20 U/mL; Pharmacia Upjohn). Blood was diluted in RPMI 1640 supplemented with 20 mmol/L HEPES, 2 mmol/L L-glutamine, 100 U/mL penicillin, and 100 μg/mL streptomycin. Diluted blood (1 mL) was distributed in 24-well tissue-culture plates (Corning). Cultures were stimulated with IPP (25–200 μmol/L) or BrHPP (400 nmol/L to 250 μmol/L) and IL-2 (25 U/mL) for 7 days at 37°C in 5% CO2. Five hundred milliliters of supernatant was harvested from each well for measurement of IFN-γ. Supernatants were stored at −80°C. For some subjects, PBMCs were stimulated in parallel with whole blood. IFN-γ was measured by capture ELISA (Pierce-Endogen), according to the manufacturer’s recommendations. Sensitivity of the IFN-γ ELISA was 2 pg/mL, with a standard curve range of 25.6–1000 pg/mL.
Statistical analysis
IFN-γ responses were calculated as the difference between IL-2 responses with and without BrHPP stimulus. Median IFN-γ responses were compared between groups by Wilcoxon signed rank test. Log-transformed IFN-γ levels followed a normal distribution, and mean responses of the transformed measures were compared between groups by t test. To test for an association between categorical IFN-γ responses and HIV-1 or M. tuberculosis disease status, cutoff values for high, medium, and low IFN-γ responses were calculated among healthy HIV-1–negative household contacts by use of the mean ± SD of log-transformed IFN-γ values. Fisher’s exact test was used to assess the significance of proportional differences between groups. The correlation between the size of the TST response and the IFN-γ response was assessed by a Spearman coefficient and P value. P < .05 was considered to be statistically significant for all tests.
RESULTS
IFN-γ secretion in response to phosphoantigen as a measurement of Vδ2+ T cell activation in whole-blood cultures
We first compared phosphoantigen and M. tuberculosis–mediated expansion of γδ T cells from PBMCs. The percentage of Vδ2+ T cells in cultures stimulated with 1 μmol/L BrHPP was comparable to those stimulated with M. tuberculosis (50%–60%) (figure 1). On a molar basis, BrHPP was more potent than IPP in expanding Vδ2+ T cells. Vδ2+ T cell expansion was first detected after 3 days of culture with BrHPP plus IL-2, and maximum expansion was observed after 7–9 days (figure 2). Vδ2+ T cells produce large amounts of IFN-γ in response to M. tuberculosis and phosphoantigens [14, 40]. PBMCs stimulated with BrHPP plus IL-2 produced IFN-γ, whereas cells cultured with either IL-2 or BrHPP alone did not (figure 3A). Depletion of γδ T cells from PBMCs suppressed IFN-γ production, demonstrating that Vδ2+ T cells were responsible for IFN-γ production in response to BrHPP. Results were confirmed by intracellular IFN-γ staining (data not shown).
Figure 1.
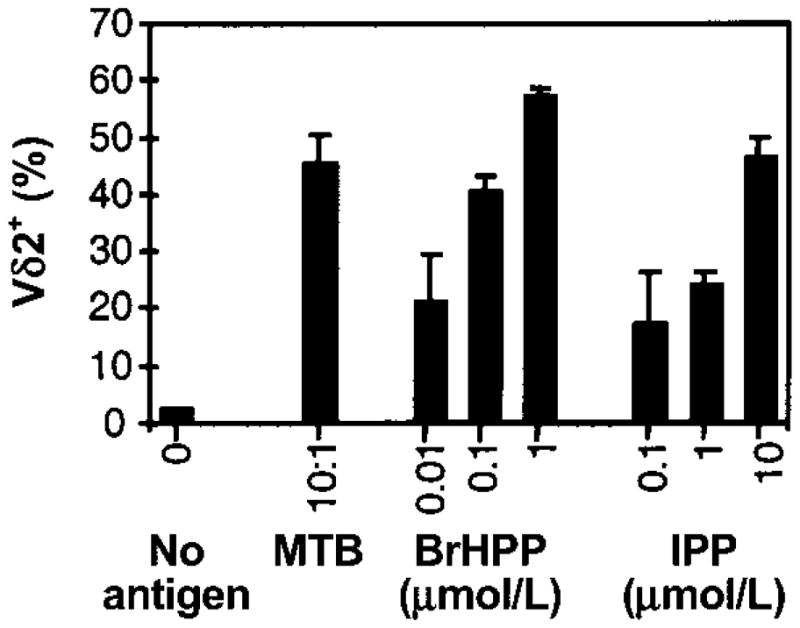
Vδ2+ T cell expansion after stimulation of peripheral-blood mononuclear cells (PBMCs) with Mycobacterium tuberculosis (MTB) or phosphoantigens. PBMCs (2 × 10⁶ cells/2-mL well) from tuberculin skin test–positive subjects were stimulated in triplicate cultures with live MTB at a bacteria:macrophage ratio of 10:1 or with the indicated concentrations of isopentenyl pyrophosphate (IPP) or bromohydrin pyrophosphate (BrHPP). Interleukin-2 (25 U/mL) was added to all wells, including a control well (no antigen). After 9 days, viable cells were harvested, counted, and analyzed by 2-color flow cytometry for CD3, CD4, CD8, and Vδ2 T cell receptor (Vδ2) expression. Results are expressed as mean percentages (± SD of triplicate cultures) of Vδ2+ cells over total number of CD3+ cells on day 9. One representative experiment of 3 is shown.
Figure 2.
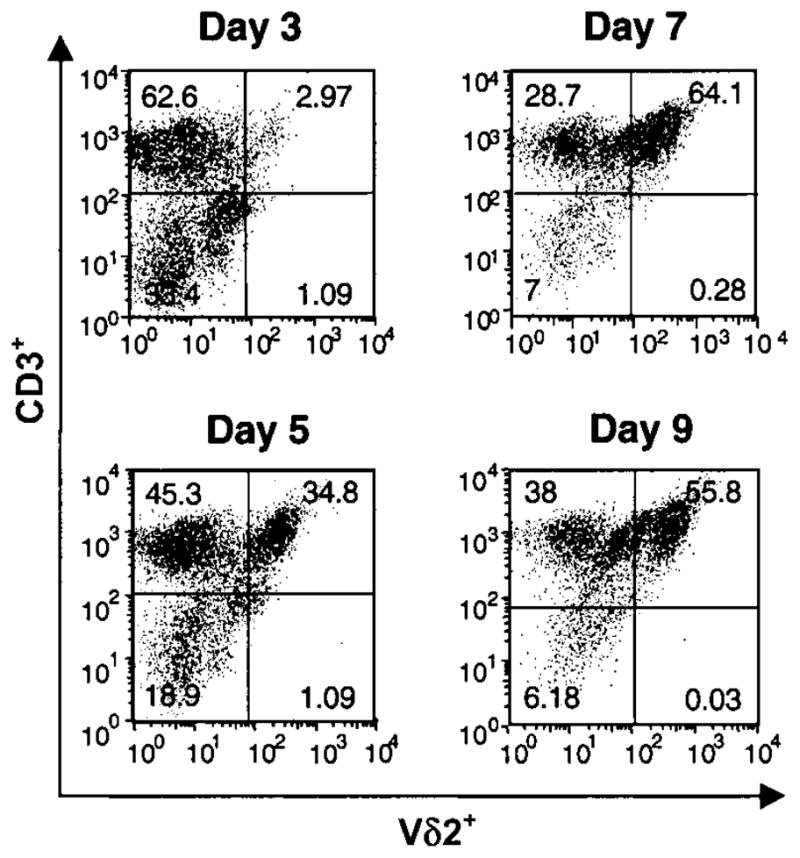
Kinetics of Vδ2+ T cell expansion in peripheral-blood mononuclear cells (PBMCs) in response to bromohydrin pyrophosphate (BrHPP). PBMCs from tuberculin skin test–positive subjects were stimulated with BrHPP (1 μmol/L) and interleukin-2 (25 U/mL), and cells were harvested at indicated time points. Viable cells were analyzed by 2-color flow cytometry for αβ T cell receptor, CD3, and Vδ2 expression. The percentages of Vδ2+CD3+ cells at baseline and days 3, 5, 7, and 9 are shown for 1 representative experiment of 4.
Figure 3.

Interferon (IFN)–γ secretion in response to phosphoantigens by peripheral-blood mononuclear cells (PBMCs) and whole blood. A, Dependence on γδ T cells of IFN-γ secretion in response to bromohydrin pyrophosphate (BrHPP). γδ T cells were depleted from PBMCs by positive selection with antibody-coated magnetic beads. γδ T cell–depleted and undepleted PBMCs (2 × 10⁶) were stimulated with BrHPP, interleukin (IL)–2, or BrHPP plus IL-2. Culture supernatants were collected after 7 days, and IFN-γ was measured by ELISA. One representative experiment of 3 is shown. B, Comparison of IFN-γ secretion by PBMCs and whole-blood cultures after stimulation with BrHPP. PBMCs (1 × 10⁵ and 3 × 10⁵ cells/well) and whole blood (1 mL of 1:10-diluted peripheral blood) from the same subject were stimulated in 24-well plates with BrHPP (50 μmol/L) and IL-2 (25 U/mL), and culture supernatants were harvested at indicated time points. IFN-γ was measured by ELISA. Results are expressed as the IFN-γ produced in response to BrHPP plus IL-2 minus the IFN-γ produced in response to IL-2 alone, for each time point. C–D, IFN-γ secretion by whole-blood cultures in response to different concentrations of BrHPP and isopentenyl pyrophosphate (IPP). Heparinized peripheral blood (1 mL) was diluted 1:5 (open circles) or 1:10 (black squares) with RPMI 1640 and stimulated in 24-well plates with indicated concentrations of BrHPP (C) or IPP (D) plus IL-2 (25 U/mL). Culture supernatants were collected after 7 days, and IFN-γ was measured by ELISA. Results are expressed as IFN-γ in response to IL-2 only or IL-2 plus phosphoantigen.
Next, we developed a whole-blood assay to measure Vδ2+ T cell responses to phosphoantigens. Figure 3B demonstrates that 1 × 10⁵ PBMCs and a 1:10 dilution of whole blood stimulated with phosphoantigen produced similar amounts of IFN-γ. Kinetics of IFN-γ secretion from whole blood was similar to that from PBMCs, with IFN-γ detected by 3 days and peak concentrations detected after 7–9 days. Dose response experiments (figure 3C and D) revealed that BrHPP was also more potent than IPP in the whole-blood assay, with 50 μmol/L BrHPP providing maximum stimulation. The increased concentrations of phosphoantigens that were required in the whole-blood assays to achieve maximum stimulation likely resulted from differences in phosphatase activity between whole blood and PBMCs. IFN-γ responses to BrHPP plus IL-2 in whole blood correlated with Vδ2+ T cell expansion (data not shown). Optimal results were obtained when whole blood was diluted and incubated with phosphoantigen within 4 h after drawing. Thus, IFN-γ is detectable in whole blood cultured with phosphoantigens and is a good correlate of Vδ2+ T cell activation—as good as IFN-γ responses by PBMCs.
Whole-blood IFN-γ responses to phosphoantigen in an area in which tuberculosis is not endemic
Vδ2+ T cell function was assessed in persons living in an area that was not endemic for M. tuberculosis infection and disease. Nine healthy subjects with positive results for the TST and 15 healthy subjects with negative results for the TST were recruited from health care and laboratory personnel in Cleveland. Whole blood was stimulated with increasing concentrations of BrHPP (0.4–50 μmol/L) in the presence of IL-2 (25 U/mL). IFN-γ responses to BrHPP were calculated as the increase over responses to stimulation with IL-2 alone, which ranged from 0 to 93 pg/mL. At all concentrations of BrHPP, mean log-transformed IFN-γ responses were significantly increased compared with those for unstimulated (IL-2 alone) whole-blood cultures (P < .0001). Median IFN-γ responses to BrHPP were 41 pg/mL (interquartile range [IQR], 9.5–299 pg/mL) for 0.4 μmol/L, 394 pg/mL (IQR, 128–1216 pg/mL) for 2 μmol/L, 802 pg/mL (IQR, 331–2961 pg/mL) for 10 μmol/L, and 1385 pg/mL (IQR, 442–3852 pg/mL) for 50 μmol/L (figure 4A). The distribution of responses to 50 μmol/L BrHPP indicated that subjects could be grouped according to low, medium, and high IFN-γ responses. Cutoff values for these 3 categories were based on mean log-transformed IFN-γ values ± SD (3.1 ± 0.53) of the 24 subjects. Low responses were <2.57 (<371 pg/mL), intermediate responses were 2.57–3.63 (371–4266 pg/mL), and high responses were >3.63 (>4266 pg/mL). Seventeen percent of subjects had low responses, 62% had intermediate responses, and 21% had high responses. No differences in IFN-γ production were observed between TST-positive and TST-negative subjects at BrHPP concentrations between 0.4 and 50 μmol/L (figure 4B). Thus, although all healthy subjects had Vδ2+ T cell responses to high concentrations of BrHPP, the responses were heterogeneous and independent of TST status.
Figure 4.

Interferon (IFN)–γ responses to bromohydrin pyrophosphate (BrHPP) in whole blood obtained from healthy tuberculin skin test (TST)–positive and TST-negative subjects living an area in which Mycobacterium tuberculosis infection is not endemic (Cleveland). A, IFN-γ responses of whole blood from TST-positive (n = 9) and TST-negative (n = 15) subjects stimulated with 0.4, 2, 10, and 50 μmol/L BrHPP and interleukin (IL)–2 (25 U/mL) for 7 days. IFN-γ was measured by ELISA. B, Comparison of whole-blood IFN-γ responses of TST-positive and TST-negative subjects to BrHPP. Peripheral blood was diluted and stimulated with BrHPP (50 μmol/L) plus IL-2 (25 U/mL) for 7 days, and IFN-γ was measured by ELISA. Results are shown as box plots containing median IFN-γ levels, with error bars showing the 25th and 75th percentiles and whiskers indicating the 5th and 95th percentiles. P, not significant, TST-positive vs. TST-negative subjects.
Whole-blood IFN-γ responses to phosphoantigen of patients with tuberculosis and their household contacts in an area in which M. tuberculosis and HIV-1 infection are endemic
We next determined whether the whole-blood assay could differentiate Vδ2+ T cell responses in subjects with different risks for M. tuberculosis infection and disease in an area in Uganda where HIV-1 and tuberculosis are endemic. Clinical and demographic characteristics of patients with tuberculosis and their household contacts are summarized in table 1. Thirty-six (49%) of 73 patients with tuberculosis and 20 (19%) of 105 household contacts were infected with HIV-1.
Table 1.
Interferon (IFN)–γ responses to bromohydrin pyrophosphate (BrHPP) in whole blood from patients with tuberculosis and their household contacts in Kampala, Uganda, according to HIV-1 serostatus.
| Parameter | HIV-1 negative (n = 122) |
HIV-1 positive (n = 56) |
||
|---|---|---|---|---|
| Patients with tuberculosis (n = 37) | Household contacts (n = 85) | Patients with tuberculosis (n = 36) | Household contacts (n = 20) | |
| Sex, no. (%) male | 20 (54) | 34 (40) | 16 (44) | 9 (45) |
| Age, mean ± SD, years | 27.4 ± 9.1 | 29.8 ± 13.8 | 33.6 ± 9 | 32.4 ± 8.2 |
| IFN-γ response, median (interquartile range), pg/mL | 423 (101–935) | 746 (335–2223) | 131 (13–652) | 431 (68–1486) |
| IFN-γ response, log-transformed mean ± SD, pg/mL | 2.49 ± 0.85 | 2.86 ± 0.78 | 1.88 ± 1.16 | 2.23 ± 1.19 |
| Tuberculin skin test response, no. (%) positive | ND | 63 (74) | ND | 7 (35) |
NOTE. IFN-γ (pg/mL) was measured in supernatants of whole blood stimulated for 7 days with BrHPP and interleukin-2. ND, not determined; TST, tuberculin skin test.
On the basis of results in healthy subjects in the United States, we evaluated whole-blood IFN-γ responses to 50 μmol/L BrHPP in patients with tuberculosis and their household contacts in Uganda. Within 4 h of being drawn, whole blood was stimulated with BrHPP plus IL-2, and the BrHPP-specific IFN-γ response was calculated as the response to BrHPP plus IL-2 minus the response to IL-2 alone. Whole-blood IFN-γ responses to IL-2 alone were higher in subjects in Uganda than in healthy subjects in the United States (median, 86.1 vs. 5.5 pg/mL), suggesting in vivo immune activation.
All subjects were assessed for TST responses (table 1), with indurations measured in millimeters. The mean TST response was 13.7 mm for HIV-1–negative household contacts and 10 mm for HIV-1–positive household contacts. Figure 5 shows the distribution of TST responses of HIV-1–negative household contacts and compares them with Vδ2+ T cell IFN-γ responses in whole blood. No correlation was found between the size of the TST response and Vδ2+ T cell function, which is consistent with the findings for healthy subjects in the United States (figures 4B and 5).
Figure 5.
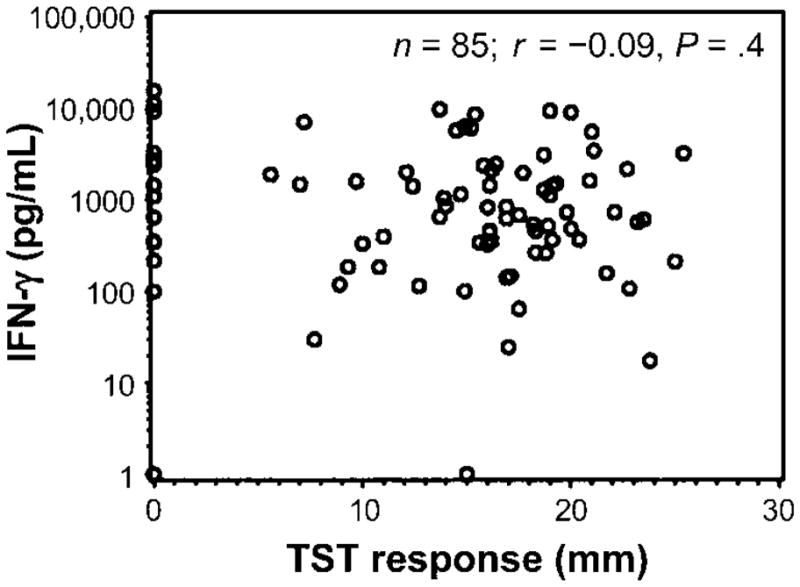
Lack of association between interferon (IFN)–γ responses to bromohydrin pyrophosphate (BrHPP) and the size of the reaction to the tuberculin skin test (TST) in 85 household contacts of patients with tuberculosis. IFN-γ response to phosphoantigens was correlated with the size of the TST response. Shown is the correlation plot between IFN-γ response (pg/mL) after subtraction of the response to interleukin-2 alone and the size of the TST response in mm. Spearman correlation, r = −0.09; P = .4.
Among HIV-1–negative subjects, patients with tuberculosis had lower Vδ2+ T cell IFN-γ responses than did HIV-1–negative household contacts (P = .023) (figure 6A) (table 1). Patients with tuberculosis who were coinfected with HIV-1 had the lowest Vδ2+ T cell responses—much lower than those of HIV-1–negative patients with tuberculosis (P = .012). Among household contacts of patients with tuberculosis, HIV-1 infection was found to be an additional risk factor for decreased Vδ2+ T cell function (P = .034). Of note, likely because of the smaller sample size, Vδ2+ T cell function was not significantly different between HIV-1–positive patients with tuberculosis and HIV-1–positive household contacts (P = .162). Statistical differences between groups were assessed by both t test and Wilcoxon signed rank test, and the same results were observed. When these analyses were repeated and responses to treatment with IL-2 plus BrHPP were measured but responses to IL-2 alone were not subtracted, the same results were observed.
Figure 6.

Distribution of IFN-γ responses to bromohydrin pyrophosphate (BrHPP) in patients with tuberculosis, HIV-1–positive patients with tuberculosis, and their household contacts. A, Comparison of IFN-γ responses to BrHPP between HIV-1–positive and HIV-1–negative subjects with and without tuberculosis. Whole blood was diluted and stimulated with BrHPP (50 μmol/L) plus interleukin (IL)–2 (25 U/mL) for 7 days, and IFN-γ was measured by ELISA. The IFN-γ response from each subject was calculated by subtracting the response to IL-2 alone from the response to BrHPP plus IL-2. Box plots represent median IFN-γ responses, with error bars showing the 25th and 75th percentiles and whiskers indicating the 5th and 95th percentiles. B, Histogram of log-transformed IFN-γ response of HIV-1–negative household contacts (n = 85). The IFN-γ response of each subject was calculated by subtracting the response to IL-2 alone from the response to BrHPP plus IL-2. The mean ± SD response was 2.86 ± 0.78. Cutoff values (2.1 and 3.6) were calculated as means ± SD and are indicated at the top of the panel.
As was observed among healthy subjects in the United States, subjects with low, intermediate, and high IFN-γ responses could be detected among HIV-1–negative household contacts. When the mean ± SD log-transformed IFN-γ value of 2.86 ± 0.78 for HIV-1–negative household contacts was used, low responses were found to be <2.08 (<120 pg/mL), intermediate responses were found to be 2.08–3.64 (120–4365 pg/mL), and high responses were found to be >3.64 (>4365 pg/mL). We then compared the distribution of those with low, intermediate, and high IFN-γ responses among patients with tuberculosis and their household contacts. By Fisher’s exact test, there was a strong association between low response to BrHPP and tuberculosis (P = .001). When household contacts were sorted by HIV-1 status, a similar trend toward lower responses among HIV-1–positive household contacts was observed (P = .07).
These results demonstrate that tuberculosis and HIV-1 infection were independently associated with decreased Vδ2+ T cell function, as confirmed by multivariate regression analysis. The presence of both infections resulted in the lowest Vδ2+ T cell function. Decreased Vδ2+ T cell function may contribute to the increased risk for tuberculosis in HIV-1–positive patients. The lack of correlation with the size of the TST response, which is largely a reflection of CD4+ T cell responses to soluble protein antigens, supports the finding that Vδ2+ T cell function is a CD4+ T cell–independent measure of cellular immune function.
DISCUSSION
Vδ2+ T cells are the dominant γδ T cell subset in healthy adults and may constitute a link between innate and adaptive immunity to M. tuberculosis, responding rapidly to phosphoantigens released by M. tuberculosis and other bacilli without extensive requirements for antigen processing and presentation [5, 18]. Vδ2+ T cells secrete IFN-γ and tumor necrosis factor–α [40–42], cytokines important for controlling M. tuberculosis [2], and may reduce intracellular mycobacterial growth [43]. Vδ2+ T cell dysfunction and anergy have been described in tuberculosis and HIV-1 infection [23, 25, 44]. Immunoepidemiological and clinical trials would help to further define the role that Vδ2+ T cells play in human immunity to M. tuberculosis and HIV-1. The present study aimed to develop a simple assay of Vδ2+ T cell function by using whole blood and then to evaluate Vδ2+ T cell function in a population-based study of M. tuberculosis infection and disease in a region in which HIV-1 infection and tuberculosis are endemic.
Most studies of γδ T cell function use PBMCs and flow cytometry, which require large volumes of blood, are technically demanding, and are not suitable for large-scale field studies. Whole-blood assays have been used in tuberculosis studies with excellent results to evaluate antigen-specific CD4+ and CD8+ T cell responses [38, 45]. The Vδ2+ T cell whole-blood assay took advantage of the fact that Vδ2+ T cells recognize small microbial phosphoantigens, whereas αβTCR+CD4+/CD8+ and Vδ1+ T cells (the other circulating γδ T cell subset) do not. The addition of exogenous IL-2 eliminated the need for CD4+ T cell responses, rendering the assay specific for Vδ2+ T cell function. IL-2 alone elicited IFN-γ from some whole-blood cultures and was higher in household contacts in Uganda, likely because of in vivo immune activation from recent exposure to M. tuberculosis or other endemic pathogens. To compensate for IFN-γ induced by IL-2 alone, Vδ2+ T cell responses were expressed as the difference between IFN-γ induced by BrHPP plus IL-2 and by IL-2 alone. Analyses repeated without subtracting the responses to IL-2 alone revealed the same patterns of IFN-γ responses: lack of correlation with the size of the TST response and decreased IFN-γ responses in tuberculosis and HIV-1 infection. IFN-γ in whole blood was detectable 3 days after culture, which is consistent with the findings of Garcia et al. [40], who detected IFN-γ after 4 days of stimulating PBMCs with IPP and IL-2. IFN-γ responses peaked when 50 μmol/L BrHPP was used, and significant responses were found in all healthy subjects in the United States.
Kabelitz et al. [46] demonstrated that a high frequency of peripheral-blood γδ T cells responded to mycobacteria in TST-negative subjects. Mycobacterial antigens were able to expand γδ T cells from TST-positive and TST-negative subjects and from 100% of newborns, suggesting germline-encoded recognition [47]. Vδ2+ T cells react to phosphoantigens from a variety of microorganisms [3, 48]. Lifelong exposure to microbial phosphoantigens likely is responsible for chronic stimulation of Vδ2+ T cells, their expansion as the immune system matures, and, thus, their ability to provide first-line defenses in response to pathogens such as M. tuberculosis.
In light of previous studies suggesting Vδ2+ T cell dysfunction in M. tuberculosis and HIV-1 infection, we investigated Vδ2+ T cell responses in the context of a comprehensive immunoepidemiological study of M. tuberculosis infection and disease in Kampala, Uganda, where HIV-1 infection and tuberculosis are endemic. In the present study, patients with tuberculosis and their household contacts were evaluated and followed prospectively for M. tuberculosis and HIV-1 infection as well as coprevalent and incident tuberculosis. Vδ2+ T cell responses among 85 HIV-1–negative household contacts were similar to those of healthy subjects in Cleveland, with a similar distribution of those with low, intermediate, and high IFN-γ responses. There was no correlation with the size of the TST response, providing in vivo evidence that Vδ2+ T cell function is independent of tuberculin reactivity and CD4+ T cells, because the TST response is largely a reflection of CD4+ T cell responses to M. tuberculosis proteins. There is a need for TST-independent measures of immune function in M. tuberculosis infection for the evaluation of future tuberculosis vaccines. The TST helps identify M. tuberculosis infection but does not imply protective innate or adaptive immunity.
Both tuberculosis and HIV-1 infection were independently associated with decreased Vδ2+ T cell function. HIV-1–positive patients with tuberculosis were the most immunocompromised. Previous studies of small numbers of subjects have suggested γδ T cell defects in either number, phenotype, or function in HIV-1–positive patients with tuberculosis, but the results have not been consistent. Some studies have suggested a reduction in Vδ2+ T cells [23, 25] without an alteration in the total number of γδ T cells in patients with tuberculosis, compared with that in healthy control subjects [20, 21]. Other studies have shown increases or no changes in the number of γδ T cells in peripheral blood in patients with tuberculosis [19]. However, γδ T cell expansion in response to M. tuberculosis [18, 21] or nonpeptidic antigens [24, 27] was generally lower in patients with tuberculosis. The results of the present study, in which IFN-γ was used as a surrogate, demonstrate decreased Vδ2+ T cell function in patients with tuberculosis.
The primary γδ T cell defect in HIV-1–positive patients is inversion of the ratio of Vδ2+/Vδ1+ γδ T cells due to increased Vδ1+ and decreased Vδ2+ circulating T cells [30, 49]. Decreased responses to M. tuberculosis or phosphoantigens also have been shown in HIV-1–positive patients [31, 44]. Our results demonstrate that, in an area where tuberculosis and HIV-1 infection are endemic, Vδ2+ T cell function is reduced by HIV-1 infection independent of tuberculosis. HIV-1 infection affects Vδ2+ T cell function primarily through depletion of CD4+ T cells but may also directly modulate Vδ2 T cells, and this is reversed by highly active antiretroviral therapy [44]. That HIV-1–positive patients with tuberculosis had the lowest responses also supports the premise that HIV-1 infection and tuberculosis act together to suppress Vδ2+ T cell function. Decreased Vδ2 T cell function in tuberculosis and HIV-1 infection could be the consequence of a functional defect at the single cell level or the result of a low number of Vδ2 T cells.
The availability of a simple and robust assay to directly measure Vδ2+ T cell function will allow further studies to determine more precisely the role that Vδ2+ T cells play in human innate and adaptive immunity against M. tuberculosis and HIV-1. Population-based studies will be able to determine if those with high and low Vδ2+ T cell responses differ in their risk for M. tuberculosis infection and disease, if decreased Vδ2+ T cell function in HIV-1–positive patients increases the risk for progression of M. tuberculosis infection, and if Vδ2+ T cell function changes during acute M. tuberculosis infection.
Acknowledgments
Financial support: National Institutes of Health (grants AI-27243 and HL-55967, contract AI-45244/95383 to the Tuberculosis Prevention and Control Research Unit, and contract AI-36219 to the Center for AIDS Research).
We thank Christian Belmant (Innate Pharma), for providing bromohydrin pyrophosphate; the medical officers, health visitors, and data personnel of the Uganda–Case Western Reserve University Collaboration in Kampala and the medical officers, nurses, and counselors at the National Tuberculosis Treatment Centre, Mulago Hospital, Kampala, for their invaluable contribution to this study; and Roy Mugerwa, Harriet Mayanja, and Alphonse Okwera, for their advice and guidance in the conduct of the Kawempe Community Study.
Footnotes
Presented in part: Keystone Symposium on Tuberculosis: Integrating Host and Pathogen Biology, 2–7 April 2005, Whistler, Canada.
Potential conflicts of interest: none reported.
References
- 1.Bottino C, Tambussi G, Ferrini S, et al. Two subsets of human T lymphocytes expressing gamma/delta antigen receptor are identifiable by monoclonal antibodies directed to two distinct molecular forms of the receptor. J Exp Med. 1988;168:491–505. doi: 10.1084/jem.168.2.491. [DOI] [PMC free article] [PubMed] [Google Scholar]
- 2.Carding SR, Egan PJ. Gammadelta T cells: functional plasticity and heterogeneity. Nat Rev Immunol. 2002;2:336–45. doi: 10.1038/nri797. [DOI] [PubMed] [Google Scholar]
- 3.Morita CT, Mariuzza RA, Brenner MB. Antigen recognition by γδ T cells: pattern recognition by the adaptive immune system. Springer Semin Immunopathol. 2000;22:191–217. doi: 10.1007/s002810000042. [DOI] [PubMed] [Google Scholar]
- 4.Chen ZW, Letvin NL. Vgamma2Vdelta2+ T cells and anti-microbial immune responses. Microbes Infect. 2003;5:491–8. doi: 10.1016/s1286-4579(03)00074-1. [DOI] [PMC free article] [PubMed] [Google Scholar]
- 5.Kabelitz D, Bender A, Prospero T, Wesselborg S, Janssen O, Pechhold K. The primary response of human gamma/delta T cells to Mycobacterium tuberculosis is restricted to Vgamma9-bearing cells. J Exp Med. 1991;173:1331–8. doi: 10.1084/jem.173.6.1331. [DOI] [PMC free article] [PubMed] [Google Scholar]
- 6.Dieli F, Sireci G, DiSano C, Champagne E, Fournie JJ, Salerno JI. Predominance of Vgamma9/Vdelta2 T lymphocytes in the cerebrospinal fluid of children with tuberculous meningitis: reversal after chemotherapy. Mol Med. 1999;5:301–12. [PMC free article] [PubMed] [Google Scholar]
- 7.Schwartz E, Shapiro R, Shina S, Bank I. Delayed expansion of V delta 2+ and V delta 1+ gamma delta T cells after acute Plasmodium falciparum and Plasmodium vivax malaria. J Allergy Clin Immunol. 1996;97:1387–92. doi: 10.1016/s0091-6749(96)70208-7. [DOI] [PubMed] [Google Scholar]
- 8.Constant P, Davodeau F, Peyrat MA, et al. Stimulation of human gamma delta T cells by nonpeptidic mycobacterial ligands. Science. 1994;264:267–70. doi: 10.1126/science.8146660. [DOI] [PubMed] [Google Scholar]
- 9.Lang F, Peyrat MA, Constant P, et al. Early activation of human V gamma 9V delta 2 T cell broad cytotoxicity and TNF production by nonpeptidic mycobacterial ligands. J Immunol. 1995;154:5986–94. [PubMed] [Google Scholar]
- 10.Tanaka Y, Sano S, Nieves E, et al. Nonpeptide ligands for human gamma delta T cells. Proc Natl Acad Sci USA. 1994;91:8175–9. doi: 10.1073/pnas.91.17.8175. [DOI] [PMC free article] [PubMed] [Google Scholar]
- 11.Morita CT, Lee HK, Leslie DS, Tanaka Y, Bukowski JF, Marker-Hermann E. Recognition of nonpeptide prenyl pyrophosphate antigens by human gammadelta T cells. Microbes Infect. 1999;1:175–86. [PubMed] [Google Scholar]
- 12.Belmant C, Espinosa E, Poupot R, et al. 3-formyl-1-butyl pyrophosphate: a novel mycobacterial metabolite activating human gammadelta T cells. J Biol Chem. 1999;274:32079–84. doi: 10.1074/jbc.274.45.32079. [DOI] [PubMed] [Google Scholar]
- 13.Espinosa E, Belmant C, Pont F, et al. Chemical synthesis and biological activity of bromohydrin pyrophosphate, a potent stimulator of human gamma delta T cells. J Biol Chem. 2001;276:18337–44. doi: 10.1074/jbc.M100495200. [DOI] [PubMed] [Google Scholar]
- 14.Rojas RE, Torres M, Fournie JJ, Harding CV, Boom WH. Phosphoantigen presentation by macrophages to Mycobacterium tuberculosis—reactive Vgamma9Vdelta2+ T cells: modulation by chloroquine. Infect Immun. 2002;70:4019–27. doi: 10.1128/IAI.70.8.4019-4027.2002. [DOI] [PMC free article] [PubMed] [Google Scholar]
- 15.Shen Y, Zhou D, Qiu L, et al. Adaptive immune response of Vgamma2Vdelta2+ T cells during mycobacterial infections. Science. 2002;295:2255–8. doi: 10.1126/science.1068819. [DOI] [PMC free article] [PubMed] [Google Scholar]
- 16.Zhou D, Lai X, Shen Y, et al. Inhibition of adaptive Vgamma2Vdelta2+ T-cell responses during active mycobacterial coinfection of simian immunodeficiency virus SIVmac-infected monkeys. J Virol. 2003;77:2998–3006. doi: 10.1128/JVI.77.5.2998-3006.2003. [DOI] [PMC free article] [PubMed] [Google Scholar]
- 17.Hoft DF, Brown RM, Roodman ST. Bacille Calmette-Guérin vaccination enhances human gamma delta T cell responsiveness to mycobacteria suggestive of a memory-like phenotype. J Immunol. 1998;161:1045–54. [PubMed] [Google Scholar]
- 18.Havlir DV, Ellner JJ, Chervenak KA, Boom WH. Selective expansion of human gamma delta T cells by monocytes infected with live Mycobacterium tuberculosis. J Clin Invest. 1991;87:729–33. doi: 10.1172/JCI115053. [DOI] [PMC free article] [PubMed] [Google Scholar]
- 19.Ito M, Kojiro N, Ikeda T, Ito T, Funada J, Kokubu T. Increased proportions of peripheral blood gamma delta T cells in patients with pulmonary tuberculosis. Chest. 1992;102:195–7. doi: 10.1378/chest.102.1.195. [DOI] [PubMed] [Google Scholar]
- 20.Balbi B, Tazi A, Bouchonnet F, et al. Characterization of gamma/delta T-lymphocytes in the peripheral blood of patients with active tuberculosis: a comparison with normal subjects and patients with sarcoidosis. Am Rev Respir Dis. 1992;146:1216–21. doi: 10.1164/ajrccm/146.5_Pt_1.1216. [DOI] [PubMed] [Google Scholar]
- 21.Barnes PF, Grisso CL, Abrams JS, Band H, Rea TH, Modlin RL. Gamma delta T lymphocytes in human tuberculosis. J Infect Dis. 1992;165:506–12. doi: 10.1093/infdis/165.3.506. [DOI] [PubMed] [Google Scholar]
- 22.Ueta C, Tsuyuguchi I, Kawasumi H, Takashima T, Toba H, Kishimoto S. Increase of gamma/delta T cells in hospital workers who are in close contact with tuberculosis patients. Infect Immun. 1994;62:5434–41. doi: 10.1128/iai.62.12.5434-5441.1994. [DOI] [PMC free article] [PubMed] [Google Scholar]
- 23.Li B, Rossman MD, Imir T, et al. Disease-specific changes in gamma delta T cell repertoire and function in patients with pulmonary tuberculosis. J Immunol. 1996;157:4222–9. [PubMed] [Google Scholar]
- 24.Gioia C, Agrati C, Casetti R, et al. Lack of CD27-CD45RA-V gamma 9V delta 2+ T cell effectors in immunocompromised hosts and during active pulmonary tuberculosis. J Immunol. 2002;168:1484–9. doi: 10.4049/jimmunol.168.3.1484. [DOI] [PubMed] [Google Scholar]
- 25.Carvalho AC, Mattelli A, Airo P, et al. Gammadelta T lymphocytes in the peripheral blood of patients with tuberculosis with and without HIV co-infection. Thorax. 2002;57:357–60. doi: 10.1136/thorax.57.4.357. [DOI] [PMC free article] [PubMed] [Google Scholar]
- 26.Szereday L, Baliko Z, Szekeres-Bartho J. Gamma/delta T cell subsets in patients with active Mycobacterium tuberculosis infection and tuberculin anergy. Clin Exp Immunol. 2003;131:287–91. doi: 10.1046/j.1365-2249.2003.02063.x. [DOI] [PMC free article] [PubMed] [Google Scholar]
- 27.Gioia C, Agrati C, Goletti D, et al. Different cytokine production and effector/memory dynamics of alpha beta+ or gamma delta+ T-cell subsets in the peripheral blood of patients with active pulmonary tuberculosis. Int J Immunopathol Pharmacol. 2003;16:247–52. doi: 10.1177/039463200301600310. [DOI] [PubMed] [Google Scholar]
- 28.De Paoli P, Gennari D, Martelli P, et al. A subset of gamma-delta lymphocytes is increased during HIV-1 infection. Clin Exp Immunol. 1991;83:187–91. doi: 10.1111/j.1365-2249.1991.tb05612.x. [DOI] [PMC free article] [PubMed] [Google Scholar]
- 29.Gan YH, Pauza CD, Malkovsky M. Gamma delta T cells in rhesus monkeys and their response to simian immunodeficiency virus (SIV) infection. Clin Exp Immunol. 1995;102:251–5. doi: 10.1111/j.1365-2249.1995.tb03773.x. [DOI] [PMC free article] [PubMed] [Google Scholar]
- 30.Boullier S, Cochet M, Poccia F, Gougeon ML. CDR3-independent gamma delta V delta 1+ T cell expansion in the peripheral blood of HIV-infected persons. J Immunol. 1995;154:1418–31. [PubMed] [Google Scholar]
- 31.Poccia F, Boullier S, Lecoeur H, et al. Peripheral V gamma 9 V delta 2 T cell deletion and anergy to nonpeptidic mycobacterial antigens in asymptomatic HIV-1 infected persons. J Immunol. 1996;157:449–61. [PubMed] [Google Scholar]
- 32.Wallace M, Bartz SR, Chang WL, Mackenzie DA, Pauza CD, Malkovsky M. Gamma delta T lymphocyte responses to HIV. Clin Exp Immunol. 1996;103:177–84. doi: 10.1046/j.1365-2249.1996.d01-625.x. [DOI] [PMC free article] [PubMed] [Google Scholar]
- 33.Wesch D, Kabelitz D, Friese K, Pechhold K. Mycobacteria-reactive gamma delta T cells in HIV-infected individuals: lack of V gamma 9 cell responsiveness is due to deficiency of antigen-specific CD4 T helper type 1 cells. Eur J Immunol. 1996;26:557–62. doi: 10.1002/eji.1830260309. [DOI] [PubMed] [Google Scholar]
- 34.Poccia F, Battistini L, Cipriani B, et al. Phosphoantigen-reactive Vγ9Vδ2 T lymphocytes suppress in vitro human immunodeficiency virus type 1 replication by cell-released antiviral factors including CC chemokines. J Infect Dis. 1999;180:858–61. doi: 10.1086/314925. [DOI] [PubMed] [Google Scholar]
- 35.Johnson JL, Nyole S, Okwera A, et al. Instability of tuberculin and Candida skin test reactivity in HIV-infected Ugandans. The Uganda-Case Western Reserve University Research Collaboration. Am J Respir Crit Care Med. 1998;158:1790–6. doi: 10.1164/ajrccm.158.6.9803104. [DOI] [PubMed] [Google Scholar]
- 36.Hussain R, Kaleem A, Shahid F, et al. Cytokine profiles using whole-blood assays can discriminate between tuberculosis patients and healthy endemic controls in a BCG-vaccinated population. J Immunol Methods. 2002;264:95–108. doi: 10.1016/s0022-1759(02)00092-3. [DOI] [PubMed] [Google Scholar]
- 37.Stein CM, Guwatudde D, Nakakeeto M, et al. Heritability analysis of cytokines as intermediate phenotypes of tuberculosis. J Infect Dis. 2003;187:1679–85. doi: 10.1086/375249. [DOI] [PMC free article] [PubMed] [Google Scholar]
- 38.Elliot AM, Hurst TJ, Balyeku MN, et al. The immune response to Mycobacterium tuberculosis in HIV-infected and uninfected adults in Uganda: application of a whole blood cytokine assay in an epidemiological study. Int J Tuberc Lung Dis. 1999;3:239–47. [PubMed] [Google Scholar]
- 39.Guwatudde D, Nakakeeto M, Jones-Lopez EC, et al. Tuberculosis in household contacts of infectious cases in Kampala, Uganda. Am J Epidemiol. 2003;158:887–98. doi: 10.1093/aje/kwg227. [DOI] [PMC free article] [PubMed] [Google Scholar]
- 40.Garcia VE, Sieling PA, Gong J, et al. Single-cell cytokine analysis of gamma delta T cell responses to nonpeptide mycobacterial antigens. J Immunol. 1997;159:1328–35. [PubMed] [Google Scholar]
- 41.Tsukaguchi K, de Lange B, Boom WH. Differential regulation of IFN-gamma, TNF-alpha, and IL-10 production by CD4+ alphabeta TCR+ T cells and vdelta2+ gammadelta T cells in response to monocytes infected with Mycobacterium tuberculosis-H37Ra. Cell Immunol. 1999;194:12–20. doi: 10.1006/cimm.1999.1497. [DOI] [PubMed] [Google Scholar]
- 42.Wang L, Das H, Kamath A, Bukowski JF. Human V gamma 2V delta 2 T cells produce IFN-gamma and TNF-alpha with an on/off/on cycling pattern in response to live bacterial products. J Immunol. 2001;167:6195–201. doi: 10.4049/jimmunol.167.11.6195. [DOI] [PubMed] [Google Scholar]
- 43.Dieli F, Troye-Blomberg M, Ivanyi J, et al. Vgamma9/Vdelta 2 T lymphocytes reduce the viability of intracellular Mycobacterium tuberculosis. Eur J Immunol. 2000;30:1512–9. doi: 10.1002/(SICI)1521-4141(200005)30:5<1512::AID-IMMU1512>3.0.CO;2-3. [DOI] [PubMed] [Google Scholar]
- 44.Martini F, Urso R, Gioia C, et al. Gamma-delta T-cell anergy in human immunodeficiency virus-infected persons with opportunistic infections and recovery after highly active antiretroviral therapy. Immunology. 2000;100:481–6. doi: 10.1046/j.1365-2567.2000.00068.x. [DOI] [PMC free article] [PubMed] [Google Scholar]
- 45.Friedland JS, Hartley JC, Hartley CG, Shattock RJ, Griffen GE. Cytokine secretion in vivo and ex vivo following chemotherapy of Mycobacterium tuberculosis infection. Trans R Soc Trop Med Hyg. 1996;90:199–203. doi: 10.1016/s0035-9203(96)90141-8. [DOI] [PubMed] [Google Scholar]
- 46.Kabelitz D, Bender A, Schondelmaier S, Schoel B, Kaufmann SH. A large fraction of human peripheral blood gamma/delta + T cells is activated by Mycobacterium tuberculosis but not by its 65-kD heat shock protein. J Exp Med. 1990;171:667–79. doi: 10.1084/jem.171.3.667. [DOI] [PMC free article] [PubMed] [Google Scholar]
- 47.Panchamoorthy G, McLean J, Modlin RL, et al. A predominance of the T cell receptor V gamma 2/V delta 2 subset in human mycobacteria-responsive T cells suggests germline gene encoded recognition. J Immunol. 1991;147:3360–9. [PubMed] [Google Scholar]
- 48.Fournie JJ, Bonneville M. Stimulation of gamma delta T cells by phosphoantigens. Res Immunol. 1996;147:338–47. doi: 10.1016/0923-2494(96)89648-9. [DOI] [PubMed] [Google Scholar]
- 49.Autran B, Triebel F, Katlama C, Rozembaum W, Hercend T, Debre P. T cell receptor gamma/delta+ lymphocyte subsets during HIV infection. Clin Exp Immunol. 1989;75:206–10. [PMC free article] [PubMed] [Google Scholar]