Abstract
Four extraction methods, including a novel one, were compared for their efficiencies in producing DNA from three contrasting agricultural soils. Molecular analyses (PCR-denaturing gradient gel electrophoresis [DGGE] and clone libraries) focusing on different microbial groups were used as assessment criteria. Per soil, the DNA yields differed between extraction methods. Clear effects of method on apparent richness and community structure were found. Actinobacterial diversity based on soil DNA produced by two divergent methods revealed that a hitherto-undescribed group was obtained by the novel method.
Analyses of directly extracted soil DNA should reliably depict the microbial diversity and community composition (6) of soil, which implies that any biases originating from less-efficient cell extraction and lysis (5) are to be avoided or minimized. All currently available soil DNA extraction methods (14) are prone to biases, which, however, are not always well characterized. The term “apparent soil microbial diversity and community structure” is used here to indicate the implicit uncertainties in soil DNA-based analyses (2, 4, 8, 12). To examine this further, we compared data sets obtained with four different extraction methods applied to three soils, enabling us to evaluate the different windows on soil microbial diversity offered by different methods, as related to soil type. The four methods were the International Center for Tropical Agriculture (CIAT) (C) method, the method of Smalla et al. (14) (S), the MioBio Ultraclean (U) method, and the Powersoil (P) method. Of these, the S (14) and C methods (12, 13, 16) would be called traditional methods, whereas the U and P methods are kit based. Two sandy soils, Buinen (B) and Valthermond (V), with low versus high organic matter (OM) content, and a clayey soil, Kollumerwaard (K), were included (see Table S1 in the supplemental material). All soil samples were freshly obtained from agricultural fields. Topsoil (0 to 12 cm) was collected from triplicate subplots that had been preestablished in a randomized design for each soil (Table S1); 3 to 5 50-g samples per subplot were mixed into one homogenized composite sample in a plastic bag. DNA extractions were performed on subsamples of 2.5 g soil. Method S was used as described in reference 14 and is briefly described in the supplemental material. For methods U and P, we followed the manufacturer's descriptions, with modifications as outlined in the supplemental material. Method C was a strongly modified version of the method of Zhou et al. (17), as detailed in the supplemental material. Briefly, it consisted of an initial soil wash followed by gentle enzymatic lysis and subsequent purification steps. On the basis of the soil DNA, PCR amplifications targeting the 16S rRNA genes of total bacteria and actinobacteria were run. We further ran amplifications targeting archaea, betaproteobacteria, betaproteobacterial ammonia oxidizers, and pseudomonads (see the supplemental material). The specifics of these PCR systems and denaturing gradient gel electrophoresis (DGGE) running conditions have been described previously (1, 3, 7, 9-11) and are summarized in Table S2 in the supplemental material. Finally, DNA extracted from the V soil with either the P or the C extraction method was used to generate actinobacterial 16S rRNA gene clone libraries by an established protocol (10), using primer 243F (Table S2). Amplicon cloning was carried out using the pGEM-T Easy vector system (Promega, Madison, WI), and analyses of the sequences and subsequent data treatment proceeded as described in the supplemental material.
Soil DNA yield.
For each soil, the extraction method clearly determined the DNA yield (Table 1). All soil DNA extracts prepared by the U method contained 200 to 250 ng g−1 dry soil; these were omitted from further analyses. Yields obtained from soil K were similar across methods and lower than those from the other soils. In contrast, method P gave the highest DNA yields for soils B and V (14.6 to 16.5 μg g−1 dry soil), whereas methods S and C yielded significantly smaller amounts for these soils (4.5 to 5.3 and 1.1 to 5.3, respectively) (Table 1). Also, across all soils, there was a trend in the average size of the DNA produced: method S yielded DNA fragments of 9 to 11 kb, method P yielded fragments of 16 to 20 kb, and method C yielded fragments of 30 to 36 kb. For further details, see the supplemental material.
TABLE 1.
Yield and apparent purity of DNA extracted from three different soilsa
| Soil and methodb | Yield (μg/g dry soil) | OD260/OD280c |
|---|---|---|
| B | ||
| S | 4.54 ± 0.62 | 1.0 |
| P | 14.58 ± 0.58 | 1.65 |
| C | 1.13 ± 0.15 | 1.22 |
| V | ||
| S | 6.33 ± 1.86 | 1.4 |
| P | 16.45 ± 3.97 | 1.6 |
| C | 5.25 ± 2.42 | 1.5 |
| K | ||
| S | 3.30 ± 1.45 | 1.6 |
| P | 2.69 ± 0.08 | 1.72 |
| C | 2.29 ± 0.79 | 1.7 |
The Ultraclean (U) method yielded 200 to 250 ng/g soil throughout. Triplicate samples obtained from three plots were analyzed.
Soils: B, Buinen; V, Valthermond; and K, Kollumerwaard. Methods: S, Smalla et al. (14); P, Powersoil (MoBio); C, CIAT (described in this study; see the supplemental material).
OD260/OD280, optical density at 260 nm over that at 280 nm.
PCR-DGGE community fingerprintings.
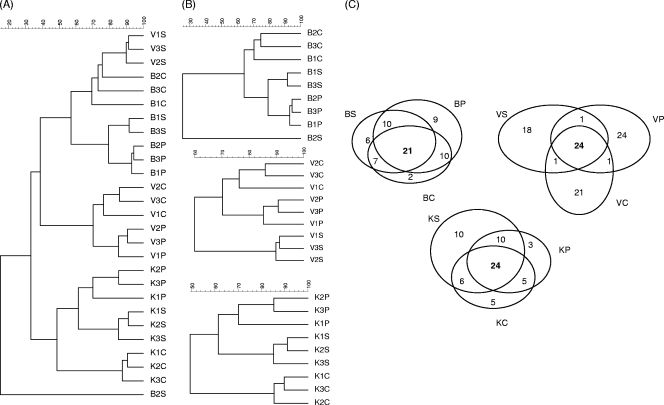
Using PCR-DGGE, we analyzed the soil microbial communities across various bacterial/archaeal groups and here report on the bacterial and actinobacterial communities. See the supplemental material for analyses of Betaproteobacteria, Archaea, Betaproteobacterial ammonium oxidizers, and Pseudomonas (Fig. S1 and S2). The band numbers (apparent richness) across the bacterial DGGE patterns ranged from 42 to 61 in the three soils across the extraction methods (Table 2). Soil DNA extraction method did not significantly affect the apparent richness per soil (P < 0.05). However, method P gave the highest values for soils B and V, as compared to methods S and C. For the K soil, method P gave intermediate values. These observations were corroborated by the PCR-DGGE pattern-derived diversity (H′) values (see Table S3 in the supplemental material). Analysis of all patterns revealed that soil was the overriding factor that determined clustering (Fig. 1A). The effect was significant and was corroborated by redundancy (RDA) analysis of all patterns across soils and methods (not shown). Grossly, three major clusters were determined by soil (K, B, and V), the exception being formed by one of three sets of V soil patterns (S method), which clustered in the B soil cluster. Within the clusters, with one exception, a consistent further grouping along extraction method was observed (Fig. 1B). The tree topologies (i.e., the extent to which the patterns for each extraction method clustered close to those for other methods) differed per soil, as shown in Fig. 1B. The effects of the DNA extraction methods on the apparent soil bacterial community structures are further illustrated in Venn diagrams (Fig. 1C). Although, for each soil, high numbers of common bands were generally found (21 to 24 bands), each method revealed method-specific bands. This was particularly important in the V soil, where method P revealed 24 method-specific bands, method C revealed 21 method-specific bands, and method S revealed 18 method-specific bands, versus 24 shared bands. For soil B (21 shared bands), method P also yielded the highest number of method-specific bands (9) in comparison to the C and S methods (2 and 6 bands, respectively). Although soil K (24 shared bands) revealed higher band numbers with method P than with method C, the numbers of method-specific bands were low (3 and 5). In this case, method S produced more method-specific bands than the other methods (10).
TABLE 2.
Apparent richnessa of microbial communities based on PCR-DGGE analysis
| Group | Apparent richness by soil-method combinationb: |
||||||||
|---|---|---|---|---|---|---|---|---|---|
| B-C | B-S | B-P | V-C | V-S | V-P | K-C | K-S | K-P | |
| Bacteria | 48 ± 2.5 | 47 ± 2.3 | 51 ± 6.4 | 53 ± 2.7 | 53 ± 6.1 | 61 ± 8.1 | 42 ± 1 | 57 ± 5.2 | 50 ± 5.4 |
| Betaproteobacteria | 43 ± 2.7 | 46 ± 3.1 | 52 ± 3.1 | 45 ± 5.5 | 42 ± 4.6 | 51 ± 1.2 | 49 ± 1 | 47 ± 3 | 57 ± 2.5 |
| Pseudomonas | 18 ± 7.5 | 20 ± 6.5 | 28 ± 2 | 12 ± 5.7 | 15 ± 7.7 | 51 ± 1.2 | 21 ± 3 | 47 ± 3 | 25 ± 2 |
| Actinobacteria | 63 ± 11.9 | 61 ± 13.2 | 42 ± 6.2 | 47 ± 9.5 | 50 ± 9.0 | 44 ± 0.6 | 36 ± 2.6 | 37 ± 0 | 35 ± 2.7 |
| Ammonium oxidizers | 4 ± 1.5 | 4 ± 0.6 | 3 ± 0.6 | 2 ± 2.0 | 3 ± 2.0 | 4.7 ± 0.6 | 4 ± 1.2 | 3.3 ± 3.2 | 3.3 ± 2.9 |
| Archaea | 5 ± 2 | 5 ± 1 | 6 ± 0.6 | 6 ± 1.3 | 4 ± 0.6 | 4 ± 1.7 | 2 ± 0.6 | 3 ± 1 | 4 ± 1 |
Band numbers were used to estimate the richness of dominant types within the target microbial groups.
Soils: B, Buinen; V, Valthermond; and K, Kollumerwaard. Methods: S, Smalla et al. (14); P, Powersoil (MoBio); and C, CIAT (described in this study, see the supplemental material).
FIG. 1.
Assessment of bacterial communities in three agricultural soils as determined by PCR-DGGE analyses on the basis of three extraction methodologies: Smalla et al. (14) (S), Powersoil (P), and CIAT (C). Soils: Buinen (B), Valthermond (V), and Kollumerwaard (K). (A) Overall unweighted-pair group method using average linkages (UPGMA)-based clustering analysis. (B) UPGMA clustering per soil. (C) Venn diagrams indicating numbers of shared and method-specific bands across different soils. Letters above, below, and next to the circles indicate the soil and extraction method. Numbers in the circles and in the intercepts indicate numbers of method-specific and shared bands, respectively. The diagrams were generated by establishing the number of bands based on the presence of particular bands in at least two (+) or less than 2 (−) replicates per soil.
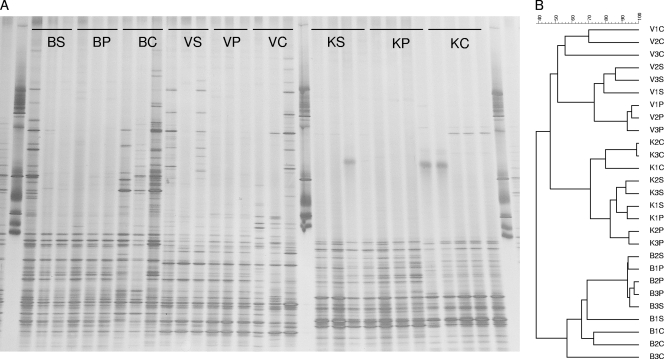
The apparent richness among the actinobacteria was also high in all soils (Fig. 2; Table 2), ranging from 35 to 63 across all PCR-DGGE patterns. There was no significant difference between the extraction methods in any of the soils. For the B and V soils, method C showed the highest H′ values and method P the lowest (see Table S3 in the supplemental material). Hence, a larger diversity of actinobacterial types was evidenced by method C than by the other methods. In contrast, for soil K no differences in these values were observed between the methods. Close examination of these patterns showed 1 or 2 unique bands in the method C-derived K soil patterns, which also indicated the emergence of novel actinobacterial targets.
FIG. 2.
Assessment of actinobacterial communities in three agricultural soils as determined by PCR-DGGE analyses on the basis of three extraction methodologies: Smalla et al. (S), Powersoil (P), and CIAT (C). Soils: Buinen (B), Valthermond (V), and Kollumerwaard (K). (A) Original DGGE gel; (B) cluster analyses of DGGE patterns generated with UPGMA.
Analysis of actinobacterial clone libraries.
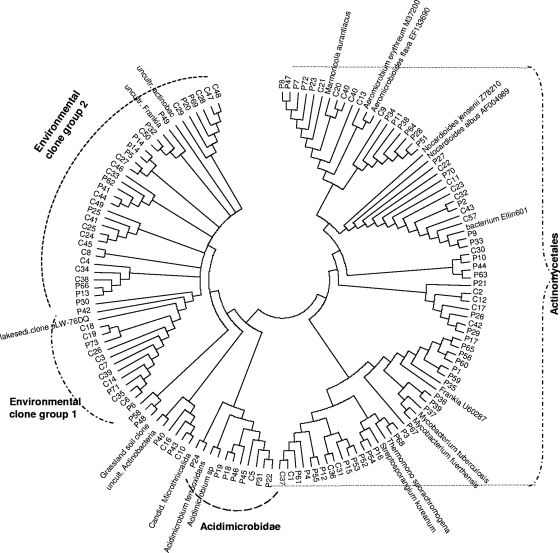
The apparent actinobacterial diversities were cross-compared in clone libraries constructed from V soil DNA on the basis of the C and P extraction methods (Fig. 3). Fifty and 73 clones were obtained from soil DNA produced by the C and P methods, respectively. Unifrac analysis revealed the two clone libraries were significantly different from each other (P < 0.01). BLAST-N analysis showed that a 38-amplicon group derived from DNA generated by both methods fell in the Nocardioidaceae (Fig. 3). In contrast, members of the suborder Frankineae were only detected by method P. Two clusters with novel sequences, denoted environmental clone groups 1 and 2 (EC1 and -2) were observed. EC1 was predominantly obtained from DNA generated with the C method (Fig. 3), whereas EC2 contained sequences obtained by both extraction methods. While the Ribosomal Database Project (RDP) Classifier (15) classified six of the 9 sequences of EC1 as unclassified Actinomycetales, the remaining three appeared as unclassified Actinobacteria. The sequences from this group showed the closest BLAST-N matches with soil clones from geographically disparate locations in, e.g., Germany and California, with matches ranging from 94 to 98% (Fig. 3).
FIG. 3.
Actinobacterial clones generated from DNA extracted from Valthermond soil (V) and Powersoil (P) and DNA extracted by the CIAT (C) method. Neighbor-joining dendrogram of 16S rRNA gene sequences amplified from V soil DNA with actinobacterial primers. The tree was constructed using the Kimura two-parameter algorithm (complete deletion model). Nodal support in neighbor joining was evaluated by 1,000 bootstrap replications. The accession numbers of the closest BLAST-N matches are listed.
Concluding remarks.
This study revealed that DNA extraction method strongly affects the apparent soil diversity and community structure as visualized by PCR-DGGE and clone library analyses. Each extraction method revealed a different subset of the extant bacterial diversity; the window offered at the total diversity depended on soil, the group targeted, and/or the amplification system used. Method P often yielded large amounts of DNA, and PCR-DGGE patterns revealed high apparent bacterial diversities. Across 18 soil-amplification system combinations, patterns based on P method DNA revealed the highest H′ values 11 times and the highest apparent richness values 10 times. On the other hand, method C appeared suitable for the extraction of actinobacteria, including novel groups (Fig. 3) which might go unnoticed by other methods.
Nucleotide sequence accession numbers.
All sequences have been deposited in the GenBank database under accession no. GU202297 to GU202419.
Supplementary Material
Acknowledgments
This work was supported by an NWO-ERGO project awarded to J.D.V.E. The NATO Science for Peace Program (ESP.EAP.CLG 981785) also provided support for some of the experiments.
Leo van Overbeek's role in guiding the work and Alexander V. Semenov's help with the Venn diagrams are acknowledged.
Footnotes
Published ahead of print on 26 March 2010.
Supplemental material for this article may be found at http://aem.asm.org/.
REFERENCES
- 1.Bano, N., and J. Hollibaugh. 2002. Phylogenetic composition of bacterioplankton assemblages from the Arctic Ocean. Appl. Environ. Microbiol. 68:505-518. [DOI] [PMC free article] [PubMed] [Google Scholar]
- 2.Burgmann, H., M. Pesaro, F. Widmer, and J. Zeyer. 2001. A strategy for optimizing quality and quantity of DNA extracted from soil. J. Microbiol. Methods 45:7-20. [DOI] [PubMed] [Google Scholar]
- 3.Cunliffe, M., and M. Kertesz. 2006. Effect of Sphingobium yanoikuyae B1 inoculation on bacterial community dynamics and polycyclic aromatic hydrocarbon degradation in aged and freshly PAH-contaminated soils. Environ. Pollut. 144:228-237. [DOI] [PubMed] [Google Scholar]
- 4.Duarte, G., A. Rosado, L. Seldin, A. Wolters, and J. D. van Elsas. 1998. Extraction of ribosomal RNA and genomic DNA from soil for studying the diversity of the indigenous bacterial community. J. Microbiol. Methods 32:21-29. [Google Scholar]
- 5.Frostegard, A., S. Courtois, V. Ramisse, S. Clerc, D. Bernillon, F. L. Gall, and P. Simonet. 1999. Quantification of bias related to the extraction of DNA directly from soil. Appl. Environ. Microbiol. 65:5409-5420. [DOI] [PMC free article] [PubMed] [Google Scholar]
- 6.Gelsomino, A., A. Keijzer-Wolters, G. Cacco, and J. D. van Elsas. 1999. Assessment of bacterial community structure in soil by PCR and DGGE. J. Microbiol. Methods 38:1-15. [DOI] [PubMed] [Google Scholar]
- 7.Kowalchuk, G., J. Stephen, W. de Boer, J. Prosser, T. Embley, and J. Woldendorp. 1997. Analysis of ammonia-oxidizing bacterial of the β subdivision of the class Proteobacteria in coastal sand dunes by DGGE and sequencing of PCR-amplified 16S ribosomal DNA fragements. Appl. Environ. Microbiol. 63:1489-1497. [DOI] [PMC free article] [PubMed] [Google Scholar]
- 8.Krsek, M., and E. Wellington. 1999. Comparison of different methods for the isolation and purification of total community DNA from soil. J. Microbiol. Methods 39:1-16. [DOI] [PubMed] [Google Scholar]
- 9.Miller, D., J. Bryant, E. Madsen, and W. Ghiorse. 1999. Evaluation and optimization of DNA extraction and purification procedures for soil and sediment samples. Appl. Environ. Microbiol. 65:4715-4724. [DOI] [PMC free article] [PubMed] [Google Scholar]
- 10.Monciardini, P., M. Sosio, L. Cavaletti, C. Chiocchini, and S. Donadio. 2002. New PCR primers for the selective amplification of 16S rDNA from different groups of actinomycetes. FEMS Microbiol. Ecol. 42:419-429. [DOI] [PubMed] [Google Scholar]
- 11.Muyzer, G., S. Hottentrager, A. Teske, and C. Wawer. 1995. Denaturing gradient gel electrophoresis of PCR-amplified 16S rDNA. A molecular new approach to analyze the genetic diversity of mixed microbial communities, p. 3.4.4. In A. Akkermans, J. van Elsas, and F. D. Bruijn (ed.), Molecular microbial ecology manual. Kluwer Academic Publishers, Dordrecht, Netherlands.
- 12.Robe, P., R. Nalin, C. Capellano, T. Vogel, and P. Simonet. 2003. Extraction of DNA from soil. Eur. J. Soil Biol. 39:183-190. [Google Scholar]
- 13.Roose-Amsaleg, C., and G. Sillam. 2001. Extraction and purification of microbial DNA from soil and sediment samples. Appl. Soil Ecol. 18:47-60. [Google Scholar]
- 14.Smalla, K., N. Creswell, L. Mendonca, and J. D. van Elsas. 1993. Rapid DNA extraction protocol from soil for PCR-mediated amplification. J. Appl. Bacteriol. 74:78-85. [Google Scholar]
- 15.van Elsas, J. D., and M. Rutgers. 2006. Estimating soil microbial diversity and community composition, p. 183-187. In J. Bloem, D. Hopkins, and A. Benedetti (ed.), Microbiological methods for assessing soil quality. CABI Publishing, Wallingford, United Kingdom.
- 16.van Elsas, J. D., K. Smalla, and C. Tebbe. 2000. Extraction and analysis of microbial community nucleic acids from environmental matrices, p. 29-51. In J. Jannson, J. van Elsas, and M. Bailey (ed.), Tracking genetically engineered microorganisms. Landes Bioscience, Austin, TX.
- 17.Zhao, F., J. Wu, and S. McGrath. 1996. Soil organic sulphur and its turnover, p. 467-506. In A. Piccolo (ed.), Humic substances in terrestrial ecosystems. Elsevier, Amsterdam, Netherlands.
Associated Data
This section collects any data citations, data availability statements, or supplementary materials included in this article.


