

Abstract
Most procedures for detecting pathogens in liquid media require an initial concentration step. However, poor recovery efficiencies of conventional methods, such as filtration, often lead to low sensitivity. Here, we describe a strategy for concentrating bacteria using their binding affinity for an oligoacyllysine (OAK), a novel peptide-mimetic antimicrobial compound. We show that the resin-linked OAK (ROAK) efficiently captures a variety of pathogens in different media, upon brief incubation with ROAK beads or after continuous flow through a ROAK-packed column. Using Escherichia coli expressing green fluorescent protein, we show that binding occurs rapidly during incubation and persists after filtration as visualized by confocal microscopy. The high binding affinity of bacteria was confirmed by surface plasmon resonance technology using an OAK-linked chip. ROAK-bound bacteria remained viable and were readily identifiable by real-time PCR after ethanol elution. A single ROAK bead is estimated to capture about 3,000 bacterial cells in culture medium, in contaminated saline or tap water. ROAK beads can be regenerated for multiple uses after brief ethanol treatment. Collectively, the data support the notion that OAK-based coating of polymeric surfaces might represent a useful means for medium filtration as well as for concentration of bacteria.
The first step in detection of waterborne pathogens is usually concentration. Concentration is necessary because the ambient densities of pathogens in water are usually less than the limit of detection, and concentrating large volumes may compensate for spatial and temporal variations in pathogen occurrence. The membrane filter (MF) technique is usually the method of choice for the analysis of total coliforms or of specific pathogens from potable water. The MF method is rapid and simple and yields definitive results. However, factors such as elevated turbidity (23) and membrane filter type (25, 33) may severely influence the sensitivity of the procedure.
Recently, there has been an emphasis on the development of high-throughput assays using, for example, real-time PCR (RT-PCR), microarrays, or immunofluorescent methods. However, these rapid procedures usually require extensive sample preparation steps (3, 4, 13, 36, 39, 40), including concentration. Microorganisms can be concentrated and separated from their constituent matrix components in a number of ways (1, 14): Whole bacterial cells have been isolated from food using reagents such as hydroxyapatite (5). Antibodies coupled to magnetic beads were used to separate specific organisms from human fluids, food, and water and are widely used in different applications (8, 9, 18, 37). Novel methods for semispecific capture of microorganisms using cell surface-derived lectins and carbohydrates have been proposed (10, 24). Specific capture of Mycobacterium in milk was attempted using peptide conjugation to a polymer (34). Furthermore, antimicrobial peptides linked to surfaces were used for killing (20), immobilization (19), and detection (22) of bacteria. Similarly, semiautomated methods include an entire field-based process to lyse bacteria, purify and label nucleic acids, and detect organism signatures using microarrays (2). Also, work has been conducted to automate separation of DNA and whole cells from soils, sediments, food, and water (11, 12).
Despite the ongoing safety measures, microbial contamination of drinking water can put water consumers at risk even at low concentrations (15, 21). By the time that water analysis is carried out and the contamination is detected, the contaminated water will be well on its way to consumers. In addition, the small volume of sampled water (typically 100 ml) might not guarantee the safety of drinking water (15, 29). Ironically, even 100 ml water might be considered a large amount to analyze, as its concentration requires either a filtration or a centrifugation step(s), each bearing such drawbacks as problems linked to obstruction and/or use of heavy equipment, respectively (7). Emergence of new rapid detection methods is also linked to the development of new concentration methods. For example, immunological or PCR-based methods are used after an incubation step because of a minimal detection limit, which hampers the process of rapid detection (6). Moreover, the recovery efficiencies of conventional filtration methods are often low and variable because of parameters related to the water (i.e., turbidity, sediments, etc.), the bacteria (physical condition), and the filter (inhibition of microbial growth at grid lines, abnormal spreading of colonies, nonwetted areas, brittleness, severe wrinkling, and decreased recovery), all of which can lead to false-negative and poorly reproducible results (6, 7, 30). There is thus a need for rapid and robust methods for concentrating bacteria from large volumes of water with high and reproducible efficiency to detect and quantify pathogens. (21, 29, 30, 35).
Oligoacyllysines (OAKs) are a novel group of antimicrobial copolymers (27), composed of tandem repeats of acyllysines, designed to mimic the primary structure and function of natural antimicrobial peptides (AMPs). While not fully understood, the mode of bactericidal action of most AMPs is believed to proceed via a two-step mechanism involving an initial high-affinity interaction with a bacterial external membrane(s) followed by an internalization process that eventually leads to cell death. By linking the antimicrobial OAK to an inert resin, we hoped to be able to exploit one attribute (the binding affinity) and eliminate the other (the killing effect). To test this hypothesis, we produced various OAK derivatives covalently linked to a polystyrene-based resin via the C terminus. Presumably, this construct should restrain the ability of the resin-linked OAK (ROAK) to interact with internal targets but should not alter its properties of binding to superficial components of microbial cells.
The objective of this study is thus to evaluate the ability of the ROAK concept to address some of the above-mentioned flaws, using a two-step approach including (i) an initial structure-activity relationship study for selection of a prototypical construct for the evaluation of resin binding as an effective method for neutralizing bactericidal effects of OAKs while retaining capture capacity and (ii) evaluation of the potential application of ROAKs for quantitative capture and detection of bacteria.
MATERIALS AND METHODS
ROAK preparation.
Peptides and OAKs were synthesized by the solid-phase method (16) using 4-methylbenzhydrylamine resin with a diameter range of 50 to 100 μm (Novabiochem), applying the N-(9-fluorenyl)methoxycarbonyl (Fmoc) active ester chemistry as described previously (27). After synthesis, the resins were deprotected by incubation in dichloromethane-trifluoroacetic acid (50:50) for 15 min at room temperature, washed twice with dichloromethane and twice with ethanol, placed under vacuum for 3 h, and stored at −20°C. Prior to use the resin beads were washed with saline. Peptide and OAK sequences were verified postsynthesis after cleavage of an aliquot, followed by liquid chromatography-mass spectrometry (LC-MS) analysis. For antimicrobial assays the crude compounds were purified to chromatographic homogeneity in the range of >95% by reverse-phase high-performance liquid chromatography (HPLC) (LC-MS Alliance-ZQ Waters). HPLC runs were performed on a C18 column (Vydac) with a linear gradient of acetonitrile in water (1%/min); both solvents contained 0.1% trifluoroacetic acid. The purified compounds were subjected to mass spectrometry analysis in order to confirm their composition and stocked as lyophilized powder at −20°C. Prior to testing, fresh solutions were prepared in water, briefly vortexed, sonicated, centrifuged, and then diluted in the appropriate medium.
Bacterial strains.
Staphylococcus aureus ATCC 25923, Enterococcus faecalis (ATCC 29212), Escherichia coli ATCC 35218, and Vibrio cholerae serotype O1, biotype Inaba (ctxA+), were grown aerobically in Luria-Bertani broth (LB broth; Sigma Chemical Company, St. Louis, MO) at 37°C with shaking overnight (16 h).
Antibacterial assays.
Initial antibacterial screening was performed with four bacteria, Escherichia coli (ATCC 35218), Pseudomonas aeruginosa (ATCC 9027), Bacillus cereus (ATCC 11778), and Staphylococcus aureus (ATCC 25923), grown in LB medium. MICs were determined by microdilution susceptibility testing in 96-well plates as detailed elsewhere (28). Statistical data for each experiment were obtained from at least two independent assays performed in duplicate.
Capture assay.
For routine assays, various concentrations of bacteria in 500 μl LB were incubated in two-compartment test tubes separated by a 10-μm-cutoff membrane (Whatman polypropylene mesh VectaSpin Micro) with OAK-coated and uncoated beads (1.8 mg each). After 30 min of incubation at room temperature under shaking, the samples were centrifuged at 21,000 × g (5 min) to separate beads from unbound bacteria and further analyzed as follows. To assess bacterial binding to the beads, the original media and filtrates were subjected to direct counts using the Live/Dead BacLight kit (Invitrogen) and to serial 10-fold dilutions for plating on LB agar plates. Cell counts were determined after overnight incubation at 37°C using the drop plate method (three 20-μl drops onto LB agar plates). For kinetic studies, resins were incubated with 1 × 10⁶ CFU of E. coli in LB for up to 15 min, filtered after the indicated time periods, and then plated for CFU counting.
The depletion experiment was performed essentially as described above using successive incubation-filtration cycles. During each cycle, the resin was incubated with 1 × 10⁶ CFU of E. coli and filtered via centrifugation before being exposed again to another 1 × 10⁶ CFU.
ROAK column.
For column filtration, the ROAK beads (10 mg) were packed in a glass pipette (topped by fiberglass to secure the resin). Various volumes of contaminated tap water (containing 102 to 105 CFU of V. cholerae) were passed through the column at a flow rate of 50 ml/min. Bacteria were eluted with a solution of 70% ethanol in water (1.8 ml) passed through the column, collected into an Eppendorf microtube, and analyzed by real-time PCR (RT-PCR).
Real-time PCR detection of V. cholerae.
For DNA preparation, bacterial cells were eluted from the resin with 1.8 ml of a 70% ethanol suspension followed by addition of 60 μl of 3 M sodium acetate, incubated for 1 min in liquid nitrogen (or for 20 min at −80°C), and centrifuged (18,000 × g) for 15 min. The pellet was suspended in 20 μl dilute TE buffer (1 mM Tris in 0.1 EDTA, pH 8.0), and DNA was submitted to real-time PCR analysis as detailed below. Universal 16S rRNA primers were selected from a conserved bacterial region to give a PCR product of 180 bp (suitable-length product for real-time PCR). Primer sequences were as follows: UNI-F, 5′-AGGATTAGATACCCTGGTAGT-3′, and UNI-R, 5′-CGAATTAAACCACATGCTCCA-3′.
OmpW PCR primers were designed on the basis of the ompW sequence, uniquely present in V. cholerae, to generate amplicons of 588 bp from all V. cholerae strains (26). The species-specific primers were OmpW 1-5 F, 5′-CACCAAGAAGGTGACTTTATTGTG-3′, and OmpW 1-5 R, 5′-GGAAAGTCGAATTAGCTTCACC-3′.
Primers for the cholera toxin gene type A (ctxA) were selected to give a PCR product of 301 bp (32). Primer sequences are as follows: ctxA-F, 5′-CTCAGACGGGATTTGTTAGGCACG-3′, and ctxA-R, 5′-TCTATCTCTGTAGCCCCTATTACG-3′.
Confocal fluorescent microscopy.
To visualize bacterial binding, resins were incubated with 1 × 10⁶ CFU of green fluorescent protein (GFP)-labeled E. coli KL2 (pSMC2 in E. coli DH5α was kindly provided by R. Kolter, Harvard Medical School, Boston, MA) (38) for 30 min and then filtered by centrifugation as described above. Resin and filtrates were transferred to microscope slides and examined under a confocal fluorescent microscope (Nikon) using laser emission suitable for GFP (excitation, 485 nm; emission, 535 nm) before and after filtration.
Real-time bacterial binding using surface plasmon resonance (SPR) technology.
Purified resin-free OAK was immobilized on the CM5 sensor chip (BIAcore, Uppsala, Sweden) via the terminal carboxyl group using 2-(2-pyridinyldithio)ethaneamine (PDEA). Carboxyl activation was achieved as follows: 0.1 ml of 0.1 M morpholinoethanesulfonic acid (MES) buffer at pH 5.0 was used to solubilize 0.1 mg OAK. The solution was mixed with PDEA to a final concentration of 22 mM and with ethyl-3-(3-dimethylaminopropyl)-carbodiimide (EDC) to a final concentration of 13 mM, incubated for 1 h on ice, and then placed in a dialysis tube (floating in buffer) to remove the excess reagents. In parallel, a 1:1 solution (20 μl) of EDC [0.4 M 1-ethyl-3-(3-dimethylaminopropyl)-carbodiimide in water] and NHS (0.1 M N-hydroxysuccinimide in water) was injected at a flow rate of 10 μl/min, to activate the chip surface. Next, a 30-μl solution of cystamine was injected to introduce a disulfide group. The disulfides were reduced with 30 μl DTE (0.1 M dithioerythritol or dithiothreitol in 0.1 M sodium borate, pH 8.5). Next, the dialyzed OAK solution (60 μl containing 10 μg) was injected to immobilize the OAK while excess reactive groups on the chip were deactivated with a 40-μl solution of PDEA [20 mM 2-(2-pyridinyldithio)ethaneamine and 1 M NaCl in 0.1 M sodium acetate, pH 4.0].
Bacterial binding to the OAK was determined by surface plasmon resonance (SPR) using the optical biosensor system BIAcore 2000 (BIAcore, Uppsala, Sweden). The experimental procedure and data interpretation were performed essentially as described elsewhere (17). Briefly, to monitor bacterial binding, 100 μl of E. coli in saline (at 103, 104, 105, and 106 CFU/ml) was injected over the OAK-coated chip at a flow rate of 20 μl/min and collected (by an integrated sample collector) after each run. Aliquots from each run were plated on LB agar plates for enumeration after overnight incubation at 37°C. Bound bacteria were estimated by comparing the CFU counts before and after each run.
RESULTS
Structure-activity relationship study.
Because the octamer OAK derivative C12K-7α8 displayed potent bactericidal properties in a previous study (27), ROAK beads carrying this compound as well as a series of analogs were initially screened for bacterial binding abilities using the capture assay (depicted in Fig. 1). As shown in Table 1, when exposed to E. coli in LB medium, ROAK beads bearing the C12K-7α8 sequence were able to capture ∼103 CFU/mg ROAK. Deleting all the acyl residues, which resulted in a polylysine octamer, had no significant effect, including when the peptide sequence was elongated to include 15 residues, supporting the notion that bacterial capture is predominantly based on electrostatic interactions. Interestingly, however, deleting only the N-terminal lauryl reduced the number of bacteria captured (as well as reducing the antibacterial properties of the resin-free OAK), reflecting the importance of hydrophobicity. Indeed, replacing the aminocaprylic backbone with aminolauryl moieties generated an OAK (K-7α12) that was virtually devoid of antibacterial activity (MIC, >50 μM) but that displayed a 1,000-fold-higher bacterial binding capability (compared to C12K-7α8). This ROAK was subjected to further characterization.
FIG. 1.

ROAK design and experimental apparatus. Shown is the molecular structure of K-7α12 linked to a polystyrene bead. Underneath is a cartoon illustration of the capture experiment: bacteria (small circles) incubated with ROAK beads (large circles) were driven to translocate across the membrane by centrifugation.
TABLE 1.
Biophysical properties of OAKs and polylysines and their bacterial capture capacities
| Sequence | Designation | No. of residues | Qa | Hb | MIC (μM) for speciesc: |
Bound E. coli (CFU/mg resin)d | |||
|---|---|---|---|---|---|---|---|---|---|
| E. coli | P. aeruginosa | S. aureus | B. cereus | ||||||
| LK-cKcKcKcKcKcKcKa | C12K-7α8 | 16 | 8 | 47.5 | 3.1 | 6.2 | 50 | 12.5 | (1 ± 0.5) × 103 |
| KKKKKKKKa | Poly-K8 | 8 | 9 | 20 | >50 | >50 | >50 | >50 | (9 ± 1) × 102 |
| KKKKKKKKKKKKKKKa | Poly-K15 | 15 | 16 | 22 | >50 | >50 | >50 | >50 | (1 ± 0.6) × 103 |
| K-cKcKcKcKcKcKcKa | K-7α8 | 15 | 9 | 34 | >50 | >50 | >50 | >50 | (2 ± 0.6) × 102 |
| K-lKlKlKlKlKlKlKa | K-7α12 | 15 | 9 | 50 | >50 | >50 | >50 | >50 | (1 ± 0.3) × 106 |
Molecular charge at physiological pH.
Estimated hydrophobicity (percent acetonitrile eluent) as determined by reverse-phase HPLC.
Minimal concentration that induced 100% inhibition of proliferation after 24 h of incubation. Note that MICs of C12K-7α8 are from reference 27. Values represent the means from two independent experiments performed in duplicate (the absence of the standard deviation reflects consistency).
Bacterial binding assessed after 30 min of incubation as described in Materials and Methods. L, lauryl; K, lysyl; c, aminocaprilyl; l, aminolauryl; a, amide.
Characterization study.
Characterization of bacterial capture by the K-7α12 ROAK was carried out under both incubation and continuous-flow conditions. In the incubation assays, binding was initially assessed through direct and CFU counts of the original inoculated bacteria and the filtrates. Subsequently, a depletion experiment was performed to verify the binding capacity and efficiency. Ultimately, these experiments were repeated in the presence of different bacteria to determine specificity. Figure 2a depicts a representative experiment for the compounds listed in Table 1. Maximum load was observed with filtrates resulting from incubation with up to 106 bacteria/mg ROAK, but filtrates from a higher inoculum (107 and 108 bacteria/mg ROAK) displayed progressively lower binding proportions, reflecting gradual saturation. Bacterial binding was virtually abolished when OAK-free beads were used (data not shown) or with the use of ROAK beads where the lysine side chains were protected by a Boc [(tert-butyloxy)carbamate] group. The fact that bacterial binding occurred only with the deprotected form of the ROAK demonstrated that the process was specifically related to the OAK properties.
FIG. 2.

Characteristics of bacterial binding to K-7α12 ROAKs. (a) CFU count obtained from capture assay filtrates, after incubation with protected (gray bars) and deprotected (white bars) ROAKs, using the specified E. coli inocula. Error bars (a, c, d, and f) represent standard deviations from the means obtained from at least 4 independent experiments performed in duplicate. An absence of bars indicates consistency. Zero inoculum values indicate negative cultures (i.e., <10 CFU/ml). (b) Time dependence of E. coli capture. CFU count was determined in filtrates after incubation for the specified time periods with deprotected (squares) and protected (circles) ROAKs. K15 beads (triangles) were used as a control. (Inset) Low-concentration experiment comparing K15 (triangles) and the control resin (circles). (c) Depletion experiment to determine the capacity for binding to ROAK beads after repeated incubation/filtration cycles. Protected ROAKs (PR) were used for a one-cycle control experiment. (d) Assessment of binding specificity using protected (gray bars) and deprotected (white bars) ROAKs assayed as in panel a. E.c, E. coli; V.c., V. cholerae; E.f., E. faecalis; S.a., S. aureus. (e) Assessment of binding yield using direct counts of elevated numbers of bacteria before and after passage through ROAK beads. (f) Binding of bacterial communities. CFU counts from capture assay filtrates after incubation with protected (gray bars) and deprotected (white bars) ROAKs, using the specified inoculum of defined bacterial mix (E. coli, V. cholerae, E. faecalis, and S. aureus, at equal concentrations; nonstriped bars) or undefined microbial mix (treated sewage water; striped bars).
Bacterial binding was spontaneous and rapid using either polylysine (K15) or OAK-linked beads (Fig. 2b), although negative cultures (binding of 106 bacteria) were obtained only with ROAK beads after 60 s of incubation. No bacterial adhesion was recorded on the control resin beads even after 30 min of incubation.
The binding capacity of the ROAK was confirmed with a depletion experiment using consecutive incubation/filtration cycles (Fig. 2c), where negative cultures were obtained with filtrates resulting from the first two cycles whereas the third and fourth cycles yielded 7 × 10⁵ and 1 × 10⁶ CFU/ml, respectively, pointing to a gradual saturation of the ROAK binding sites. From the combined data (Fig. 2a and c), we estimate that 1 mg of ROAK (i.e., ∼300 beads with an average OAK density of 1.2 × 10¹² molecules/μm2) binds slightly more than 1 × 10⁶ CFU of E. coli.
The binding efficiency of the ROAK was determined with the use of the Live/Dead BacLight kit. Gradually increasing concentrations of E. coli were loaded on 1.8 mg of ROAK, and the binding yield was calculated by direct counts of the filtrate and the original inoculum (Fig. 2e). Note that filtrates with 100% binding did not contain any bacteria, but the other filtrates displayed up to 4% dead bacteria, similarly to the original suspension. Bacterial binding to ROAK was not specific to a given bacterial type, as adhesion levels were basically similar between typical Gram-positive (E. faecalis and S. aureus) and Gram-negative (E. coli and V. cholerae) bacteria (Fig. 2d). ROAK binding was measured using both defined (E. faecalis, S. aureus, E. coli, and V. cholerae) and undefined (sewage water after treatment) bacterial communities (Fig. 2f). In both systems the maximal bacterial load was 106 bacteria/mg ROAK. Bacterial binding could be visualized when using green fluorescent protein (GFP)-expressing E. coli as analyzed by fluorescence confocal microscopy. As shown in Fig. 3b, bacteria in the surrounding medium did not adhere to the control (protected) beads but clearly interacted with the ROAK beads (Fig. 3c), indicating that bacterial adhesion occurs prior to filtration. Bacteria remained attached to the ROAK after the filtration step as shown in Fig. 3d, consistent with high binding affinity. Ethanol treatment resulted in dissociation of the ROAK-bound bacteria (Fig. 3e), suggesting that ROAK beads can be readily recycled (as confirmed below).
FIG. 3.
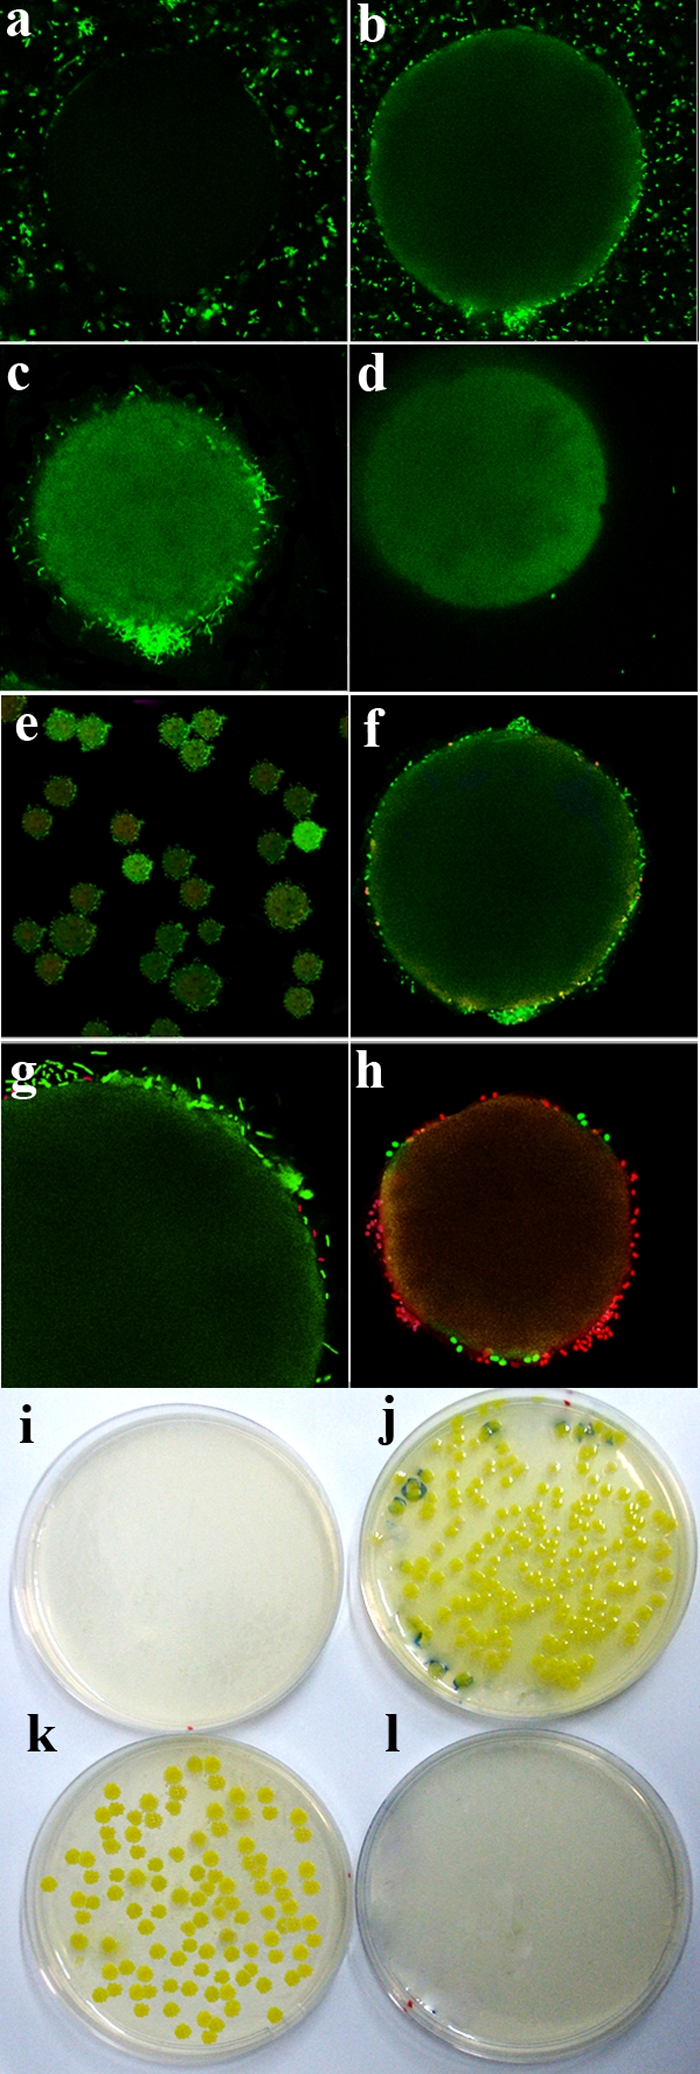
Visualization of ROAK-bound bacteria. (a to d) Representative fluorescence confocal microscopy images of GFP-expressing E. coli using the capture assay. (a) Protected (control) ROAK beads before filtration. (b to d) Deprotected ROAK bead before filtration (b), after filtration (c), and after 5 min of treatment with 70% ethanol (d). Note that the residual green color on the beads is likely to be generated from diffuse GFP emanating from ethanol-induced lysis of bacteria. (e to h) Representative images of ROAK-bound bacteria after propidium iodide treatment. (e) Low-magnification image. Green and red colors indicate live and dead bacteria, respectively. (f and g) Two successive zoom views that highlight a representative ROAK bead from panel e before treatment with bactericidal dermaseptin. (h) The same bead after treatment with bactericidal dermaseptin. (i to l) Bacterial capture and viability. Shown are CFU resulting from the capture assay followed by plating of beads (j and l) and filtrates (i and k) on LB agar using deprotected (i and j) and protected (k and l) beads.
Most ROAK-bound bacteria were alive, as shown in Fig. 3e, f, and g, and have excluded the dye propidium iodide. The fraction of dead bacteria (colored red) did not exceed that of a control suspension (up to 4% as assessed by the BacLight Live/Dead kit). This fraction significantly increased (Fig. 3h) upon exposure to the AMP dermaseptin, known for its rapid bactericidal properties (23). Further support for this notion is provided in Fig. 3i to l, showing bacterial growth on agar plates only on the OAK-linked resin. The opposite outcome was observed with the control resin.
Binding properties.
Bacterial binding under continuous-flow conditions was assessed with two different experimental settings using either surface plasmon resonance (SPR) or real-time PCR technologies, designed to corroborate the binding affinity and the potential usefulness of the ROAK concept, respectively.
For real-time monitoring of bacterial capture, we developed a model system based on the SPR technology that normally enables binding measurements between immobilized receptor molecules and soluble ligands (17, 31). Here, we immobilized the OAK onto the sensor chip, bacteria were injected over the OAK surface, and their binding was monitored online. Each experimental run included injection of a bacterial suspension of known concentration for 10 min immediately followed by a phosphate-buffered saline (PBS) wash step. Figure 4a shows that capped OAK did not retain bacteria while the K15-based chip was >100-fold less efficient than the OAK-linked chip (Fig. 4b). Thus, whereas bacteria rapidly accumulated/associated on the OAK-based chip surface throughout the injection stage, no bacterial release/dissociation was detected at the wash stage with the exception of the highest concentration tested (106 CFU/ml), where the wash step displayed some dissociation. This behavior is assumed to reflect saturation of the binding sites on the chip. To validate these data, each injected sample was collected at its exit from the chip compartment and plated for CFU count (Fig. 4c). The fact that bacteria were not detected up to 103 CFU/ml while only ∼10 CFU were counted when 104 or 105 CFU/ml was injected supports the notion that nearly 100% binding was obtained at these concentrations. Accordingly, the fact that about 90% binding was obtained when 106 CFU/ml was injected suggests that the chip maximal binding capacity was achieved at 105 CFU/ml, which is consistent with the sensorgram.
FIG. 4.

Assessment of bacterial binding using SPR technology. (a) Association/dissociation sensorgrams obtained for 106-CFU/ml suspensions of E. coli using chips coated with K15 (dashed and dotted line), K-7α12 (dashed line; full-scale sensorgram is shown below), and protected K-7α12 (solid line). (b) Dose dependence of E. coli binding to K-7α12-coated chip for suspensions containing 102, 103, 104, 105 (solid lines, form bottom to top), and 106 (dashed line) CFU/ml, displaying increasing response signals. Note that control experiments (bacteria injected over noncoated chip or saline injected over OAK or K15 chips) yielded a negligible resonance signal. (c) CFU counts obtained from collecting and plating each run shown in panel b. Error bars represent standard deviations from the means. An absence of bars indicates reproducibility.
To assess capture and concentrating capabilities in a continuous-flow system, we elected to mimic a diagnostic situation seeking detection of pathogenic V. cholerae. One liter of sterile saline inoculated with V. cholerae was passed through a ROAK-packed column. ROAK-bound bacteria were eluted from the column with 1.8 ml ethanol, which was subjected to DNA analysis by real-time PCR. Each RT-PCR run of the eluted bacteria was confirmed with a control run with the same bacterial concentration, i.e., an RT-PCR run of 104 V. cholerae bacteria in 1 liter after elution from the ROAK column with 1.8 ml ethanol was confirmed with an RT-PCR run of 104 V. cholerae bacteria in 1.8 ml saline (data not shown). As shown in Fig. 5a to c, positive identification was obtained with a concentration as low as 10 CFU/100 ml saline using universal 16S RNA primers (Fig. 5a), whereas positive identification was obtained at a slightly higher bacterial concentration (100 CFU/100 ml) when specific primers (ompW and ctx) were used for V. cholerae (Fig. 5b and c, respectively).
FIG. 5.

Real-time PCR amplification for the detection of V. cholerae O1. (a to c) V. cholerae O1 (102 to 104 cells) in 1 liter saline was run through a ROAK-packed column and eluted with 1.8 ml 70% ethanol. After DNA extraction, 25% of cells were amplified. Shown are relative SYBR green fluorescence developments as a function of cycle number. Samples were amplified using 16S universal primers (UNI) for detection of bacteria (a) and V. cholerae-specific primers, ompW (b) and ctx (c) locus primers. (d to f) V. cholerae O1 in tap water was analyzed as described above. (d and e) Analysis of 1 liter tap water when amplified with ompW and with ctx, respectively. (f) Results obtained with 10 liters tap water inoculated with 103 V. cholerae O1 cells (10 CFU/100 ml) and amplified with ctx locus primers. NTC is a nontemplate control. (g and h) V. cholerae O1 detection against a high background of bacteria. Analysis of 1 liter tap water inoculated with 100 CFU/100 ml of V. cholerae and of a mix of 104 CFU/100 ml defined bacteria (E. faecalis, S. aureus, and E. coli) (g) and undefined bacteria (sewage water after treatment) (h), when amplified with UNI and with ctx locus primers. In all panels, an absence of the second (duplicate) line indicates consistency.
To simulate sensitive identification of pathogenic bacteria in drinking water containing a background level of natural microflora, 1 liter of tap water was contaminated with low concentrations of V. cholerae. As shown in Fig. 5d to f, positive identification could be achieved with a concentration as low as 100 CFU/100 ml and with even lower concentrations when ompW V. cholerae-specific primers were used (compare Fig. 5d and e). Larger volumes of up to 10 liters of contaminated tap water were passed through the ROAK-packed column, and the eluent was tested with real-time PCR using primers for the ctx gene. As shown in Fig. 5f, positive identification could be achieved with a concentration as low as 10 CFU/100 ml. Note that, untypically, the tap water used was of particularly poor quality, where five filters were needed to filter 100 ml tap water because of particle clotting, which occurred after each ∼20 ml per filter, on average (data not shown), whereas >10 liters of the same tap water could be passed through a column packed with 10 mg ROAK while capturing bacteria flowing through.
To assess detection of a target bacterium against a high background of nontarget bacteria, 1 liter of tap water was inoculated with 100 CFU/100 ml of V. cholerae and a mix of 104 CFU/100 ml of defined (E. faecalis, S. aureus, E. coli, and V. cholerae) (Fig. 5g) and undefined (sewage water after treatment) (Fig. 5h) bacteria. The eluent was tested with real-time PCR using primers for the ctx gene. The detection efficiencies of V. cholerae (determined by comparing the tested RT-PCR run to a control RT-PCR run containing the same concentration of V. cholerae) against the bacterial background were 95% and 73%, respectively.
To verify their stability, ROAK beads were subjected to 10 cycles of bacterial binding followed by their release with ethanol. To assess potential degradation, the OAK was cleaved from the resin and analyzed by LC-MS. In the control experiment, this procedure was repeated using resin-linked polylysine beads. Figure 6 depicts the resulting chromatograms. Unlike polylysine, which deteriorated over time (compare Fig. 6e and f), the OAK remained unchanged (Fig. 6a and b), while molecular mass analysis (Fig. 6c and d) pointed to a lack of chemical modifications, thereby confirming the chemical stability of the OAK and the superior robustness of the ROAK system.
FIG. 6.

OAK versus peptide stability. Beads coated with K-7α12 or polylysine-K15, exposed to consecutive cycles of bacterial binding and release with ethanol, were submitted to a cleavage reaction followed by LC-MS analysis. (a and b) Resulting HPLC chromatograms of the cleaved OAK before (a) and after (b) 10 cycles. Arrows indicate the OAK UV-absorbing peak. (c and d) Mass spectrometry analyses of the above peaks in panels a and b, respectively, for z = 3, 4, and 5. (e and f) Resulting HPLC chromatograms before (f) and after (e) 10 cycles of the cleaved K15. The arrow indicates the K15 UV-absorbing peak.
DISCUSSION
The present study showed that peptide-mimetic OAKs which were recently developed as bactericidal compounds (27) can—upon conjugation to a polymeric surface—efficiently capture various bacteria. The specific entity targeted by the OAK is unknown at this time, but the capture is likely to be mediated by nonspecific (physicochemical) interactions with an external component(s) of the cell wall such as lipopolysaccharides and lipoteichoic acids in Gram-negative and Gram-positive bacteria, respectively. Actually, the structure-activity relationships that emerged from the initial screen suggested that both charge and hydrophobicity are involved in efficient capture of bacteria by ROAK beads. These results suggest that further optimization studies might reveal new OAK sequences with improved binding properties and that are eventually endowed with selectivity.
This study also showed that the ROAK system is efficient in capturing bacterial species under continuous-flow or stationary conditions. Thus, with respect to the need for new methods for efficient detection of pathogens in large volumes of water, ROAKs seem to present several advantages. The ROAK system differs from passive concentration methods, which do not separate bacteria from contaminants of similar sizes. This may lead to blockage and/or inhibition of the detection systems such as PCR. ROAK beads concentrate bacteria through capture, i.e., a selective concentration system that significantly prevents blockage. As demonstrated in Fig. 5, large volumes (>10 liters) could be rapidly filtered through a ROAK-packed column, allowing high-sensitivity detection of low concentrations of a pathogen (i.e., 10 CFU per 100 ml). Also, consistent with high binding affinity, bacterial capture by OAK-linked surfaces (e.g., polyethylene/polystyrene in beads and carboxymethyl dextran in chips) was found to occur rapidly, and yet the bound bacteria could be readily eluted. Such attributes might be exploited to endow flexibility for multiple filtrations and recycling (e.g., to reduce costs). The fact that ROAK binding capacity was not altered and that OAK did not undergo chemical modifications when submitted to multiple cycles of bacterial binding supports this view.
In conclusion, the data support the notion that OAK-coated surfaces might be useful in filtration/concentration of microorganisms from various liquid media for the detection and/or depletion of bacteria.
Acknowledgments
We thank Yael Danin-Poleg, Technion, Israel, for fruitful discussion and comments.
This work was supported by The Israel Science Foundation (A.M., grant no. 283/08) and NATO (Y.K., project CBD.MD.981456).
Footnotes
Published ahead of print on 2 April 2010.
REFERENCES
- 1.Armstrong, D. W., G. Schulte, J. M. Schneiderheinze, and D. J. Westenberg. 1999. Separating microbes in the manner of molecules. 1. Capillary electrokinetic approaches. Anal. Chem. 71:5465-5469. [DOI] [PubMed] [Google Scholar]
- 2.Bavykin, S. G., J. P. Akowski, V. M. Zakhariev, V. E. Barsky, A. N. Perov, and A. D. Mirzabekov. 2001. Portable system for microbial sample preparation and oligonucleotide microarray analysis. Appl. Environ. Microbiol. 67:922-928. [DOI] [PMC free article] [PubMed] [Google Scholar]
- 3.Belgrader, P., W. Benett, D. Hadley, G. Long, R. Mariella, Jr., F. Milanovich, S. Nasarabadi, W. Nelson, J. Richards, and P. Stratton. 1998. Rapid pathogen detection using a microchip PCR array instrument. Clin. Chem. 44:2191-2194. [PubMed] [Google Scholar]
- 4.Belgrader, P., C. J. Elkin, S. B. Brown, S. N. Nasarabadi, R. G. Langlois, F. P. Milanovich, B. W. Colston, Jr., and G. D. Marshall. 2003. A reusable flow-through polymerase chain reaction instrument for the continuous monitoring of infectious biological agents. Anal. Chem. 75:3446-3450. [DOI] [PubMed] [Google Scholar]
- 5.Berry, E. D., and G. R. Siragusa. 1997. Hydroxyapatite adherence as a means to concentrate bacteria. Appl. Environ. Microbiol. 63:4069-4074. [DOI] [PMC free article] [PubMed] [Google Scholar]
- 6.Borchardt, M. A., and S. K. Spencer. 2002. Concentration of Cryptosporidium, microsporidia and other water-borne pathogens by continuous separation channel centrifugation. J. Appl. Microbiol. 92:649-656. [DOI] [PubMed] [Google Scholar]
- 7.Brenner, K. P., and C. C. Rankin. 1990. New screening test to determine the acceptability of 0.45-micron membrane filters for analysis of water. Appl. Environ. Microbiol. 56:54-64. [DOI] [PMC free article] [PubMed] [Google Scholar]
- 8.Bruno, J. G., and H. Yu. 1996. Immunomagnetic-electrochemiluminescent detection of Bacillus anthracis spores in soil matrices. Appl. Environ. Microbiol. 62:3474-3476. [DOI] [PMC free article] [PubMed] [Google Scholar]
- 9.Bukhari, Z., R. M. McCuin, C. R. Fricker, and J. L. Clancy. 1998. Immunomagnetic separation of Cryptosporidium parvum from source water samples of various turbidities. Appl. Environ. Microbiol. 64:4495-4499. [DOI] [PMC free article] [PubMed] [Google Scholar]
- 10.Bundy, J. L., and C. Fenselau. 2001. Lectin and carbohydrate affinity capture surfaces for mass spectrometric analysis of microorganisms. Anal. Chem. 73:751-757. [DOI] [PubMed] [Google Scholar]
- 11.Chandler, D. P., J. Brown, D. R. Call, S. Wunschel, J. W. Grate, D. A. Holman, L. Olson, M. S. Stottlemyre, and C. J. Bruckner-Lea. 2001. Automated immunomagnetic separation and microarray detection of E. coli O157:H7 from poultry carcass rinse. Int. J. Food Microbiol. 70:143-154. [DOI] [PubMed] [Google Scholar]
- 12.Chandler, D. P., and A. E. Jarrell. 2004. Automated purification and suspension array detection of 16S rRNA from soil and sediment extracts by using tunable surface microparticles. Appl. Environ. Microbiol. 70:2621-2631. [DOI] [PMC free article] [PubMed] [Google Scholar]
- 13.Chizhikov, V., A. Rasooly, K. Chumakov, and D. D. Levy. 2001. Microarray analysis of microbial virulence factors. Appl. Environ. Microbiol. 67:3258-3263. [DOI] [PMC free article] [PubMed] [Google Scholar]
- 14.Desai, M. J., and D. W. Armstrong. 2003. Separation, identification, and characterization of microorganisms by capillary electrophoresis. Microbiol. Mol. Biol. Rev. 67:38-51. [DOI] [PMC free article] [PubMed] [Google Scholar]
- 15.Fawell, J., and M. J. Nieuwenhuijsen. 2003. Contaminants in drinking water. Br. Med. Bull. 68:199-208. [DOI] [PubMed] [Google Scholar]
- 16.Fields, G. B., and R. L. Noble. 1990. Solid phase peptide synthesis utilizing 9-fluorenylmethoxycarbonyl amino acids. Int. J. Pept. Protein Res. 35:161-214. [DOI] [PubMed] [Google Scholar]
- 17.Gaidukov, L., A. Fish, and A. Mor. 2003. Analysis of membrane-binding properties of dermaseptin analogues: relationships between binding and cytotoxicity. Biochemistry 42:12866-12874. [DOI] [PubMed] [Google Scholar]
- 18.Grant, I. R., H. J. Ball, and M. T. Rowe. 1998. Isolation of Mycobacterium paratuberculosis from milk by immunomagnetic separation. Appl. Environ. Microbiol. 64:3153-3158. [DOI] [PMC free article] [PubMed] [Google Scholar]
- 19.Gregory, K., and C. M. Mello. 2005. Immobilization of Escherichia coli cells by use of the antimicrobial peptide cecropin P1. Appl. Environ. Microbiol. 71:1130-1134. [DOI] [PMC free article] [PubMed] [Google Scholar]
- 20.Haynie, S. L., G. A. Crum, and B. A. Doele. 1995. Antimicrobial activities of amphiphilic peptides covalently bonded to a water-insoluble resin. Antimicrob. Agents Chemother. 39:301-307. [DOI] [PMC free article] [PubMed] [Google Scholar]
- 21.Hill, V. R., A. L. Polaczyk, D. Hahn, J. Narayanan, T. L. Cromeans, J. M. Roberts, and J. E. Amburgey. 2005. Development of a rapid method for simultaneous recovery of diverse microbes in drinking water by ultrafiltration with sodium polyphosphate and surfactants. Appl. Environ. Microbiol. 71:6878-6884. [DOI] [PMC free article] [PubMed] [Google Scholar]
- 22.Kulagina, N. V., M. E. Lassman, F. S. Ligler, and C. R. Taitt. 2005. Antimicrobial peptides for detection of bacteria in biosensor assays. Anal. Chem. 77:6504-6508. [DOI] [PubMed] [Google Scholar]
- 23.LeChevallier, M. W., T. M. Evans, and R. J. Seidler. 1981. Effect of turbidity on chlorination efficiency and bacterial persistence in drinking water. Appl. Environ. Microbiol. 42:159-167. [DOI] [PMC free article] [PubMed] [Google Scholar]
- 24.Lis, H., and N. Sharon. 1998. Lectins: carbohydrate-specific proteins that mediate cellular recognition. Chem. Rev. 98:637-674. [DOI] [PubMed] [Google Scholar]
- 25.McFeters, G. A., S. C. Cameron, and M. W. LeChevallier. 1982. Influence of diluents, media, and membrane filters on detection of injured waterborne coliform bacteria. Appl. Environ. Microbiol. 43:97-103. [DOI] [PMC free article] [PubMed] [Google Scholar]
- 26.Nandi, B., R. K. Nandy, S. Mukhopadhyay, G. B. Nair, T. Shimada, and A. C. Ghose. 2000. Rapid method for species-specific identification of Vibrio cholerae using primers targeted to the gene of outer membrane protein OmpW. J. Clin. Microbiol. 38:4145-4151. [DOI] [PMC free article] [PubMed] [Google Scholar]
- 27.Radzishevsky, I. S., S. Rotem, D. Bourdetsky, S. Navon-Venezia, Y. Carmeli, and A. Mor. 2007. Improved antimicrobial peptides based on acyl-lysine oligomers. Nat. Biotechnol. 25:657-659. [DOI] [PubMed] [Google Scholar]
- 28.Radzishevsky, I. S., S. Rotem, F. Zaknoon, L. Gaidukov, A. Dagan, and A. Mor. 2005. Effects of acyl versus aminoacyl conjugation on the properties of antimicrobial peptides. Antimicrob. Agents Chemother. 49:2412-2420. [DOI] [PMC free article] [PubMed] [Google Scholar]
- 29.Robertson, W., G. Stanfield, G. Howard, and J. Bartram. 2003. Monitoring the quality of drinking water during storage and distribution, p. 179-204. In A. Dufour, M. Snozzi, W. Koster, J. Bartram, E. Ronchi, and L. Fewtrell (ed.), Assessing microbial safety of drinking water: improving approaches and methods. IWA Publishing, London, United Kingdom.
- 30.Rompre, A., P. Servais, J. Baudart, M. R. de Roubin, and P. Laurent. 2002. Detection and enumeration of coliforms in drinking water: current methods and emerging approaches. J. Microbiol. Methods 49:31-54. [DOI] [PubMed] [Google Scholar]
- 31.Rotem, S., I. Radzishevsky, and A. Mor. 2006. Physicochemical properties that enhance discriminative antibacterial activity of short dermaseptin derivatives. Antimicrob. Agents Chemother. 50:2666-2672. [DOI] [PMC free article] [PubMed] [Google Scholar]
- 32.Shirai, H., M. Nishibuchi, T. Ramamurthy, S. K. Bhattacharya, S. C. Pal, and Y. Takeda. 1991. Polymerase chain reaction for detection of the cholera enterotoxin operon of Vibrio cholerae. J. Clin. Microbiol. 29:2517-2521. [DOI] [PMC free article] [PubMed] [Google Scholar]
- 33.Sladek, K. J., R. V. Suslavich, B. I. Sohn, and F. W. Dawson. 1975. Optimum membrane structures for growth of coliform and fecal coliform organisms. Appl. Microbiol. 30:685-691. [DOI] [PMC free article] [PubMed] [Google Scholar]
- 34.Stratmann, J., B. Strommenger, K. Stevenson, and G. F. Gerlach. 2002. Development of a peptide-mediated capture PCR for detection of Mycobacterium avium subsp. paratuberculosis in milk. J. Clin. Microbiol. 40:4244-4250. [DOI] [PMC free article] [PubMed] [Google Scholar]
- 35.Straub, T. M., B. P. Dockendorff, M. D. Quinonez-Diaz, C. O. Valdez, J. I. Shutthanandan, B. J. Tarasevich, J. W. Grate, and C. J. Bruckner-Lea. 2005. Automated methods for multiplexed pathogen detection. J. Microbiol. Methods 62:303-316. [DOI] [PubMed] [Google Scholar]
- 36.Stults, J. R., O. Snoeyenbos-West, B. Methe, D. R. Lovley, and D. P. Chandler. 2001. Application of the 5′ fluorogenic exonuclease assay (TaqMan) for quantitative ribosomal DNA and rRNA analysis in sediments. Appl. Environ. Microbiol. 67:2781-2789. [DOI] [PMC free article] [PubMed] [Google Scholar]
- 37.Tomoyasu, T. 1992. Development of the immunomagnetic enrichment method selective for Vibrio parahaemolyticus serotype K and its application to food poisoning study. Appl. Environ. Microbiol. 58:2679-2682. [DOI] [PMC free article] [PubMed] [Google Scholar]
- 38.Watnick, P. I., K. J. Fullner, and R. Kolter. 1999. A role for the mannose-sensitive hemagglutinin in biofilm formation by Vibrio cholerae El Tor. J. Bacteriol. 181:3606-3609. [DOI] [PMC free article] [PubMed] [Google Scholar]
- 39.Westin, L., C. Miller, D. Vollmer, D. Canter, R. Radtkey, M. Nerenberg, and J. P. O'Connell. 2001. Antimicrobial resistance and bacterial identification utilizing a microelectronic chip array. J. Clin. Microbiol. 39:1097-1104. [DOI] [PMC free article] [PubMed] [Google Scholar]
- 40.Woolley, A. T., K. Lao, A. N. Glazer, and R. A. Mathies. 1998. Capillary electrophoresis chips with integrated electrochemical detection. Anal. Chem. 70:684-688. [DOI] [PubMed] [Google Scholar]