Abstract
Activatable or “smart” magnetic resonance contrast agents have relaxivities that depend on environmental factors such as pH or enzymatic activity, but the MR signal depends on relaxivity and agent concentration – two unknowns. A bimodal approach, incorporating a positron emitter, solves this problem. Simultaneous positron emission tomography (PET) and MR imaging with the biomodal, pH-responsive MR-PET agent GdDOTA-4AMP-F allows direct determination of both concentration (PET) and T1 (MRI), and hence pH.
Keywords: Smart agents, positron emission tomography, gadolinium, multimodal, pH imaging, magnetic resonance imaging
The scope of Magnetic Resonance Imaging (MRI) is moving beyond anatomical and functional imaging to also convey information at the molecular level. Molecular MRI is enabled by the introduction of protein-targeted contrast agents[1] as well as “smart” or activatable contrast agents.[2] MR contrast agents induce relaxation of tissue water, and the extent of this relaxation enhancement, termed relaxivity (r1), depends on a number of molecular factors including the hydration state of the contrast agent and its rotational diffusion rate. In a seminal paper, Meade and colleagues demonstrated that the relaxivity of a specifically designed contrast agent could be changed in the presence of the enzyme beta-galactosidase, thereby creating an imaging agent whose signal was activated by the presence of the enzyme.[3, 4] Numerous publications have followed in the last decade that describe “smart” agents responsive to other enzymes, to pH, to specific metal ion concentrations, to partial oxygen pressure and to temperature.[5, 6]
The impressive gains in smart agent development have been slow to make their way into in vivo imaging studies, however. This can be appreciated from equation 1 which relates the water relaxation rate (1/T1) to r1. MR signal is a function T1 (Eq. 1, 1/T10 = relaxation rate in absence of agent), which depends on both r1 and contrast agent concentration ([Gd]). In vitro, the gadolinium concentration is known and fixed; any signal change is due to relaxivity change. In vivo, the agent concentration is unknown, will change with time, and may vary in diseased versus normal tissue.
| (1) |
A smart agent to noninvasively map pH with both high temporal and spatial resolution would have broad utility. Decreased extracellular pH is associated with cancer and ischemic diseases such as stroke, ischemic heart disease, and kidney disease.[7] pH could be a very useful biomarker to identify disease and monitor response to therapy, but it remains a challenge to routinely assess pH in vivo. Implanting a pH electrode is invasive and offers little spatial information. 31P NMR can measure pH via the pH-dependent chemical shift of inorganic phosphate.[8] Other papers have described using exogenous agents with pH-sensitive chemical shifts.[7, 9] Yet, these NMR spectroscopic techniques are limited by low sensitivity resulting in trade offs in imaging time (longer, more averages required) and resolution (lower, bigger volume elements required). Chemical exchange saturation transfer (CEST) agents have also been described for pH imaging, but these also require millimolar concentrations for detection.[10, 11] Recently hyperpolarized 13C-carbonate MR was used to image pH.[12]
There are several Gd-based smart agents whose relaxivity is pH dependent due to changes in complex hydration with pH.[6, 7] To address the problem of complex concentration, Aime et al. proposed a R2/R1 ratiometric method[13] but given the relatively large R2 present in living tissues compared to R1, the in vivo accuracy of such an approach has yet to be proven. Combining fluorine MRI for quantification with a pH sensitive Gd-based agent has also been suggested,[14] although the sensitivity of F-19 imaging is in the millimolar range.
An early pH sensitive agent was GdDOTA-4AMP.[15] This agent was used to map pH in vivo in renal acidosis[16] and brain tumor[17] models. To estimate the in vivo concentration of agent, these investigators first injected GdDOTP, which has pH-independent relaxivity, and imaged. They assumed that the pharmacokinetics of GdDOTP was the same as for GdDOTA-4AMP and that differences in the signal vs time curves for GdDOTP and GdDOTA-4AMP were due to differences in relaxivity. These studies demonstrated the potential for in vivo pH mapping and showed that MRI with GdDOTA-4AMP was sensitive enough to detect pH differences. The limitations of this approach were the need for two sequential injections and the assumption that both contrast agents have identical pharmacokinetics.
Positron emission tomography (PET) offers exquisite sensitivity and the ability to perform absolute quantification. Quantitative PET imaging is routinely used in human and animal studies, for example to measure neuroreceptor occupancy levels[18] or to measure tissue perfusion.[19] The recent application of MR-compatible avalanche photodiode detector technology has now made it possible to have a functioning PET detector inside the MR magnet.[20, 21] This allows for the simultaneous acquisition of PET and MR data, and ability to obtain both temporally and spatially registered imaging data sets. We hypothesized that simultaneous MR-PET imaging with a bimodal MR-PET smart agent would result in quantification of both concentration and relaxivity. This dual label approach could enable a range of quantitative smart probes for in vivo applications.
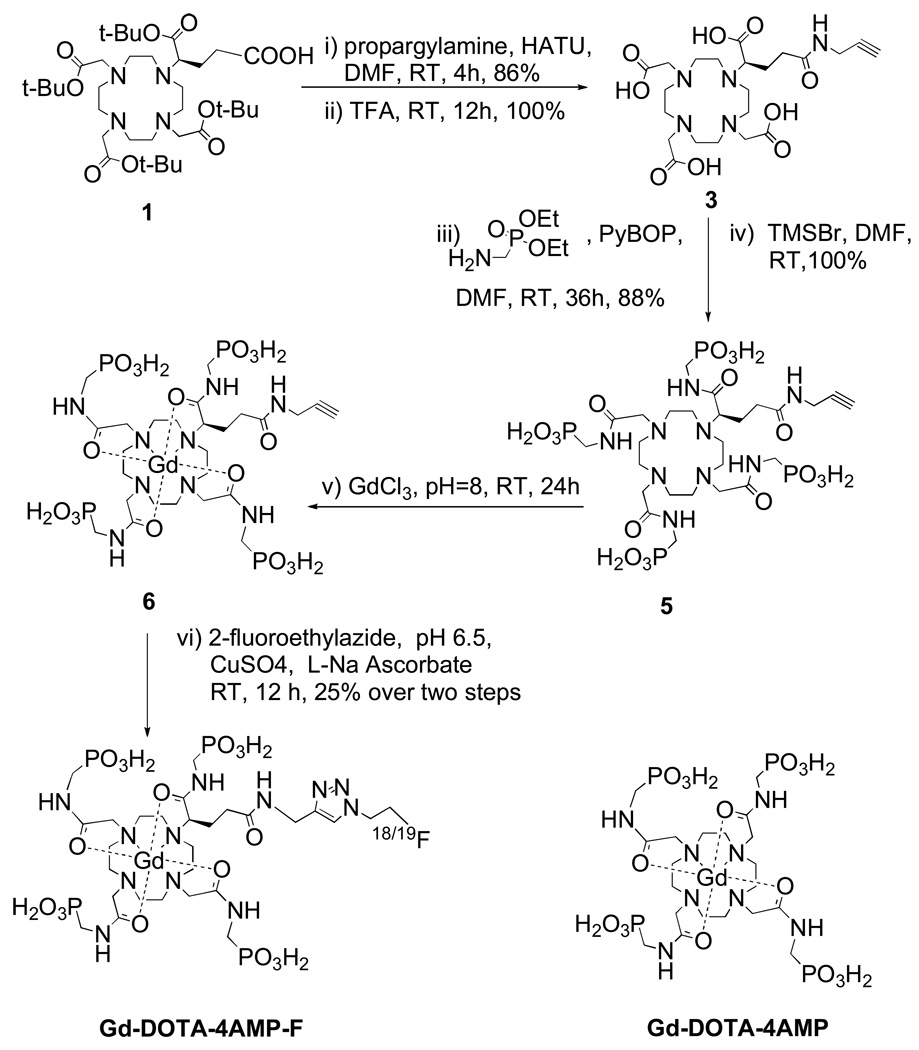
Here, a bimodal MR-PET agent designed for quantitative pH imaging at concentrations commonly used for in vivo MRI (0.1–1 mM) is described. The established pH sensitive MR agent GdDOTA-4AMP was modified to incorporate a fluorine atom (either 18F or 19F). The highly charged, hydrophilic GdDOTA-4AMP necessitated a strategy to introduce the 18F atom under aqueous conditions, and we chose the versatile Cu(I)-catalyzed Huisgen cycloaddition (“click reaction”) for this purpose.[22] GdDOTA-4AMP-F was prepared in six steps (Scheme 1) with a 25% overall yield starting from an established bifunctional chelator, tBu protected DOTAGA, 1.[23] 1 was activated and coupled with propargylamine, and subsequently deprotected in neat TFA to give 3. The introduction of the phosphonate groups was accomplished by coupling with aminomethyl-phosphonic acid diethyl ester, followed by mild deprotection of the phosphonate groups with trimethylsilyl bromide in DMF. The formation of the Gd(III) complex from the chloride salt, followed by reaction of fluoroethylazide and the alkyne intermediate 6, was performed in one pot. [F-18]fluoroethylazide was prepared in two steps from 2-azidoethanol, while the [F-19] version was prepared in two steps from 2-fluoroethanol (see Supp. Info).[22]
Scheme 1.
Synthesis of Gd-DOTA-4AMP-F and structure of Gd-DOTA-4AMP.
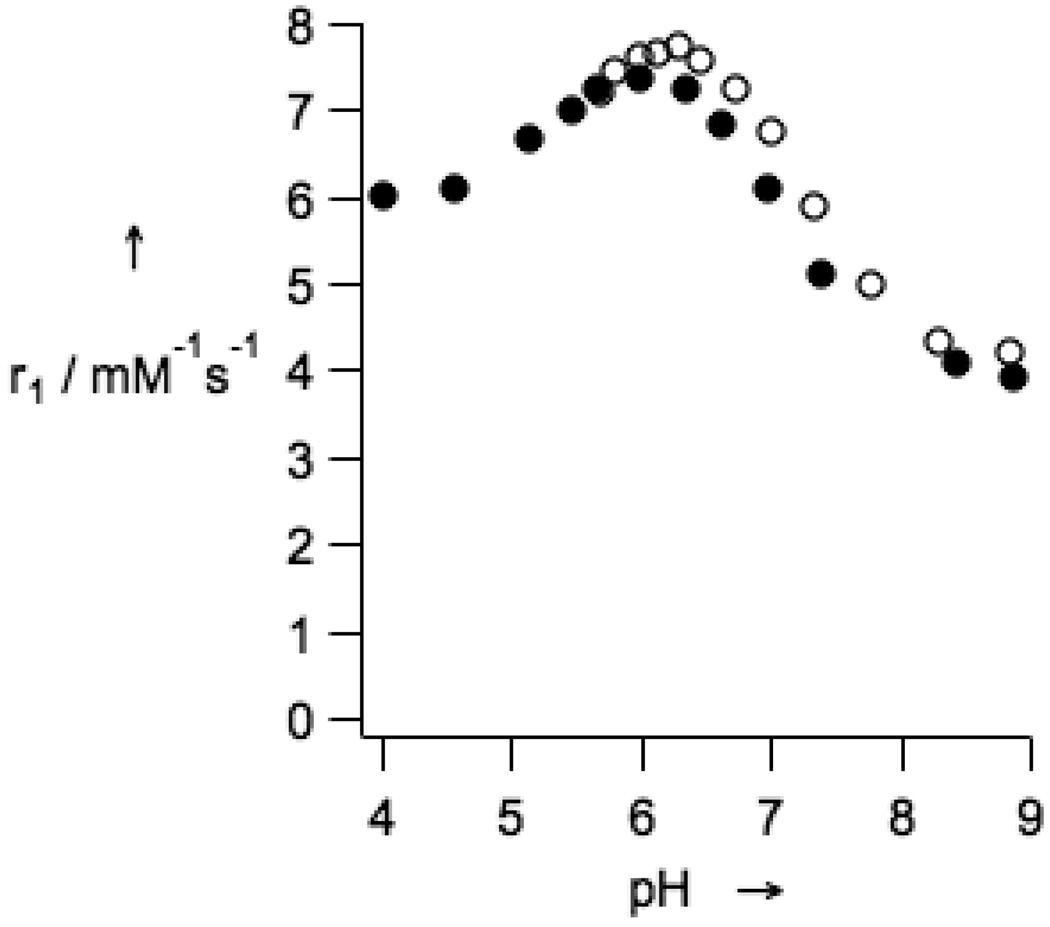
The introduction of the fluorine-containing moiety into GdDOTA-4AMP-F did not modify the pH dependence of the longitudinal relaxivity with respect to the parent compound GdDOTA4-AMP.[24] GdDOTA-4AMP-F retains a monotonic decrease in relaxivity between pH 6.0 and 8.5 (Figure 1). In this pH range the relaxivity varied between 7.4 and 3.9 mM−1s−1 (60 MHz, 37 °C) when measured in an isotonic salt mixture. When the relaxivity was measured in rabbit plasma, the profile was found to be very similar to the profile measured in the salt solution. This indicates little if any protein binding and suggests that the pH-relaxivity relationship will be valid in vivo.
Figure 1.
Relaxivity of GdDOTA-4AMP-F as a function of pH (37 °C, 1.4 T) in presence of 135 mM NaCl, 5 mM KCl, and 2.5 mM CaCl2 (filled diamonds), and in rabbit plasma (open circles).
The chemical concentration required for MR contrast is orders of magnitude higher than for PET imaging. For this reason, F-19 and F-18 versions of the probe were prepared separately, and subsequently mixed to produce a low specific activity MR-PET agent. Simultaneous MR-PET imaging was performed on a series of samples with varying pH using a clinical 3T MRI with a MR-compatible human PET scanner insert.[21]
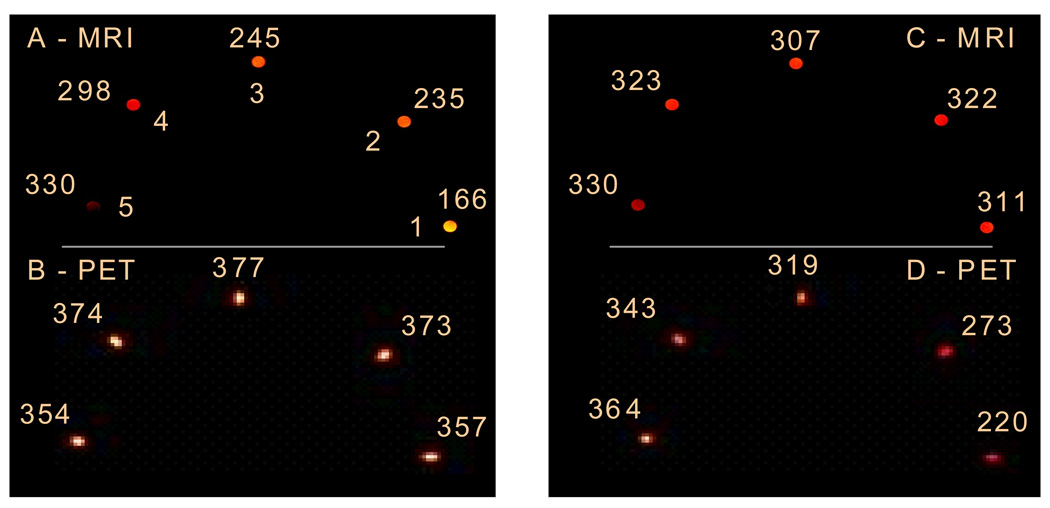
Figure 2 shows simultaneous MR-PET images acquired on phantoms where the T1 varied (MR, 2A) but the probe concentration was constant (PET, 2B); or where T1 was constant (2C) but the probe concentration varied (2D). Figure 2 eloquently displays the limitations of using an MR responsive agent without independent knowledge of the agent concentration. Note that in both sets of phantoms, the pH is varied. The only way to obtain pH values from the images is to combine both the PET and MR datasets.
Figure 2.
T1-weighted MR images (A and C, T1 values (ms) listed) and PET images (B and D, PET intensities (a.u.) listed) of phantoms at pH 6.5 (tube 1), 6.8 (2), 7.1 (3), 7.4 (4), and 7.8 (5). Phantoms in images A and B have the same concentration (0.45 mM); phantoms in images C and D have the following concentrations: 0.31 mM (1), 0.33 mM (2), 0.38 mM), 0.42 mM (4), 0.45 mM (5).
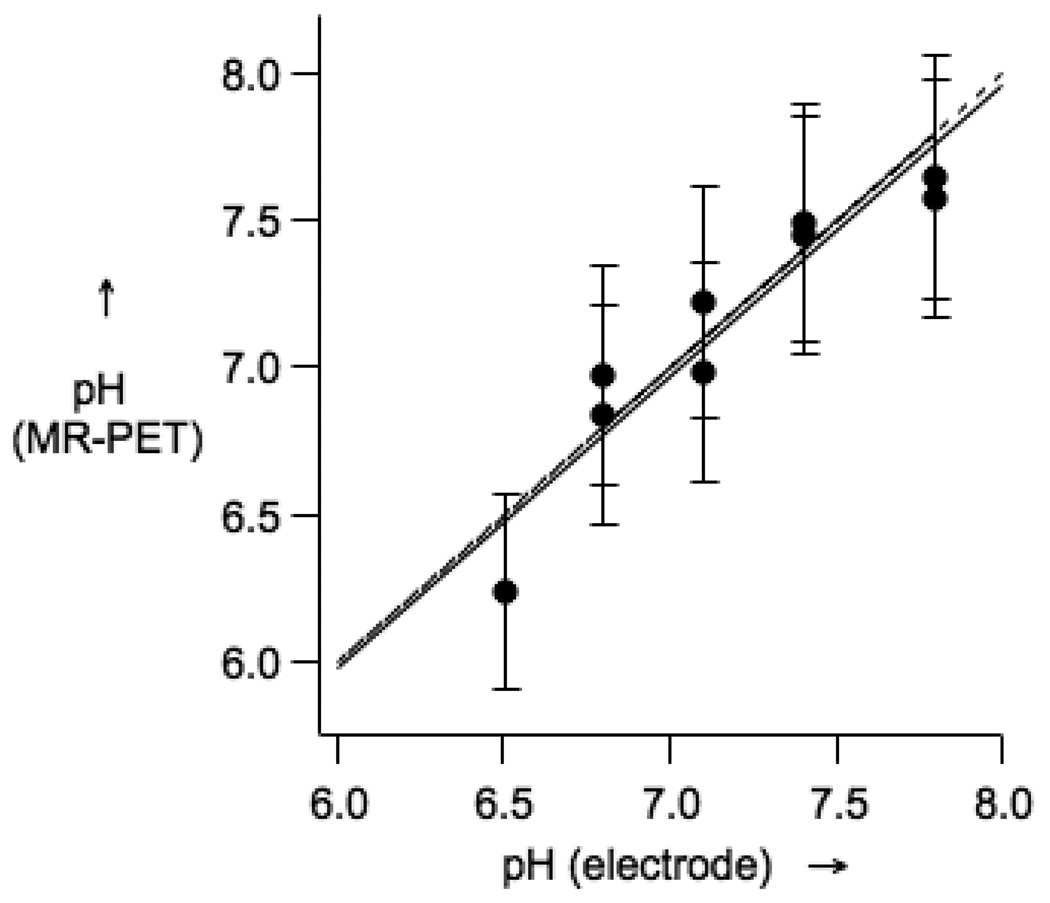
Since the PET signal is linear with radiochemical concentration, the unknown agent concentration can be determined by comparing the PET images with a series of standards. For the MR data, the relationship between r1 and pH can be measured (see Fig 1) and this was repeated at 3T where a similar linear relationship between r1 and pH between pH 6 to 8.5 was obtained. From these two standard curves, the PET and MR imaging data can be analyzed to estimate the pH of the samples. Figure 3 shows the good correspondence between pH measured by electrode and pH calculated from the MR and PET images.
Figure 3.
pH obtained from PET-MR image analysis versus pH measured by a glass electrode. The solid line is a linear fit of the data, while the dotted line represents a 1:1 correspondence.
In conclusion, this communication describes a smart MR-PET agent that can quantitatively and non-invasively report on pH. Imaging data were obtained on a commercial clinical MRI with a prototype human PET camera at agent concentrations routinely encountered in clinical MRI (0.1 – 1 mM). This augurs well for the application of GdDOTA-4AMP-F to image pH changes in vivo. The combination of PET for quantifying concentration and MR for quantifying T1 allows for the simultaneous determination of relaxivity. For smart MR probes where relaxivity is proportional to an environmental stimulus, this bimodal imaging approach enables direct quantification of the stimulus, pH in this case. We note that this bimodal MR-PET strategy is generally applicable to other smart MR probes.
Experimental Section
Details of compound synthesis, relaxivity assays and imaging experiments are given in the Supporting Information.
Supplementary Material
Acknowledgments
This work was supported in part by the National Institute of Biomedical Imaging and Bioengineering, R21EB009738.
Footnotes
Supporting information for this article is available on the WWW under http://www.angewandte.org or from the author.
Contributor Information
Luca Frullano, A. A. Martinos Center for Biomedical Imaging, Massachusetts General Hospital, Harvard Medical School, 149 13th St, Suite 2301, Charlestown, MA 02129 (USA).
Ciprian Catana, A. A. Martinos Center for Biomedical Imaging, Massachusetts General Hospital, Harvard Medical School, 149 13th St, Suite 2301, Charlestown, MA 02129 (USA).
Thomas Benner, A. A. Martinos Center for Biomedical Imaging, Massachusetts General Hospital, Harvard Medical School, 149 13th St, Suite 2301, Charlestown, MA 02129 (USA).
A. Dean Sherry, Dept of Chemistry, University of Texas at Dallas and the Advanced Imaging Research Center, University of Texas, Southwestern Medical Center, Dallas, TX (USA).
Peter Caravan, A. A. Martinos Center for Biomedical Imaging, Massachusetts General Hospital, Harvard Medical School, 149 13th St, Suite 2301, Charlestown, MA 02129 (USA).
References
- 1.Caravan P. Acc. Chem. Res. 2009;42:851. doi: 10.1021/ar800220p. [DOI] [PubMed] [Google Scholar]
- 2.Major JL, Meade TJ. Acc. Chem. Res. 2009;42:893. doi: 10.1021/ar800245h. [DOI] [PMC free article] [PubMed] [Google Scholar]
- 3.Louie AY, Huber MM, Ahrens ET, Rothbacher U, Moats R, Jacobs RE, Fraser SE, Meader TJ. Nat. Biotechnol. 2000;18:321. doi: 10.1038/73780. [DOI] [PubMed] [Google Scholar]
- 4.Moats RA, Fraser SE, Meade TJ. Angew. Chem. Int. Ed. Engl. 1997;36:726. [Google Scholar]
- 5.Bonnet CS, Toth E. AJNR Am. J. Neuroradiol. 2009:A1753. doi: 10.3174/ajnr.A1753. EPub ajnr. [DOI] [PMC free article] [PubMed] [Google Scholar]
- 6.De Leon-Rodriguez LM, Lubag AJ, Malloy CR, Martinez GV, Gillies RJ, Sherry AD. Acc. Chem. Res. 2009;42:948. doi: 10.1021/ar800237f. [DOI] [PMC free article] [PubMed] [Google Scholar]
- 7.Perez-Mayoral E, Negri V, Soler-Padros J, Cerdan S, Ballesteros P. Eur. J. Radiol. 2008;67:453. doi: 10.1016/j.ejrad.2008.02.048. [DOI] [PubMed] [Google Scholar]
- 8.Kintner DB, Anderson MK, Fitzpatrick JH, Jr, Sailor KA, Gilboe DD. Neurochem. Res. 2000;25:1385. doi: 10.1023/a:1007664700661. [DOI] [PubMed] [Google Scholar]
- 9.Kenwright AM, Kuprov I, De Luca E, Parker D, Pandya SU, Senanayake PK, Smith DG. Chem. Commun. 2008:2514. doi: 10.1039/b802838a. [DOI] [PubMed] [Google Scholar]
- 10.Aime S, Delli Castelli D, Terreno E. Angew. Chem. Int. Ed. Engl. 2002;41:4334. doi: 10.1002/1521-3773(20021115)41:22<4334::AID-ANIE4334>3.0.CO;2-1. [DOI] [PubMed] [Google Scholar]
- 11.Ward KM, Balaban RS. Magn. Reson. Med. 2000;44:799. doi: 10.1002/1522-2594(200011)44:5<799::aid-mrm18>3.0.co;2-s. [DOI] [PubMed] [Google Scholar]
- 12.Gallagher FA, Kettunen MI, Day SE, Hu DE, Ardenkjaer-Larsen JH, Zandt R, Jensen PR, Karlsson M, Golman K, Lerche MH, Brindle KM. Nature. 2008;453:940. doi: 10.1038/nature07017. [DOI] [PubMed] [Google Scholar]
- 13.Aime S, Fedeli F, Sanino A, Terreno E. J. Am. Chem. Soc. 2006;128:11326. doi: 10.1021/ja062387x. [DOI] [PubMed] [Google Scholar]
- 14.Gianolio E, Napolitano R, Fedeli F, Arena F, Aime S. Chem. Commun. 2009:6044. doi: 10.1039/b914540k. [DOI] [PubMed] [Google Scholar]
- 15.Zhang S, Wu K, Sherry AD. Angew. Chem. Int. Ed. Engl. 1999;38:3192. [PubMed] [Google Scholar]
- 16.Raghunand N, Howison C, Sherry AD, Zhang S, Gillies RJ. Magn. Reson. Med. 2003;49:249. doi: 10.1002/mrm.10347. [DOI] [PubMed] [Google Scholar]
- 17.Garcia-Martin ML, Martinez GV, Raghunand N, Sherry AD, Zhang S, Gillies RJ. Magn. Reson. Med. 2006;55:309. doi: 10.1002/mrm.20773. [DOI] [PubMed] [Google Scholar]
- 18.Lee CM, Farde L. Trends Pharmacol. Sci. 2006;27:310. doi: 10.1016/j.tips.2006.04.004. [DOI] [PubMed] [Google Scholar]
- 19.Bengel FM, Higuchi T, Javadi MS, Lautamaki R. J. Am. Coll. Cardiol. 2009;54:1. doi: 10.1016/j.jacc.2009.02.065. [DOI] [PubMed] [Google Scholar]
- 20.Catana C, Procissi D, Wu Y, Judenhofer MS, Qi J, Pichler BJ, Jacobs RE, Cherry SR. Proc. Natl. Acad. Sci. U S A. 2008;105:3705. doi: 10.1073/pnas.0711622105. [DOI] [PMC free article] [PubMed] [Google Scholar]
- 21.Schlemmer HP, Pichler BJ, Schmand M, Burbar Z, Michel C, Ladebeck R, Jattke K, Townsend D, Nahmias C, Jacob PK, Heiss WD, Claussen CD. Radiology. 2008;248:1028. doi: 10.1148/radiol.2483071927. [DOI] [PubMed] [Google Scholar]
- 22.Glaser M, Arstad E. Bioconjug. Chem. 2007;18:989. doi: 10.1021/bc060301j. [DOI] [PubMed] [Google Scholar]
- 23.Eisenwiener KP, Powell P, Macke HR. Bioorg. Med. Chem. Lett. 2000;10:2133. doi: 10.1016/s0960-894x(00)00413-3. [DOI] [PubMed] [Google Scholar]
- 24.Kalman FK, Woods M, Caravan P, Jurek P, Spiller M, Tircso G, Kiraly R, Brucher E, Sherry AD. Inorg. Chem. 2007;46:5260. doi: 10.1021/ic0702926. [DOI] [PMC free article] [PubMed] [Google Scholar]
Associated Data
This section collects any data citations, data availability statements, or supplementary materials included in this article.


