

SUMMARY
Successful cytokinesis is critical for maintaining genome stability [1, 2], and requires the assembly of a robust central spindle to specify the cleavage furrow position [3], to prevent separated chromosomes from coming back together [4], and to contribute to midbody abscission [5, 6]. A proper central spindle is assembled and maintained by a number of microtubule-associated and molecular motor proteins that sort microtubules into bundles with their plus-ends overlapping at the center [1, 2]. The mechanisms by which different factors organize the central spindle microtubules remain unclear. We found that perturbation of the minus-end directed Kinesin-14 HSET increased the frequency of polyploid cells, which resulted from a failure in cytokinesis. In addition, HSET knockdown resulted in severe midzone microtubule organization, most notably at microtubule minus ends as well as mislocalization of several midbody-associated proteins. Biochemical analysis showed that both human HSET and Xenopus XCTK2 co-fractionated with the γ-tubulin ring complexes on sucrose gradients and that XCTK2 associated with γ-tubulin and Xgrip109 by immunoprecipitation. Our data reveal the novel finding that a minus-end directed motor contributes to the organization and stability of the central spindle, which is needed for proper cytokinesis.
RESULTS AND DISCUSSION
The rigid central spindle is composed of parallel microtubule (MT) bundles, with their plus ends interdigitating at the center [7, 8]. To build such a scaffold, a number of MT-associated proteins (MAPs) help organize the central spindle by crosslinking MT plus-ends or by transporting factors to the midbody [1, 2]. However, multiple lines of evidence show that in addition to MT plus-end organization of the central spindle, the MT minus-ends of the central spindle are also sorted toward the spindle pole and accumulate at the vicinity of the separating chromosomes [9–11]. The mechanism and the biological function of this minus-end MT organization are not clearly defined.
In a metaphase bipolar spindle, the MT minus-ends are organized at the spindle pole by the minus-end directed motors dynein and Kinesin-14 [12–14]. Although multiple plus-end directed motors help mediate central spindle organization during anaphase, the relative contribution of minus-end motors to cytokinesis still remains largely unknown. We addressed this question by analyzing the late mitotic function of the minus-end directed Kinesin-14 HSET. We performed HSET RNAi in HeLa cells with multiple oligos and found an increased frequency of multi-nucleate cells (Figure 1A, B), consistent with RNAi of the Drosophila Kinesin-14 Ncd in S2 cells [15]. As HSET RNAi does not cause dramatic multipolar spindle formation in HeLa cells [16, 17], our data suggests that HSET is likely to be involved in other pathways to maintain genome stability.
Figure 1. HSET Perturbation Causes Polyploid Cell Formation.

(A) HeLa cells were transfected with Luciferase RNAi oligo (Control) or HSET RNAi oligo, fixed, and stained for MTs (red), HSET (green), and DNA (blue). Arrows indicate multi-nucleate cells. Scale bar = 50 μm. (B) Mean percentages of multi-nucleate cells in control and HSET RNAi cells reported as mean ± SEM, p<0.01. The right half of the graph (green) shows a separate negative control oligo and two additional HSET oligos. (C) Live imaging of HeLa cells expressing GFP-H2B and mCherry-tubulin in control (top row, Movie S1) and HSET (middle and bottom rows, Movies S2 and S3) RNAi cells. Middle row, HSET RNAi movie showing ‘cleavage furrow regression’ defect, indicated by the yellow arrowhead (Movie S2). Bottom row, HSET RNAi movie depicting the ‘traveling chromosomes’ phenotype, indicated by the white arrowhead (Movie S3). Scale bar = 10 μm. (D) Total percentages of phenotypes described in part C.
To ask how HSET may prevent polyploidy, we tracked the formation of multi-nucleate cells in HSET depleted cells where each cell with a bipolar spindle was analyzed for the fate of the daughter cells using high-throughput live imaging of a GFP-H2B/mcherry-tubulin cell line. Compared with the normal chromosome alignment, faithful segregation, and cleavage furrow ingression of control cells (Figure 1C, top row, Movie S1), the cell divisions in HSET RNAi cells fell into two categories that resulted in multi-nucleate cells. One phenotype was the regression of the cleavage furrow after chromosome segregation, resulting in a bi-nucleate cell (Figure 1C, middle row, Movie S2). We termed the other phenotype ‘traveling chromosomes’, where at the later stages of cytokinesis, one daughter chromosome mass rapidly moved through the midbody and into the cytoplasm of the other daughter cell (Figure 1C, bottom row, Movie S3). In some cases, the two daughter nuclei traveled between the daughter cells multiple times, ending up with both of them in one of the daughter cells. In this live cell analysis, 1% of control cells had defective cytokinesis (6 out of 708 cells), compared to 13% of the HSET RNAi cells (29 out of 247), consistent with our fixed-cell analysis (Figure 1D). Our data suggest that HSET is required for normal cytokinesis progression to maintain a proper karyotype.
Cleavage furrow regression is the primary defect caused by disruption of many central spindle localized proteins [5, 18, 19]. For example, perturbation of PRC1, a MT cross-linker that preferentially scaffolds antiparallel MTs in the central spindle [5, 20, 21], causes a defect in the completion of cytokinesis, resulting in bi-nucleate cells [5, 6]. Meanwhile, a number of plus-end directed molecular motor proteins, such as the Kinesin-6 motor MKLP1 [22], the Kinesin-4 motor Kif4 [23], and the Kinesin-3 motor Kif14 [18], are also widely involved in the organization of the central spindle. Knockdown of any of these motors abrogates midbody formation and the completion of cytokinesis [19, 24–26]. Therefore, we asked whether HSET knockdown perturbed proper localization of central spindle-associated proteins during cytokinesis. Through a quantitative analysis of midbody protein abundance at various cytokinesis stages, we found a significant decrease in the average fluorescence intensity at the central spindle for PRC1, Kif14, Kif4, and CENP-E after HSET RNAi (Figures 2A and 2B).
Figure 2. Central Spindle Components are Reduced on Midzone MTs after HSET RNAi.

(A) Control and HSET RNAi cells were fixed and stained for MTs (red), PRC1 (green), and DNA (blue). The normalized average fluorescence intensities of PRC1 staining at the midzone (boxed areas) were determined and are shown in the upper-right corner of each panel. (B) Control and HSET RNAi cells were fixed and stained for MTs (red), Kif14, Kif4, or CENP-E (green) and DNA (blue). The normalized average fluorescence intensities of Kif14, Kif4, CENP-E midzone staining were determined as in part A and are shown in the upper-right corner. (C) The average fluorescence intensities of PRC1 staining from control (top) and HSET (bottom) RNAi cells were plotted versus the cleavage furrow width and fit with a one-phase decay curve. The diagram on the top shows the approximate cell stage at different cleavage furrow widths. Scale bar = 10 μm. A similar analysis for HSET is shown in Figure S1.
To ask whether the fluorescence staining decreased relative to the cytokinesis stage, we analyzed fluorescence intensity data of PRC1 by plotting the average intensity versus cleavage furrow width (Figure 2C). For control cells, PRC1 intensity did not change until the cleavage furrow started to ingress, during which the average PRC1 intensity increased dramatically with the narrowing of the cleavage furrow (right side of Figure 2C). In contrast, the localization of PRC1 in HSET RNAi cells was impaired, and the dramatic PRC1 intensity increase during telophase was not observed (Figure 2C, bottom). This data suggests that during central spindle compaction PRC1 is not recruited to or stably maintained at the midzone after HSET depletion.
As a minus-end directed motor, HSET is enriched near the separated chromosomes at the minus-ends of midzone MTs during telophase and early cytokinesis (Figure S1). Therefore, it is unlikely that HSET transports central spindle proteins to their proper location at the plus-ends of MTs in the overlap region to regulate cytokinesis. Rather, we conjectured that HSET might regulate central spindle MT stability and/or organization. One mechanism could be that HSET perturbation affects the amount of MT polymer at the spindle midzone, resulting in fewer docking sites for central spindle binding proteins. To test this idea, we quantified the integrated fluorescence intensity of MT staining for the entire central spindle region, which was reduced to 71% of control cells after HSET RNAi (Figure 3A). This data suggests that HSET contributes, albeit weakly, to maintaining the volume of MTs in the central spindle.
Figure 3. HSET Knockdown Slightly Reduces the MT Polymer Volume, but Dramatically Alters Central Spindle MT Stability.

(A) Control and HSET RNAi cells were fixed and stained for MTs (red) and DNA (blue). The normalized integrated fluorescence intensities of MT staining at the midzone are shown in the upper-right corner of the MT image. (B) Control and HSET RNAi HeLa cells were synchronized by a single thymidine block, released from G1/S, treated at 10 h with Cytochalasin D for 4 h, and processed for immunofluorescence. At early stages of telophase (top panels), HSET RNAi cells had dim central spindle MTs relative to control cells, while at later stages (bottom panels), many central spindle MTs had disappeared. Scale bar = 10 μm. A more detailed analysis of central spindle structure after HSET knockdown is found in Figure S2.
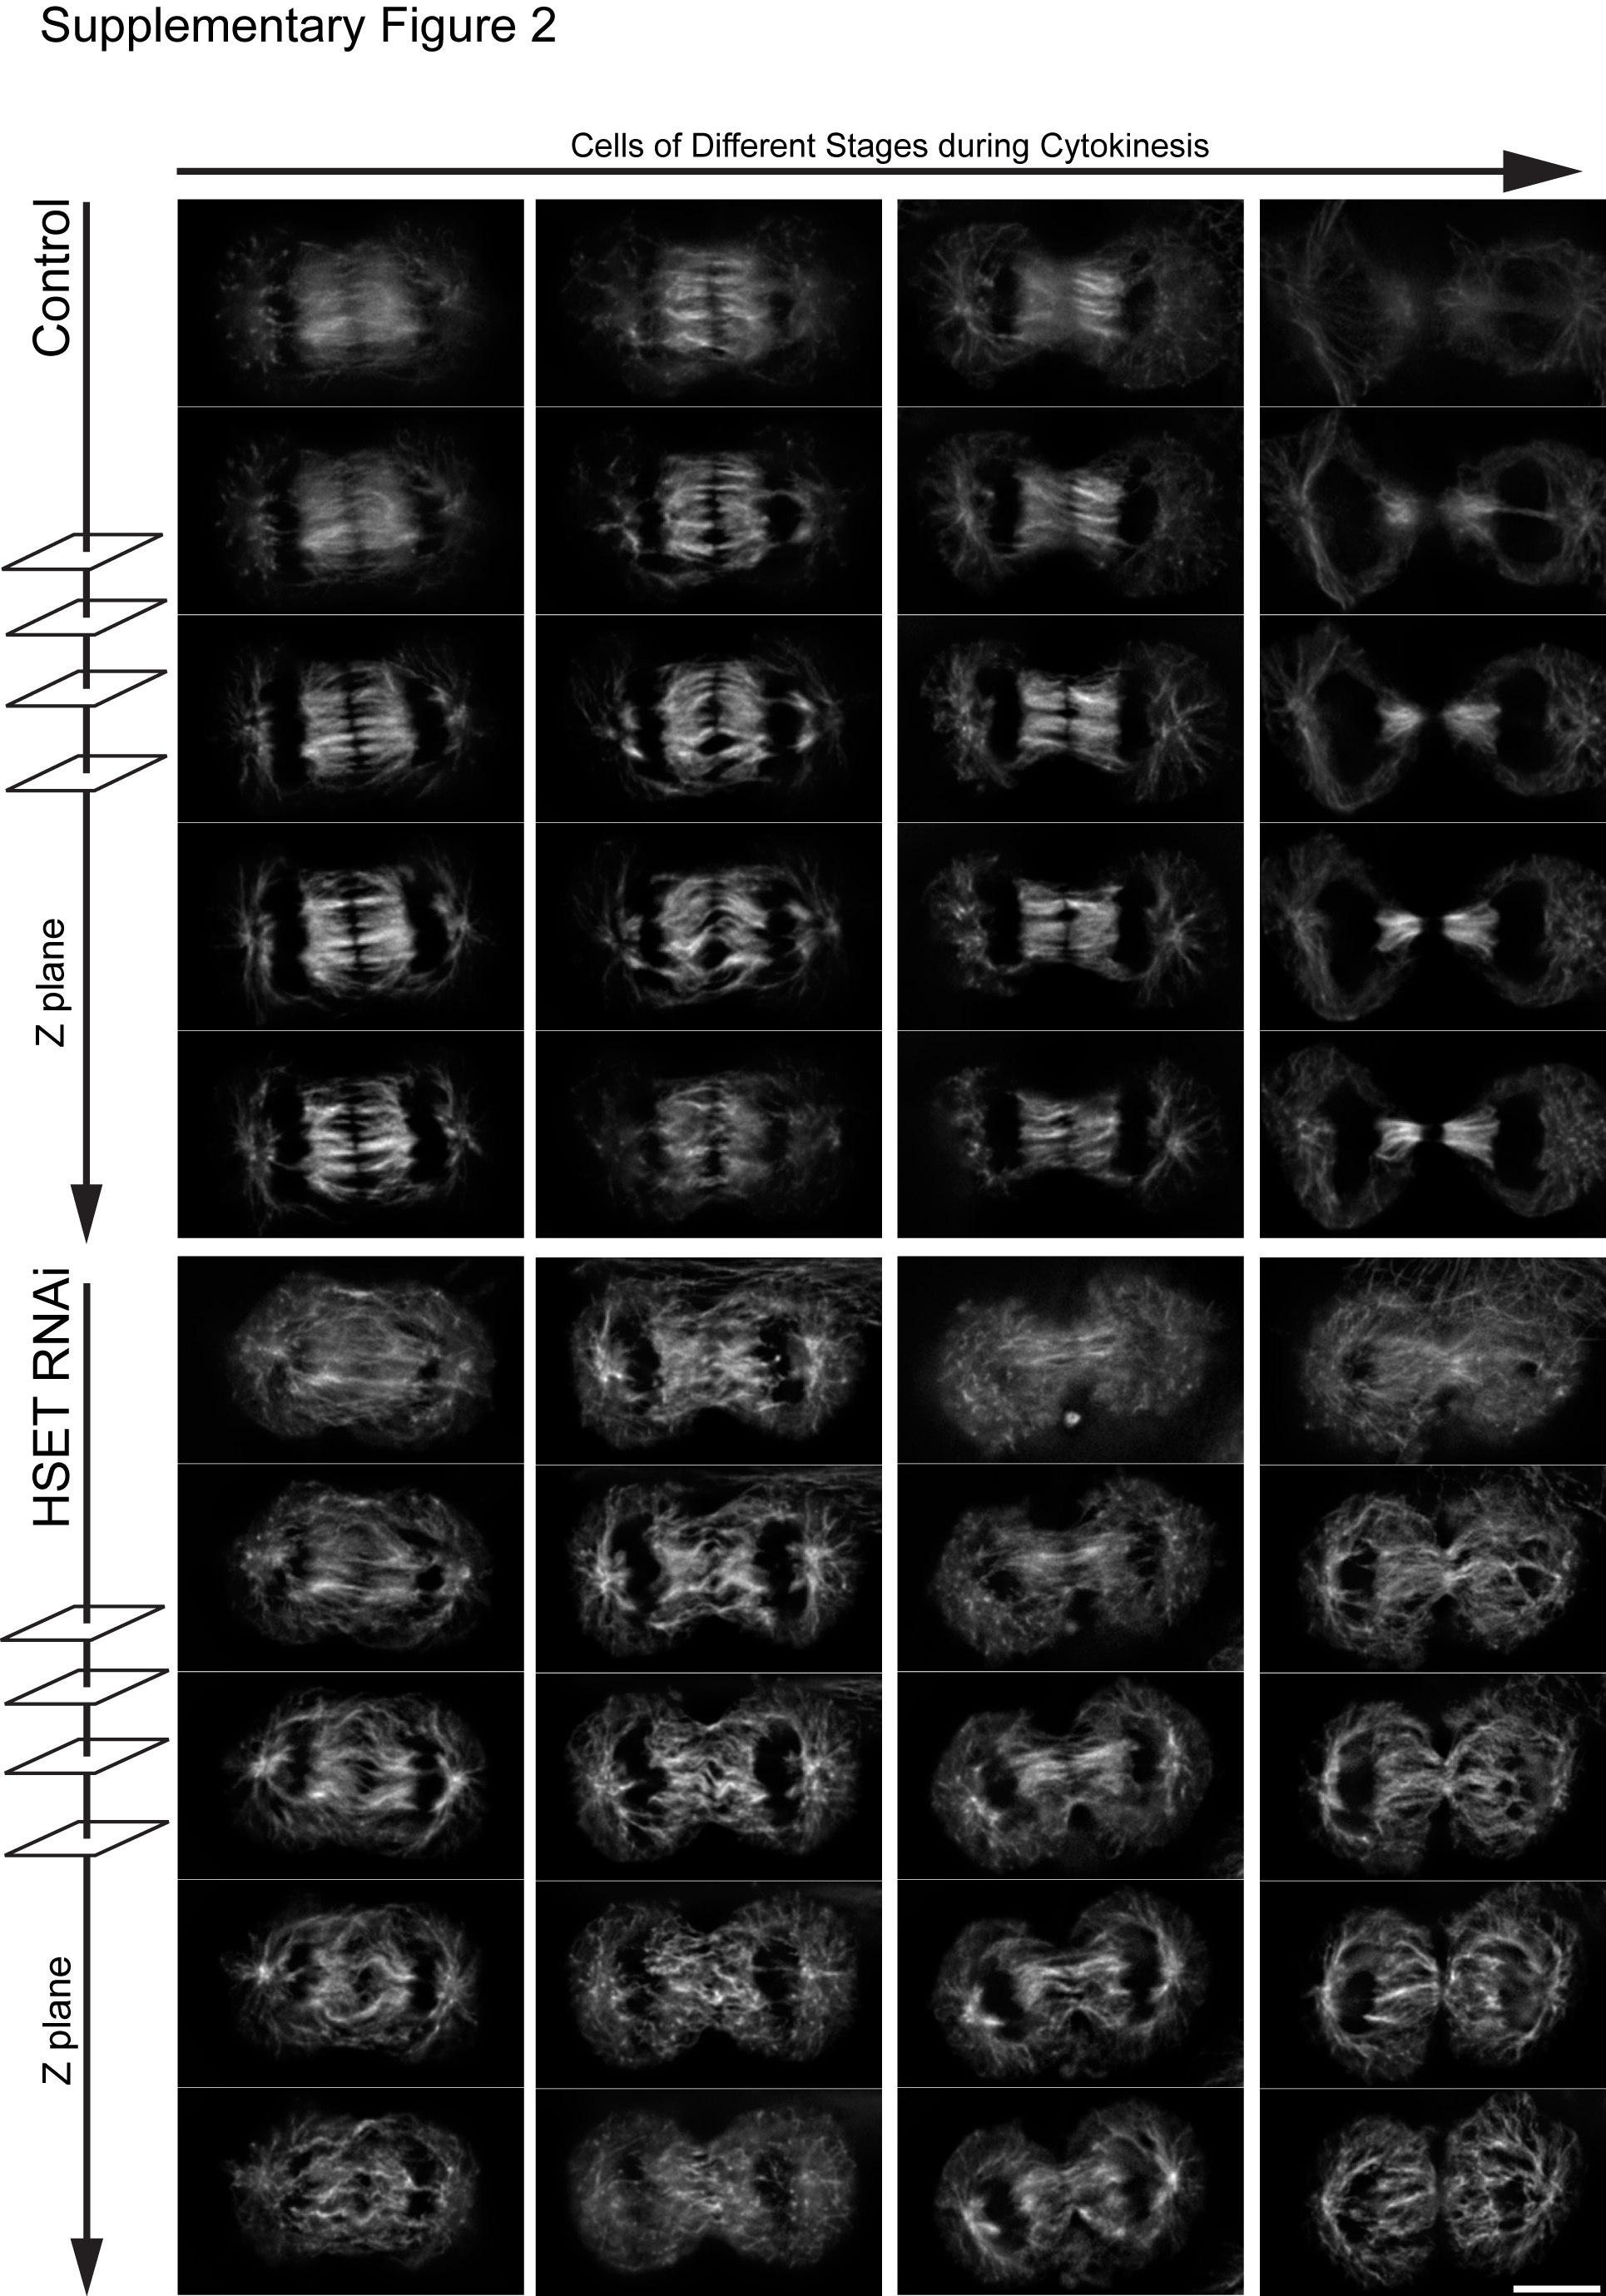
Another possible mechanism is that central spindle MTs are not stable after HSET RNAi as the rigid MT bundles may be required to keep chromosomes separated and to signal furrow cleavage ingression to complete division. To analyze the central spindle MTs during the fast progression of cytokinesis, we treated mitotic cells with cytochalasin D to prevent cleavage furrow ingression without disrupting chromosome segregation and central spindle assembly [27, 28]. Control cells exhibited robust central spindle MT bundles even after chromosome decondensation and HSET degradation (Figure 3B). In contrast, HSET RNAi cells only showed a dim midzone with thin MT bundles, even when chromosomes were still highly condensed (Figure 3B). These findings suggest that HSET has a role in the stability of the central spindle to maintain a persistent midzone structure. To further probe this idea, we analyzed different optical sections of the central spindle from cells at different stages of cytokinesis. In control cells, the thick bundles of MTs were well-defined and aligned with a distinct overlap region in the middle. However, MTs in HSET RNAi cells were less bundled and much thinner than in control cells (Figure S2). From these results, we propose that HSET functions to organize spindle midzone MTs, for a stable central spindle needed for proper cytokinesis.
To analyze the organization of the central spindle MTs, we sought to characterize the distribution of MT minus-ends within the midzone. New MT nucleation sites are proposed to form on the central spindle via the γ-tubulin ring complex (γ-TuRC) to increase the volume of MT polymer [29, 30]. Consistent with this idea, the Augmin complex, which docks γ-TuRC to spindle MTs, localizes on the central spindle in close proximity to the separated chromosomes [10, 31], and is currently one of the best markers of MT minus-end distribution in the spindle. Thus, we used FAM29A, a subunit of the Augmin complex [32], as a marker to test whether HSET RNAi influenced MT minus-end organization in the central spindle. In control cells, FAM29A accumulated near chromosomes during cytokinesis (Figure 4A) [10]. After HSET RNAi, the localization of FAM29A appeared more diffuse (Figure 4C). To analyze this difference in localization, a line scan on the central spindle along the pole-to-pole axis was performed in which the ratio of FAM29A to MT intensity (IFAM29A/IMT) was calculated at each data point and plotted versus its normalized position on the central spindle (Figures 4B and 4D). For control cells, the ratio of FAM29A to MTs showed obvious peaks at each end of the central spindle near the separated chromosomes, showing that FAM29A concentrates on the minus-ends of central spindle MTs. In contrast, the two IFAM29A/IMT peaks were greatly reduced in HSET RNAi cells, and the curve shape was more flat (Figure 4D). This change in FAM29A localization after HSET knockdown suggests that central spindle MT organization is perturbed due to lack of MT minus-end organization.
Figure 4. HSET Knockdown Perturbs MT Minus-end Organization in the Central Spindle.

(A, C) Control (A) and HSET (C) RNAi cells were fixed and stained for MTs (red), FAM29A (green), and DNA (blue). Scale bar = 10 μm. (B, D) Line scans of FAM29A staining along the pole-to-pole axis in 10–13 randomly selected cells showing FAM29A accumulation in control cells close to separated chromosomes. The ratio of FAM29A intensity and MT intensity was calculated and plotted according to its normalized position on the central spindle. Orange curve in B corresponds to the control cell image in A, and the cyan curve in D corresponds to the HSET RNAi cell image in B. (E, F) HeLa extract (E) and Xenopus egg extract (F) were loaded on a 5%–40% sucrose gradient, and assayed by ELISA for the distribution of HSET, importin α/β and γ-tubulin. The S value of each peak is indicated above the graph based on parallel sucrose gradient standards. (G) XCTK2 from Xenopus egg extracts was immunoprecipitated with either control IgG or XCTK2 antibodies and probed for the presence of Xgrip109 (left) and γ-tubulin (right). Molecular mass standards (kDa) are indicated to the left of each panel. (H) Model for Kinesin-14 organization of the central spindle. During anaphase, γ-TuRC is recruited to the central spindle MT lattice by the Augmin complex. Kinesin-14 associates with the γ-TuRC either before or after the γ-TuRC nucleates MTs. Kinesin-14 transports the γ-TuRC toward the MT minus-ends. The newly nucleated MTs grow toward the midbody during the transport, or γ-TuRC is activated to nucleate MTs once it reaches the separating chromosomes. In this manner, new MTs are sorted parallel to the existing ones, and robust MT bundles form the rigid central spindle that can be cross-linked and stabilized by PRC1.
Because Kinesin-14 proteins are proposed to control proper organization of MT minus-ends at spindle poles [14, 33], we speculated that HSET might sort central spindle MTs by transporting their minus-ends toward the spindle pole. Because the S. pombe Kinesin-14 pkl1 interacts genetically with γ-tubulin [34], we theorized that Kinesin-14s might functionally interact with minus-end MT nucleation factors. To look for potential interactions, we analyzed the sedimentation properties of HSET on sucrose gradients. HSET co-sedimented with importin β in a large peak (~18S), consistent with previous studies showing that importin β co-precipitates with HSET [16]. HSET was also found in a smaller peak (~13S), which coincided with the peak of the γ-tubulin small complex (γ-TuSC) (Figure 4E). We were unable to detect a direct physical association between HSET and γ-tubulin by immunoprecipitation, which may be due to a regulated interaction or because the γ-TuRC is not highly stable in HeLa cell extracts.
Xenopus egg extracts provide an ideal system to look at protein interactions in mitosis because they are highly enriched with mitotic proteins. As HSET is functionally homologous with XCTK2 and phenocopies XCTK2 addition to extracts [16], we tested the association of XCTK2 with the γ-TuRC in egg extracts. While the bulk of the XCTK2 is in a peak that overlaps with importin-α, a known binding partner [35, 36], a small fraction of XCTK2 co-sedimented with γ-TuRC (Figure 4F) at 27S. Furthermore, immunoprecipitation of XCTK2 from extracts showed that it associates with both Xgrip109 and γ-tubulin, two components of the γ-TuRC (Figure 4G), where Xgrip109 was also identified by peptide sequencing as the larger co-precipitating protein with XCTK2 [36]. These data suggest that XCTK2 interacts with the γ-TuRC complex, and that Kinesin-14s may contribute to the organization of the central spindle by directly binding to MT minus-ends.
We propose a model that at the onset of anaphase, MT nucleation sites containing the γ-TuRC are recruited to the central spindle by association with the Augmin complex [10]. Kinesin-14 recognizes the nascent MT nucleation sites through its interaction with γ-TuRC and transports them to the minus-ends of the central spindle MTs proximal to the separating chromatids, consistent with studies showing that γ-tubulin accumulates at the minus-ends of central spindle MTs [29, 30]. The γ-TuRC nucleated MTs grow and are organized by other MT cross-linkers and bundlers to form a rigid central spindle ensemble (Figure 4H). In agreement with this model, the direct interaction between S. pombe Kinesin-14 pkl1 and γ-tubulin [34] was recapitulated with human HSET [37], implying conservation of function between Kinesin-14 family members.
In conclusion, our data demonstrate that a minus-end directed motor contributes to central spindle assembly, and is important for faithful cell division by sorting central spindle MTs to regulate the normal distribution of many central spindle components. Our study complements the current understanding of central spindle assembly by showing that plus-end motors do not function properly in the absence of minus-end directed motors because of defects in central spindle organization. In the future, it will be interesting to uncover the biochemical mechanism by which all of these interactions are controlled.
EXPERIMENTAL PROCEDURES
RNAi
RNAi was performed as previously described [38]. Briefly, HeLa cells were plated at 4×10⁴ cells/well, arrested for 20 h with 2 mM thymidine, released, and transfected with Oligofectamine (Invitrogen) 2 h after release using 200 nM luciferase RNAi negative control #2 oligo (Dharmacon) or 200 nM HSET RNAi oligo [38]. Alternatively, cells were transfected with RNAiMax (Invitrogen) with 20 nM negative control #1 oligo (Dharmacon), 20 nM HSET 3′ UTR #1, or 20 nM HSET 3′ UTR #2 [38]. For all transfections cells were synchronized at 24 h post-transfection by a 19 h thymidine block, released for 11–12 h for progression to late G2, and then processed for immunofluorescence. For 96-well high throughput imaging, cells were transfected as above except that only 4,000 cells were plated per well and were imaged 72 hours post RNAi transfection.
Data analysis
The mean percentage of multi-nucleate cells at 72 h after control or HSET RNAi transfection was determined from ~1500 fixed cells over three independent experiments. Significance was determined with a Student’s t-test in Excel. The total percentage of cleavage furrow regression or chromosome traveling defects from live cell imaging was determined from 708 control cells and 247 HSET RNAi cells.
The average and integrated fluorescence intensities of boxed central spindle proteins were measured with Image J from images that cover all stages of cytokinesis. For each protein, more than 100 cells from three independent experiments were analyzed. For calculation of PRC1, Kif14, Kif4, and CENP-E average fluorescence intensities, background average fluorescence was subtracted using an equivalent size box in the cytoplasm, and the intensities were normalized to control cell staining. To estimate the mean intensity, a histogram of the background-subtracted average intensities from three experiments were graphed, and fit to the standard Gaussian distribution using GraphPad Prism. The mean of the best-fit curve was used to represent the intensity of the protein of interest. Cleavage furrow width was measured using a straight-line from one edge of the furrow to the other. For the PRC1 intensity plots over the cleavage furrow width, data were fit with a single-phase decay curve in Prism.
For MT polymer levels at the spindle midzone, images were scaled equivalently, and the total integrated fluorescence was measured from a box drawn to encompass the midzone or midbody MTs. Background fluorescence was measured with the same box moved to an area outside the cell. Fluorescence intensities were normalized to control cells. Background subtracted integrated fluorescence was used to indicate MT polymer levels, and the mean of the integrated fluorescence was estimated using the method above.
To measure the distribution of FAM29A, images were scaled equivalently. A 50 pixel width line scan was generated in Metamorph at the central spindle along the pole-to-pole axis on the color combined images of MTs and FAM29A. The ratio of FAM29A intensity over MT intensity was calculated from each point along the line scan, and plotted over its normalized position on the midzone in Excel.
Supplementary Material
Acknowledgments
We thank Jim Powers for discussion of findings and critical comments on the manuscript. We thank Wei Jiang for the Kif14 antibody, Tim Yen for the CENP-E antibody, Manjari Mazumdar for the Kif4 antibody, Guowei Fang for the FAM29A antibody, and Yixian Zhang for the Xgrip109 antibody. We thank Neil Ganem for the suggestion of using RNAiMax transfection reagent. The IUB Light Microscopy Imaging Center provided microscopy resources. This work was supported by NIH grant GM59618 (CEW).
Footnotes
Publisher's Disclaimer: This is a PDF file of an unedited manuscript that has been accepted for publication. As a service to our customers we are providing this early version of the manuscript. The manuscript will undergo copyediting, typesetting, and review of the resulting proof before it is published in its final citable form. Please note that during the production process errors may be discovered which could affect the content, and all legal disclaimers that apply to the journal pertain.
References
- 1.Eggert US, Mitchison TJ, Field CM. Animal cytokinesis: from parts list to mechanisms. Annu Rev Biochem. 2006;75:543–566. doi: 10.1146/annurev.biochem.74.082803.133425. [DOI] [PubMed] [Google Scholar]
- 2.Glotzer M. The 3Ms of central spindle assembly: microtubules, motors and MAPs. Nat Rev Mol Cell Biol. 2009;10:9–20. doi: 10.1038/nrm2609. [DOI] [PMC free article] [PubMed] [Google Scholar]
- 3.Inoue YH, Savoian MS, Suzuki T, Mathe E, Yamamoto MT, Glover DM. Mutations in orbit/mast reveal that the central spindle is comprised of two microtubule populations, those that initiate cleavage and those that propagate furrow ingression. J Cell Biol. 2004;166:49–60. doi: 10.1083/jcb.200402052. [DOI] [PMC free article] [PubMed] [Google Scholar]
- 4.Straight AF, Cheung A, Limouze J, Chen I, Westwood NJ, Sellers JR, Mitchison TJ. Dissecting temporal and spatial control of cytokinesis with a myosin II Inhibitor. Science. 2003;299:1743–1747. doi: 10.1126/science.1081412. [DOI] [PubMed] [Google Scholar]
- 5.Jiang W, Jimenez G, Wells NJ, Hope TJ, Wahl GM, Hunter T, Fukunaga R. PRC1: a human mitotic spindle-associated CDK substrate protein required for cytokinesis. Mol Cell. 1998;2:877–885. doi: 10.1016/s1097-2765(00)80302-0. [DOI] [PubMed] [Google Scholar]
- 6.Mollinari C, Kleman JP, Saoudi Y, Jablonski SA, Perard J, Yen TJ, Margolis RL. Ablation of PRC1 by small interfering RNA demonstrates that cytokinetic abscission requires a central spindle bundle in mammalian cells, whereas completion of furrowing does not. Mol Biol Cell. 2005;16:1043–1055. doi: 10.1091/mbc.E04-04-0346. [DOI] [PMC free article] [PubMed] [Google Scholar]
- 7.Buck RC, Tidsale JM. An electron microscopic study of the cleavage furrow in mammalian cells. J Cell Biol. 1962;13:117–125. doi: 10.1083/jcb.13.1.117. [DOI] [PMC free article] [PubMed] [Google Scholar]
- 8.Buck RC, Tisdale JM. The fine structure of the mid-body of the rat erythroblast. J Cell Biol. 1962;13:109–115. doi: 10.1083/jcb.13.1.109. [DOI] [PMC free article] [PubMed] [Google Scholar]
- 9.Riparbelli MG, Callaini G, Glover DM, Avides Mdo C. A requirement for the Abnormal Spindle protein to organise microtubules of the central spindle for cytokinesis in Drosophila. J Cell Sci. 2002;115:913–922. doi: 10.1242/jcs.115.5.913. [DOI] [PubMed] [Google Scholar]
- 10.Uehara R, Nozawa RS, Tomioka A, Petry S, Vale RD, Obuse C, Goshima G. The augmin complex plays a critical role in spindle microtubule generation for mitotic progression and cytokinesis in human cells. Proc Natl Acad Sci U S A. 2009;106:6998–7003. doi: 10.1073/pnas.0901587106. [DOI] [PMC free article] [PubMed] [Google Scholar]
- 11.Wakefield JG, Bonaccorsi S, Gatti M. The drosophila protein asp is involved in microtubule organization during spindle formation and cytokinesis. J Cell Biol. 2001;153:637–648. doi: 10.1083/jcb.153.4.637. [DOI] [PMC free article] [PubMed] [Google Scholar]
- 12.Gaglio T, Saredi A, Bingham JB, Hasbani MJ, Gill SR, Schroer TA, Compton DA. Opposing motor activities are required for the organization of the mammalian mitotic spindle pole. J Cell Biol. 1996;135:399–414. doi: 10.1083/jcb.135.2.399. [DOI] [PMC free article] [PubMed] [Google Scholar]
- 13.Goshima G, Nedelec F, Vale RD. Mechanisms for focusing mitotic spindle poles by minus end-directed motor proteins. J Cell Biol. 2005;171:229–240. doi: 10.1083/jcb.200505107. [DOI] [PMC free article] [PubMed] [Google Scholar]
- 14.Walczak CE, Vernos I, Mitchison TJ, Karsenti E, Heald R. A model for the proposed roles of different microtubule-based motor proteins in establishing spindle bipolarity. Curr Biol. 1998;8:903–913. doi: 10.1016/s0960-9822(07)00370-3. [DOI] [PubMed] [Google Scholar]
- 15.Eggert US, Mitchison TJ. Small molecule screening by imaging. Curr Opin Chem Biol. 2006;10:232–237. doi: 10.1016/j.cbpa.2006.04.010. [DOI] [PubMed] [Google Scholar]
- 16.Cai S, Weaver LN, Ems-McClung SC, Walczak CE. Kinesin-14 family proteins HSET/XCTK2 control spindle length by cross-linking and sliding microtubules. Mol Biol Cell. 2009;20:1348–1359. doi: 10.1091/mbc.E08-09-0971. [DOI] [PMC free article] [PubMed] [Google Scholar]
- 17.Kwon M, Godinho SA, Chandhok NS, Ganem NJ, Azioune A, Thery M, Pellman D. Mechanisms to suppress multipolar divisions in cancer cells with extra centrosomes. Genes Dev. 2008;22:2189–2203. doi: 10.1101/gad.1700908. [DOI] [PMC free article] [PubMed] [Google Scholar]
- 18.Gruneberg U, Neef R, Li X, Chan EH, Chalamalasetty RB, Nigg EA, Barr FA. KIF14 and citron kinase act together to promote efficient cytokinesis. J Cell Biol. 2006;172:363–372. doi: 10.1083/jcb.200511061. [DOI] [PMC free article] [PubMed] [Google Scholar]
- 19.Zhu C, Jiang W. Cell cycle-dependent translocation of PRC1 on the spindle by Kif4 is essential for midzone formation and cytokinesis. Proc Natl Acad Sci U S A. 2005;102:343–348. doi: 10.1073/pnas.0408438102. [DOI] [PMC free article] [PubMed] [Google Scholar]
- 20.Mollinari C, Kleman JP, Jiang W, Schoehn G, Hunter T, Margolis RL. PRC1 is a microtubule binding and bundling protein essential to maintain the mitotic spindle midzone. J Cell Biol. 2002;157:1175–1186. doi: 10.1083/jcb.200111052. [DOI] [PMC free article] [PubMed] [Google Scholar]
- 21.Zhu C, Lau E, Schwarzenbacher R, Bossy-Wetzel E, Jiang W. Spatiotemporal control of spindle midzone formation by PRC1 in human cells. Proc Natl Acad Sci U S A. 2006;103:6196–6201. doi: 10.1073/pnas.0506926103. [DOI] [PMC free article] [PubMed] [Google Scholar]
- 22.Mishima M, Kaitna S, Glotzer M. Central spindle assembly and cytokinesis require a kinesin-like protein/RhoGAP complex with microtubule bundling activity. Dev Cell. 2002;2:41–54. doi: 10.1016/s1534-5807(01)00110-1. [DOI] [PubMed] [Google Scholar]
- 23.Lee YM, Kim W. Kinesin superfamily protein member 4 (KIF4) is localized to midzone and midbody in dividing cells. Exp Mol Med. 2004;36:93–97. doi: 10.1038/emm.2004.13. [DOI] [PubMed] [Google Scholar]
- 24.Carleton M, Mao M, Biery M, Warrener P, Kim S, Buser C, Marshall CG, Fernandes C, Annis J, Linsley PS. RNA interference-mediated silencing of mitotic kinesin KIF14 disrupts cell cycle progression and induces cytokinesis failure. Mol Cell Biol. 2006;26:3853–3863. doi: 10.1128/MCB.26.10.3853-3863.2006. [DOI] [PMC free article] [PubMed] [Google Scholar]
- 25.Nislow C, Lombillo VA, Kuriyama R, McIntosh JR. A plus-end-directed motor enzyme that moves antiparallel microtubules in vitro localizes to the interzone of mitotic spindles. Nature. 1992;359:543–547. doi: 10.1038/359543a0. [DOI] [PubMed] [Google Scholar]
- 26.Zhu C, Bossy-Wetzel E, Jiang W. Recruitment of MKLP1 to the spindle midzone/midbody by INCENP is essential for midbody formation and completion of cytokinesis in human cells. Biochem J. 2005;389:373–381. doi: 10.1042/BJ20050097. [DOI] [PMC free article] [PubMed] [Google Scholar]
- 27.Bluemink JG. Cytokinesis and cytochalasin-induced furrow regression in the first-cleavage zygote of Xenopus laevis. Z Zellforsch Mikrosk Anat. 1971;121:102–126. doi: 10.1007/BF00330921. [DOI] [PubMed] [Google Scholar]
- 28.Zieve GW. Nocodazole and cytochalasin D induce tetraploidy in mammalian cells. Am J Physiol. 1984;246:C154–156. doi: 10.1152/ajpcell.1984.246.1.C154. [DOI] [PubMed] [Google Scholar]
- 29.Julian M, Tollon Y, Lajoie-Mazenc I, Moisand A, Mazarguil H, Puget A, Wright M. gamma-tubulin participates in the formation of the midbody during cytokinesis in mammalian cells. J Cell Sci. 1993;105:145–156. doi: 10.1242/jcs.105.1.145. [DOI] [PubMed] [Google Scholar]
- 30.Shu HB, Li Z, Palacios MJ, Li Q, Joshi HC. A transient association of gamma-tubulin at the midbody is required for the completion of cytokinesis during the mammalian cell division. J Cell Sci. 1995;108:2955–2962. doi: 10.1242/jcs.108.9.2955. [DOI] [PubMed] [Google Scholar]
- 31.Goshima G, Mayer M, Zhang N, Stuurman N, Vale RD. Augmin: a protein complex required for centrosome-independent microtubule generation within the spindle. J Cell Biol. 2008;181:421–429. doi: 10.1083/jcb.200711053. [DOI] [PMC free article] [PubMed] [Google Scholar]
- 32.Zhu H, Coppinger JA, Jang CY, Yates JR, 3rd, Fang G. FAM29A promotes microtubule amplification via recruitment of the NEDD1-gamma-tubulin complex to the mitotic spindle. J Cell Biol. 2008;183:835–848. doi: 10.1083/jcb.200807046. [DOI] [PMC free article] [PubMed] [Google Scholar]
- 33.Surrey T, Nedelec F, Leibler S, Karsenti E. Physical properties determining self-organization of motors and microtubules. Science. 2001;292:1167–1171. doi: 10.1126/science.1059758. [DOI] [PubMed] [Google Scholar]
- 34.Rodriguez AS, Batac J, Killilea AN, Filopei J, Simeonov DR, Lin I, Paluh JL. Protein complexes at the microtubule organizing center regulate bipolar spindle assembly. Cell Cycle. 2008;7:1246–1253. doi: 10.4161/cc.7.9.5808. [DOI] [PubMed] [Google Scholar]
- 35.Ems-McClung SC, Zheng Y, Walczak CE. Importin alpha/beta and Ran-GTP regulate XCTK2 microtubule binding through a bipartite nuclear localization signal. Mol Biol Cell. 2004;15:46–57. doi: 10.1091/mbc.E03-07-0454. [DOI] [PMC free article] [PubMed] [Google Scholar]
- 36.Walczak CE, Verma S, Mitchison TJ. XCTK2: a kinesin-related protein that promotes mitotic spindle assembly in Xenopus laevis egg extracts. J Cell Biol. 1997;136:859–870. doi: 10.1083/jcb.136.4.859. [DOI] [PMC free article] [PubMed] [Google Scholar]
- 37.Simeonov DR, Kenny K, Seo L, Moyer A, Allen J, Paluh JL. Distinct Kinesin-14 mitotic mechanisms in spindle bipolarity. Cell Cycle. 2009:8. doi: 10.4161/cc.8.21.9970. [DOI] [PubMed] [Google Scholar]
- 38.Cai S, O’Connell CB, Khodjakov A, Walczak CE. Chromosome congression in the absence of kinetochore fibres. Nat Cell Biol. 2009;11:832–838. doi: 10.1038/ncb1890. [DOI] [PMC free article] [PubMed] [Google Scholar]
Associated Data
This section collects any data citations, data availability statements, or supplementary materials included in this article.