Abstract
The Otsuka Long-Evans Tokushima Fatty (OLETF) rat, a model of spontaneous type 2 diabetes (T2D), develops hyperglycemic obesity with hyperinsulinemia and insulin resistance after the age of 25 weeks, similar to patients with noninsulin-dependent diabetes mellitus (DM). In the present study, we determined whether there are differences in the pattern of gene expression related to glucose and lipid metabolism between OLETF rats and their control counterparts, Long-Evans Tokushima (LETO) rats. The experiment was done using 35-week-old OLETF and LETO rats. At week 35 male OLETF rats showed overt T2D and increases in blood glucose, plasma insulin, plasma triglycerides (TG) and plasma total cholesterol (TC). Livers of diabetic OLETF and LETO rats also showed differences in expression of mRNA for glucose and lipid metabolism related genes. Among glucose metabolism related genes, GAPDH mRNA was significantly higher and FBPase and G6Pase mRNA were significantly lower in OLETF rats. For lipid metabolism related genes, HMGCR, SCD1 and HL mRNA were substantially higher in OLETF rats. These results indicate that gluconeogenesis in OLETF rats is lower and glycolysis is higher, which means that glucose metabolism might be compensated for by a lowering of the blood glucose level. However, lipid synthesis is increased in OLETF rats so diabetes may be aggravated. These differences between OLETF and LETO rats suggest mechanisms that could be targeted during the development of therapeutic agents for diabetes.
Keywords: OLETF, LETO, Type 2 diabetes, Glucose metabolism, Lipid metabolism, Differential expression
INTRODUCTION
Diabetes mellitus (DM) is a metabolic syndrome that often occurs due to a combination of hereditary and environmental causes and results in abnormally high blood glucose levels [1]. Blood glucose levels are controlled by a complex interaction of multiple chemicals and hormones in the body, including insulin made in the beta cells of the pancreas. DM develops as a result of diminished production of insulin (in type 1 diabetes) or resistance to its effects (in type 2 diabetes (T2D)) [2-5]. Both lead to hyperglycemia, which largely causes the acute signs of diabetes: excessive urine production, resulting compensatory thirst and increased fluid intake, blurred vision, unexplained weight loss, lethargy, and changes in energy metabolism.
T2D is a serious metabolic disease. It is characterized by elevation of the blood glucose level and insulin resistance, and is exacerbated by obesity. There are many causes of T2D. Among them, obesity is the major modifiable risk factor for T2D [6,7]. Obesity enhances insulin resistance [8], a condition characterized by increased insulin production and impaired glucose tolerance [9]. In fact, over 80% of individuals with T2D are obese [10]. Both genetic and environmental factors contribute to the disease, but in the majority of cases the etiology is still not understood [11].
Otsuka Lon-Evans Tokushoma Fatty (OLETF) rats are an animal model of T2D. The characteristic features of OLETF rats are as follows: 1) late onset hyperglycemia (after 25 weeks of age), 2) a chronic disease course, 3) mild obesity, 4) clinical onset of DM mostly in males, 5) a hereditary trait: (a) multiple recessive genes are involved in the induction of DM; (b) the control strain, LETO, appears to share some diabetogenic genes with OLETF rats; 6 islet hyperplasia by newly formed cells, 7) diabetic nephropathy [10,12]. These characteristic pathological features more closely resemble those of human type 2 diabetes than is the case for other diabetogenic animal models.
Here, we investigated changes in OLETF rat in the expression of hepatic genes that are associated with the glucose and lipid metabolism. Hyperglycemia and hyperlipidemia are the major characteristics of T2D. Therefore, we measured the expression of glucose and lipid metabolism related genes. Our goal was to acquire basic data to improve our understanding of the pathophysiology of diabetes and to prepare the groundwork for searching for therapeutic targets of the disease.
METHODS
Animals
Male OLETF rats and their lean non-diabetic counterparts, LETO rats, were supplied by Otsuka Pharmaceutical (Tokushima, Japan). We studied 35-week-old overt type 2 diabetic OLETF rats (n=10). Throughout the entire experimental period, all rats were cared for according to the Guidelines of Animal Experiments recommended by the Korean Academy of Medical Sciences.
Quantitative real-time PCR
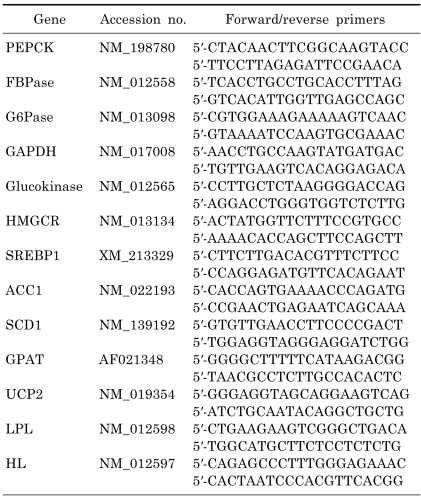
Total RNA was isolated using TRIzol (Invitrogen, Carlsbad, CA, USA). Real-time RT-PCR was carried out with SYBR Green Master mix (Applied Biosystems, Foster City, CA, USA) and 10 pmol/l of primers in a 7300 Real-Time PCR System (Applied Biosystems). We used 18S RNA as the invariant control for all studies. Table 1 shows a list of primers that are used
Table 1.
Primers used for quantitative real-time PCR
Measurement of glucose, insulin and lipid levels
After an 18-h fasting period, all animals were anesthetized with ether, and tail vein blood samples were collected to measure glucose, insulin, total cholesterol and triglyceride levels. The blood sampling line was filled with a solution of 4.5% EDTA to prevent blood clotting. Samples were kept on ice, and plasma was isolated and stored at -20℃ until analysis. Glucose levels were measured with a glucose analyzer (Allmedicus, An-Yang, Korea). Insulin levels were analyzed with rat insulin ELISA kits (Linco Research, St. Charles, MO, USA). Total cholesterol and triglyceride levels were measured with the ASAN Set Total-cholesterol Reagent and TG-S Reagent (ASAN PHARM., Seoul, Korea), respectively.
Measurement of HOMA index
The HOMA index was calculated using the following formula: HOMA index (mU/l)=fasting insulin (mU/l)×serum glucose (mmol/l)/22.5
Histologic analysis
Animals were sacrificed. Removed liver slices were fixed in 10% neutral-buffered formalin and embedded in paraffin. Five µm thick sections were stained with hematoxylin-eosin for histological examination.
Analysis of hepatic lipids
Liver samples were lysed in ethanolic KOH (2 parts EtOH: 1 part 30% KOH) and incubated overnight at 55℃. The lysates were mixed with H2O : EtOH (1 : 1) and centrifuged for 5 min. The supernatant was mixed with 1 M MgCl2, incubated for 10 min on ice, and centrifuged for 5 min. The resulting supernatant was used to measure triglycerides and cholesterol.
Statistical analysis
Results are expressed as means±SEM. Differences between groups were analyzed by paired or non-paired Student's t test. Differences were considered significant when the p value was less than 0.05.
RESULTS
Metabolic parameters of OLETF and LETO rats
To understand the physical characteristics of 35-week-old OLETF and LETO rats, blood glucose, plasma insulin, body weight and food intake were measured (Table 2). OLETF rats showed significantly higher concentrations of blood glucose and plasma insulin than LETO rats. The HOMA index, which reflects insulin resistance, was significantly increased in OLETF rats. Body weight and food intake were also significantly increased in OLETF rats. Taken together, OLETF rats showed the typical characteristics of T2D.
Table 2.
Metabolic parameters of OLETF and LETO rats
Data are means±SEM. *p<0.05, **p<0.01 vs. LETO rats.
Expression of glucose metabolism related genes of OLETF and LETO rats
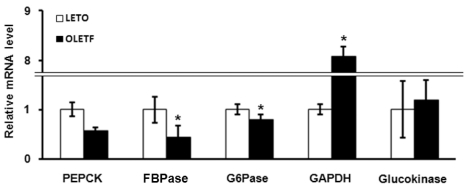
Because OLETF rats appeared hyperglycemia, they showed differential expression of glucose metabolism related genes compared with LETO rats. The expression of gluconeogenesis related genes in OLETF rats was significantly decreased: fructose 1,6-bisphosphatase (FBPase) and glucose-6-phosphatase (G6Pase) (p=0.029 and p=0.003, respectively); there was a substantial but non-significant decrease in Phosphoenolpyruvate carboxykinase (PEPCK) (p=0.078) (Fig. 1). The expression of glycolysis-related genes also showed different patterns. Gene expression of glucokinase was not significantly different between OLETF and LETO rats, but the mRNA level of glyceraldehyde 3-phosphate dehydrogenase (GAPDH) was 8-fold higher in OLETF rats (Fig. 1). These results indicate that gene expression of glucose metabolism related genes in diabetic OLETF rats are altered: genes involved in gluconeogenesis are down-regulated; genes involved in glycolysis are up-regulated.
Fig. 1.
Analysis of expression of glucose metabolism related genes in OLETF and LETO rats by quantitative real-time PCR. Values represent means±SEM of LETO rats (n=10), and OLETF rats (n=10). *p<0.05 vs. LETO rats.
Changes in lipid metabolism in OLETF rats
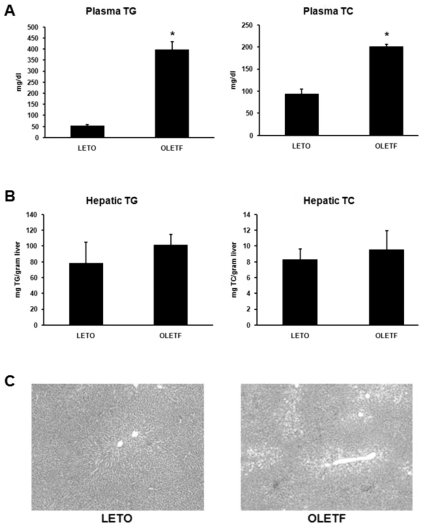
To determine whether lipid metabolism in diabetic OLETF rats is different than in normal LETO rats, we measured the concentrations of plasma TG and TC, and hepatic TG and TC (Fig. 2A and 2B). The concentrations of plasma TG and TC were significantly increased in OLETF rats; the concentrations of hepatic TG and TC in OLETF rats also increased, but these increases were statistically significant. Histologic analysis indicated that the liver of OLETF rats develops moderate fatty changes in the hepatic lobules around the central vein (Fig. 2C).
Fig. 2.
Analysis of lipid distribution. (A) Plasma TG and TC levels of OLETF and LETO rats. Plasma TG and TC levels were significantly higher in OLETF than LETO rats. (B) Hepatic TG and TC levels of OLETF and LETO rats. There were no significant differences in hepatic TG and TC levels between OLETF and LETO rats. (C) Hepatic histology of LETO and OLETF rats (H&E stain, ×40). Values represent means±SEM of LETO rats (n=10), and OLETF rats (n=10). *p<0.05 vs. LETO rats.
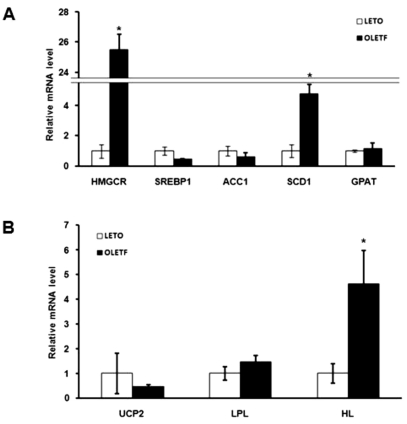
We also looked for differences between diabetic OLETF and normal LETO rats in the expression of genes related to lipid synthesis and transport. We measured major lipid synthesis related genes including - 3-hydroxy-3-methylglutaryl-coenzyme A reductase (HMGCR), Sterol regulatory element-binding protein 1 (SREBP1), acetyl-CoA carboxylase 1 (ACC1), stearoyl-CoA desaturase 1 (SCD1) and glycerol-3-phosphate acyltransferase (GPAT) (Fig. 3A). Expression of the SCD1 gene was 4.7 times higher in OLETF than LETO rats; HMGCR was 25.5 times higher in OLETF rats (Fig. 3A). We measured the expression of fatty acid oxidation and lipid transport related genes including-uncoupling proteins 2 (UCP2), lipoprotein lipase (LPL), and hepatic lipase (HL). Expression of the HL gene was 4.6 times higher in OLETF than LETO rats (Fig. 3B). These results are consistent with the idea that lipid synthesis is up-regulated and that lipid transport to liver is increased in OLETF rats.
Fig. 3.
Analysis of the expression of lipid metabolism related genes by quantitative real-time PCR. (A) mRNA levels of lipid synthesis related genes in OLETF and LETO rats. Expression of HMGCR and SCD1 genes were significantly higher in OLETF than in LETO rats. (B) mRNA levels of fatty acid oxidation and lipid transport related genes in OLETF and LETO rats. The expression of HL was significantly higher in OLETF than LETO rats. Values represent means±SEM of LETO rats (n=10), and OLETF rats (n=10). *p<0.05 vs. LETO rats.
DISCUSSION
DM has become a global problem, and the prevalence of the disease has increased alarmingly in all regions of the world. Obesity is highly correlated with developing a glycemic disorder. The U.S. Centers for Disease Control and Prevention report that nearly 55% of persons with diabetes are obese and 85% are overweight; nearly 80% of persons with type 2 diabetes have insulin resistance, and insulin resistance is itself highly correlated with weight gain [13,14]. Therefore, what is needed is a better understanding of the differences between normal and diabetic conditions, and to develop advanced diabetic agents that target the mechanisms responsible for these differences.
Differential expression of glucose metabolism related genes in our study indicates that gluconeogenesis is down-regulated and glycolysis is up-regulated in diabetic OLETF rats. Regarding genes associated with gluconeogenesis, PEPCK showed a tendency towards a decrease while FBPase and G6Pase were significantly decreased (Fig. 1). FBPase is an enzyme in the liver that converts fructose-1,6-bisphosphate to fructose 6-phosphate in gluconeogenesis. G6Pase is an enzyme that hydrolyzes glucose-6-phosphate and results in the creation of a free phosphate group and a free glucose moiety. FBPase and G6Pase act as a final step in gluconeogenesis, and regulate blood glucose levels. In our study, the down-regulation of gluconeogenesis might compensation for the hyperglycemia. Regarding genes associated with glycolysis, glucokinase was not significantly different in OLETF, while GAPDH was increased (Fig. 1). GAPDH catalyzes the sixth step of glycolysis which breaks down glucose into smaller carbon molecules and produces energy. The up-regulation of glycolysis in OLEtF rats may be a compensatory attempt to reverse the increase in plasma glucose concentration.
OLETF rats not only showed hyperglycemia but also hyperlipidemia. Plasma TG and TC levels of OLETF rats were significantly higher, while hepatic TG and TC showed a tendency towards an increase. Regarding lipid synthesis related genes, HMGCR and SCD1 were significantly increased in OLETF rats. HMGCR is the rate-controlling enzyme of the mevalonate pathway, the metabolic pathway that produces cholesterol and other isoprenoids. Increased mRNA levels of HMGCR explains the high level of plasma TC in OLETF rats. SCD1 is the rate-limiting enzyme catalyzing the synthesis of monounsaturated fatty acids, and increased synthesis of phospholipids, TG and cholesterol esters [15,16]. It suggests that the increased level of SCD1 mRNA in OLETF rats is related to the high plasma concentrations of TG and TC. Interestingly, expression of the HL gene was remarkably increased in OLETF rats. HL has two functions: TG hydrolase and ligand/bridging factor for receptor-mediated lipoprotein uptake [17]. Increased level of HL mRNA in OLETF rats is thought to play a role in lipoprotein uptake which would lower the high concentration of plasma lipid in OLETF rats.
In this study, we found that glucose metabolism in diabetic state might be regulated to restore homeostasis, that is, expression of genes related to glucose metabolism in diabetic rats might be modulated in order to lower blood glucose levels. However, up-regulated expression of lipid synthesis related genes in diabetic rats may exacerbate the diabetic condition. Therefore, we cautiously suggest that inhibitors of lipid synthesis related genes are good targets for amelioration of diabetic pathologic states. These results of differential expression of metabolic genes may be applied to the development of therapeutic targets for diabetes treatment.
ACKNOWLEDGEMENTS
This paper was supported by Dong-A University Research Fund in 2007.
ABBREVIATIONS
- ACC1
acetyl-CoA carboxylase 1
- DM
diabetes mellitus
- FBPase
fructose 1,6-bisphosphatase
- G6Pase
glucose-6-phosphatase
- GAPDH
glyceraldehyde 3-phosphate dehydrogenase
- GPAT
glycerol-3-phosphate acyltransferase
- HL
hepatic lipase
- HMGCR
3-hydroxy-3-methylglutaryl-coenzyme A reductase
- LETO
Long-Evans Tokushima
- LPL
lipoprotein lipase
- OLETF
Otsuka Lon-Evans Tokushoma Fatty
- PEPCK
phosphoenolpyruvate carboxykinase
- SCD1
stearoyl-CoA desaturase 1
- SREBP1
sterol regulatory element-binding protein 1
- T2D
type 2 diabetes
- TC
total cholesterol
- TG
triglyceride
- UCP2
uncoupling proteins 2
References
- 1.Tierney LM, McPhee SJ, Papadakis MA. Current medical Diagnosis & Treatment. Forty-first ed. Lange Medical Books/McGraw-Hill; 2002. Diabetes mellitus; pp. 1203–1215. [Google Scholar]
- 2.Alberti KG, Zimmet PZ. Definition, diagnosis and classification of diabetes mellitus and its complications. Part 1: diagnosis and classification of diabetes mellitus provisional report of a WHO consultation. Diabet Med. 1998;15:539–553. doi: 10.1002/(SICI)1096-9136(199807)15:7<539::AID-DIA668>3.0.CO;2-S. [DOI] [PubMed] [Google Scholar]
- 3.Pozzilli P, Di Mario U. Autoimmune diabetes not requiring insulin at diagnosis (latent autoimmune diabetes of the adult): definition, characterization, and potential prevention. Diabetes Care. 2001;24:1460–1467. doi: 10.2337/diacare.24.8.1460. [DOI] [PubMed] [Google Scholar]
- 4.Tuomi T. Type 1 and type 2 diabetes: what do they have in common? Diabetes. 2005;54:S40–S45. doi: 10.2337/diabetes.54.suppl_2.s40. [DOI] [PubMed] [Google Scholar]
- 5.Pozzilli P, Buzzetti R. A new expression of diabetes: double diabetes. Trends Endocrinol Metab. 2007;18:52–57. doi: 10.1016/j.tem.2006.12.003. [DOI] [PubMed] [Google Scholar]
- 6.Pinkney J. Prevention and cure of type 2 diabetes. BMJ. 2002;325:232–233. doi: 10.1136/bmj.325.7358.232. [DOI] [PMC free article] [PubMed] [Google Scholar]
- 7.Frances A, Patrick R. Type 2 diabetes mellitus: not quite exciting enough? Hum Mol Genet. 2005;13:R21–R31. doi: 10.1093/hmg/ddh066. [DOI] [PubMed] [Google Scholar]
- 8.Olefsky JM, Kolterman OG, Scarlett A. Insulin action and resistance in obesity and noninsulin-dependent type II diabetes mellitus. Am J Physiol Endocrinol Metab. 1982;243:E14–E30. doi: 10.1152/ajpendo.1982.243.1.E15. [DOI] [PubMed] [Google Scholar]
- 9.Reaven GM. Banting lecture 1988. Role of insulin resistance in human disease. Diabetes. 1988;37:1595–1607. doi: 10.2337/diab.37.12.1595. [DOI] [PubMed] [Google Scholar]
- 10.Kawano K, Hirashima S, Mori S, Natori T. OLETF (Otsuka Long-Evans Tokushima Fatty) rat: a new NIDDM rat strain. Diabetes Res Clin Pract. 1994;24:S317–S320. doi: 10.1016/0168-8227(94)90269-0. [DOI] [PubMed] [Google Scholar]
- 11.Jin ES, Burgess SC, Merritt ME, Sherry AD, Malloy CR. Differing mechanisms of hepatic glucose overproduction in triiodothyronine-treated rats vs. Zucker diabetic fatty rats by NMR analysis of plasma glucose. Am J Physiol Endocrinol Metab. 2005;288:E654–E662. doi: 10.1152/ajpendo.00365.2004. [DOI] [PubMed] [Google Scholar]
- 12.Kawano K, Hirashima T, Mori S, Kurosumi M, Saitoh Y, Natori T. Spontaneous long-term hyperglycemic rat with diabetic complications: Otsuka Long-Evans Tokushima fatty (OLETF) strain. Diabetes. 1992;41:1422–1428. doi: 10.2337/diab.41.11.1422. [DOI] [PubMed] [Google Scholar]
- 13.Gerich JE. Is insulin resistance the principal cause of type 2 diabetes? Diabetes Obes Metab. 1999;1:257–263. doi: 10.1046/j.1463-1326.1999.00027.x. [DOI] [PubMed] [Google Scholar]
- 14.Centers for Disease Control and Prevention. Prevalence of overweight and obesity among adults with diagnosed diabetes? United States, 1988-1994 and 1999-2002. Morb Mortal Wkly Rep. 2004;53:1066–1068. [PubMed] [Google Scholar]
- 15.Ntambi JM, Miyazaki M. Recent insights into stearoyl-CoA desaturase-1. Cur Opin Lipidol. 2003;14:255–261. doi: 10.1097/00041433-200306000-00005. [DOI] [PubMed] [Google Scholar]
- 16.Ntambi JM, Miyazaki M. Regulation of stearoyl-CoA desaturases and role in metabolism. Prog Lipid Res. 2004;43:99–104. doi: 10.1016/s0163-7827(03)00039-0. [DOI] [PubMed] [Google Scholar]
- 17.Silvia SF, Herminia G, Lita F, Elke W, Zengxuan N. Hepatic Lipase, Lipoprotein Metabolism, and Atherogenesis. Arterioscler Thromb Vasc Biol. 2004;24:1750–1754. doi: 10.1161/01.ATV.0000140818.00570.2d. [DOI] [PubMed] [Google Scholar]


