Abstract
In order to cryopreserve functional engineered tissues (ETs), the microstructure of the extracellular matrix (ECM) should be maintained as well as the cellular viability since the functionality is closely related to the ECM microstructure. Since the post-thaw ECM microstructure is determined by the deformation of ETs during cryopreservation, freezing-induced deformation of ETs was measured with a newly developed quantum dot (QD)-mediated cell image deformetry system using dermal equivalents as a model tissue. The dermal equivalents were constructed by seeding QD-labeled fibroblasts in type I collagen matrices. After 24 hour incubation, the ETs were directionally frozen by exposing them to a spatial temperature gradient (from 4 °C to −20 °C over a distance of 6 mm). While being frozen, the ETs were consecutively imaged, and consecutive pairs of these images were two-dimensionally cross-correlated to determine the local deformation during freezing. The results showed that freezing induced the deformation of ET, and its magnitude varied with both time and location. The maximum local dilatation was 0.006 s−1 and was always observed at the phase change interface. Due to this local expansion, the unfrozen region in front of the freezing interface experienced compression. This expansion-compression pattern was observed throughout the freezing process. In the unfrozen region, the deformation rate gradually decreased away from the freezing interface. After freezing/thawing, the ET experienced an approximately 28% decrease in thickness and 8% loss in weight. These results indicate that freezing-induced deformation caused the transport of interstitial fluid and the interstitial fluid was extruded. In summary, the results suggest that complex cell-fluid-matrix interactions occur within ETs during freezing, and these interactions determine the post-thaw ECM microstructure and eventual post-thaw tissue functionality.
Keywords: Quantum Dot-Mediated Tissue Deformation Measurement, Cryopreservation, Cryomedicine, Dermal Equivalents, Post-thaw Functionality
INTRODUCTION
As tissue engineering technology develops, reliable long-term preservation technology is highly desired to provide "off-the-shelf" availability of various engineered tissues (ETs) [1,2]. Reliable preservation technology is also desired for more effective storage, banking as well as transportation of ETs. This is one of the critical elements for tissue engineering in order for it to be scaled up from the laboratory to the manufacturing scale [3]. In order to address this need, various preservation techniques have been proposed and studied for a wide variety of biomaterials [4,5]. These techniques include hypothermic preservation, cryopreservation, vitrification, freeze-drying, and desiccation. Although all of the above techniques show promise for tissue preservation, cryopreservation, which preserves biomaterials in the frozen state, is still the primary candidate for long-term storage of ETs considering the limitations of preservation time window, toxicity associated with high concentration of cryoprotective agents, and the feasibility of sublimation and desiccation [6,7].
Several critical challenges, however, should be addressed for successful cryopreservation of ETs. One of the most significant challenges is the lack of consistency in maintaining the functionality of ETs [5]. The functionality is associated with mechanical, optical and transport properties of ETs, and is crucial to the physiological function of ETs. These functional properties are closely related to, or are often determined by, the microstructural integrity of the extracellular matrix (ECM). In order to cryopreserve functional tissue, therefore, its ECM microstructure should be maintained during cryopreservation as well as the cellular viability [8–10].
Freezing/thawing (F/T) of tissue during cryopreservation causes multi-scale biophysical phenomena at the molecular-, cellular- and tissue-levels. The molecular and cellular level freezing-induced biophysical phenomena include: 1) intracellular ice formation (IIF), which is spontaneous ice crystallization of intracellular water during rapid freezing [11,12]; 2) extracellular ice formation (EIF) and consequent osmotic pressure-driven cellular dehydration during slow freezing [13,14]; and 3) the phase change and transition of lipids and proteins [15–18]. Although F/T-induced cellular damage has been explained with the 'two-factor' hypothesis [19], all of these biophysical events are thought to affect the cellular viability post-thaw.
Among the tissue-level phenomena, osmotic pressure-driven water transport between the intracellular and extracellular spaces, and the formation of extracellular ice, which is thought to alter the ECM microstructure, have been investigated. In these studies, the water transport and morphology of the extracellular ice were investigated using small tissue samples or compartment-based models [20–23]. Although these experimental studies provided physical insights on the temporal nature of the EIF, the spatial aspects of the EIF and subsequent damage to the ECM were neglected. Moreover, since the ECM was recognized as a passive scaffold, any interactive roles in the F/T-induced biophysical phenomena were not considered.
A few recent studies suggested that freezing of tissue induces the spatial and temporal redistribution of interstitial fluid, subsequent spatiotemporal ECM swelling, and post-thaw microstructural changes of the ECM [24,25]. These studies are based on the hypothesis that spatiotemporal fluid-matrix interaction is induced during freezing of tissues. This interaction includes: 1) volumetric expansion during water-ice phase change; 2) interstitial fluid transport from the freezing interface; 3) swelling of the unfrozen ECM to accommodate the interstitial fluid; and 4) reciprocal action of the ECM through the interstitial fluid pressure (IFP)-stress balance. The results suggested that freezing might induce complex spatiotemporal interactions between the interstitial fluid and the ECM, and these interactions might cause post-thaw ECM structural alteration. However, these studies were based on observation of the post-thaw ECM microstructure, and the role of cells in this interaction was not considered. Thus, real-time understanding of F/T-induced cell-fluid-matrix interaction is currently lacking in order to measure and/or predict the spatiotemporal deformation of the ECM, which is a direct measure of the post-thaw ECM microstructure. However, quantitative spatiotemporal measurement of this F/T-induced interaction is extremely challenging due to the lack of reliable non-invasive, dynamic, and multi-scale measurement techniques, especially for micro-/meso-scale tissue deformation.
In the present study, a new experimental technique was developed to measure spatiotemporal deformation of an engineered tissue during freezing in order to provide quantitative information on F/T-induced cell-fluid-matrix interaction. As a model ET, dermal equivalent was prepared by seeding quantum dot (QD)-labeled human fibroblast in type I collagen matrix. The ET with QD-labeled cells was imaged during freezing with a fluorescence microscope and further analyzed for micro-/meso-scale tissue deformation. The results are discussed in the context of freezing-induced cell-fluid-matrix interaction relevant to the post-thaw ECM structural changes of tissues. These results will also provide insights to explain the effects of freezing on the functionality of tissues and the tissue-type dependent cryomedicine outcomes.
MATERIALS AND METHODS
Cell Culture and Reagents
Early-passage human foreskin fibroblasts, obtained from Dr. Frederick Grinnell (Department of Cell Biology, University of Texas Southwestern Medical Center), were maintained in culture medium (DMEM/F12, Invitrogen, Grand Island, NY) supplemented with 10% fetal bovine serum, 2 mM L-glutamine, and 100 µg/mL penicillin/streptomycin. The fibroblasts were cultured up to the 15th passage in 75 cm2 T-flasks at 37 °C and 5% CO2. The cells were consistently harvested at 80% confluency by using 0.05% trypsin and 0.53 mM EDTA.
The collected cells were labeled with quantum dots (Qtracker 655, Invitrogen, Carlsbad, CA) according to the protocol suggested by the manufacturer. Briefly, a 10 nM labeling solution was prepared by mixing 1 µL of Qtracker Component A with 1 µL of Qtracker Component B in a 1.5 mL centrifuge tube. The solution was incubated at 37 °C for 5 minutes. 200 µL of complete culture medium was then added to the tube, followed by vortexing for 30 seconds. Subsequently, the cells were added to the tube containing the labeling solution and incubated at 37 °C. The cellular uptake of quantum dots (QDs) generally increased as the incubation time increased. The most rapid uptake was observed in the first 30 minutes, and then the uptake increased linearly with time at a slower rate (data not shown). In the present study, the fibroblasts were labeled for 30 minutes. After incubation the cells were washed twice with complete culture medium to remove excess QDs.
Engineered Tissue with Quantum Dot-Labeled Cells
The QD-labeled cells were suspended in 2 mL of collagen solution prepared from high concentration type I rat tail collagen (BD Biosciences, Bedford, MA) so that the final cell concentration was 2 × 10⁵ cells/mL. The solution contained 3 mg/mL collagen, 10% 10X MEM, 30 mM HEPES, 10 µg/mL penicillin/streptomycin, 2 mM L-glutamine, 6% fetal bovine serum, and 2.3% (v/v of collagen added) 1N sodium hydroxide. Then, distilled water was added to make a total volume of 2 mL. The collagen solution was placed in a 48 × 18 mm chamber slide (Lab-Tek II, Nunc, Naperville, IL) and allowed to polymerize at 37 °C for 60 minutes. After polymerization 2 mL of complete medium was added and the ET was incubated for 24 hours before the freezing procedure. Figure 1 (a) shows that fibroblasts cultured in a collagen matrix develop a dendritic morphology after 24 hours of incubation. As shown in the corresponding fluorescence micrographs, a majority of the cells are still labeled with QDs after 24 hour incubation. Figure 1 (b) clearly shows that QDs accumulate in the intracellular space. After incubation for 24 hours, the ETs contract from initial dimensions of 48.0 × 18.0 mm to 39.1 ± 0.6 × 14.8 ± 0.3 mm (n = 4). The morphology of the fibroblast and extent of collagen gel compaction observed are comparable to those reported elsewhere [26–29]. This implies that the effects of QD labeling are minimal on the behavior of fibroblasts in collagen matrices.
Figure 1.
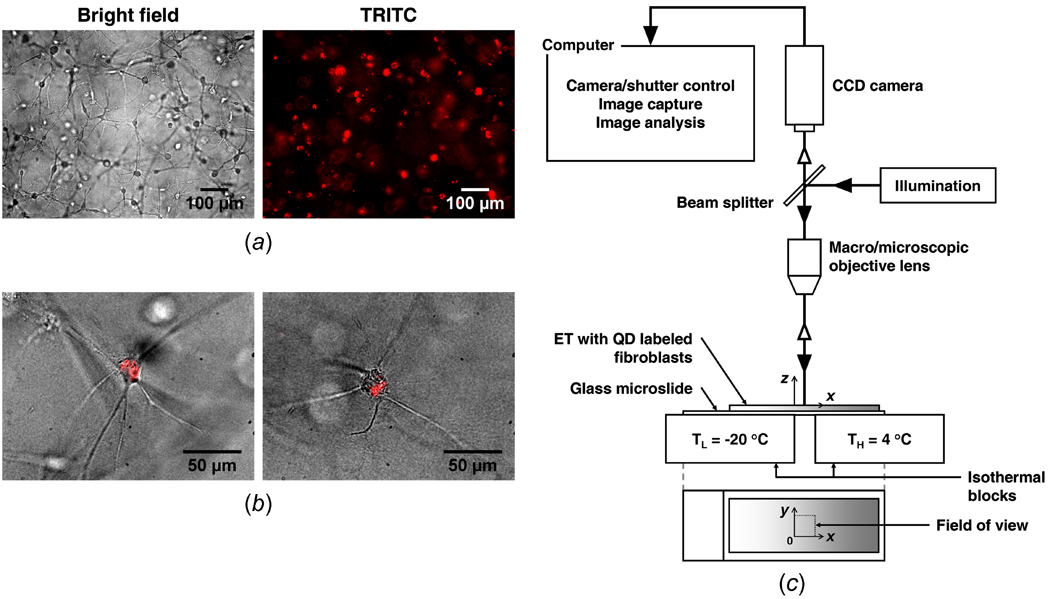
Bright field and fluorescence micrographs of engineered tissue, and schematic of QD-mediated cell image deformetry experimental setup. (a) Fibroblasts, embedded in collagen matrix, have a dendritic morphology and are labeled with quantum dots. (b) The overlays of bright field and TRITC images confirm that quantum dots specifically accumulate in the cytoplasm of fibroblasts. (c) QD-mediated cell image deformetry experimental setup. When engineered tissue is frozen on the directional solidification stage, it is continuously imaged while being illuminated with an excitation light, causing the quantum dots within the embedded fibroblasts to fluoresce.
Deformation Measurement during Freezing
An experimental method, named cell image deformetry (CID), was developed to measure the spatiotemporal deformation of ETs during freezing. The ET was subsequently frozen on a directional solidification stage as depicted in Figure 1 (c). The stage consists of two independently controlled temperature reservoirs separated by a distance of 6 mm. By setting the temperatures of the reservoirs to 4 °C and −20 °C respectively, a spatial temperature gradient was imposed on the ET, causing it to freeze along the x direction. A fluorescence macro/microscope (MVX10, Olympus, Center Valley, PA) equipped with a long working distance objective lens and a TRITC filter was used to visualize the QD-labeled cells of the ET during freezing. The ET was continuously imaged with a 1 second interval using a high sensitivity CCD camera (PIXIS 512, Princeton Instruments, Trenton, NJ). The acquired sequential images were cross-correlated at a 10 second interval to estimate the local deformation rates. For the cross-correlation, consecutive pairs of images at a 10 second interval were divided into 32 pixel × 32 pixel interrogation windows, and were cross-correlated using commercial software (DaVis 7.1, LaVision, Ypsilanti, MI) to determine the local deformation rates (µm/s) in each interrogation window. The experiments were repeated three times to determine the average deformation rates, u and v, along the x and y directions, respectively (n = 3). These deformation rates were analyzed to estimate strain rates (s−1) as follows.
| (1) |
Dilatation (s−1) defined as the rate of area increase per unit area, i.e., expansion, was also computed as follows.
| (2) |
The central difference scheme was used to approximate the spatial derivatives needed to compute the strain rates.
Assessment of Post-Thaw Engineered Tissue Thickness and Weight
The thickness profile of the ET sample was imaged using an optical contact angle measuring system (CAM 101, KSV, Monroe, CT) after F/T. The image was further processed to quantify the ET thickness change. In addition, the weight of the ET was measured before and after F/T using a balance with a precision of 0.1 mg (AV114, Ohaus, Pine Brook, NJ).
Statistical Analysis
Each experiment was repeated at least 3 times (n ≥ 3). The results were presented as mean ± standard error of the mean (SEM). Statistical analysis was performed using one-way ANOVA. P < 0.05 was considered statistically significant.
RESULTS
Figure 2 (a) illustrates the procedures of the image processing to determine the deformation rates. A pair of consecutive fluorescence micrographs at a 10 second interval was obtained, and each image is divided into a grid of 32 × 32 pixel interrogation windows. The cross-correlation function of each interrogation window pair (original and delayed images) is computed as described in [30], and the location of the maximum peak of the cross-correlation function yields the average deformation for a given interrogation area. Dividing by the time interval between images then gives the deformation rate. Note that this process yields the deformation rates in both the x and y directions, i.e., u and v. Since each interrogation window contains multiple cells, the estimated deformation rate is a measure of local ET deformation averaged over the window rather than for individual cell movements. By performing the same process for each interrogation window, a vector field of the deformation rate is determined for the entire plane of the pair of fluorescence images. The deformation vector field overlapped with the corresponding fluorescence micrograph is showed in Figure 2 (b). This result demonstrates that the CID method can quantify the deformation rates of ETs during freezing. Although some scattering and reflection of the QD fluorescence occur in the frozen region, they do not affect the capability of the CID method if the camera is properly focused. Moreover, this overlapped image indicates that the maximum deformation occurs at the location of the freezing interface. This is consistently observed at different points of time during the freezing process. Thus, we use the following criterion to determine the location of the phase change interface at time t, X(t):
| (3) |
The average phase change interface location, X(t), determined by the locus of ∂u/∂x = 0 (n = 3) is shown in Figure 3. Since the freezing configuration of the present experimental setup can be approximated as a moving boundary problem with phase change [31], the interface location is curve-fitted using the analytical Neumann's solution as given below:
| (4) |
where λ is a parameter of the freezing condition, and αS is the thermal diffusivity of ice (1 × 106 µm2/s). The resulting curve fit is shown as a solid line in Figure 3. The parameter λ is determined to be 0.114. X(t) is also plotted against in the inset in Figure 3, where the slope represents λ, and the R2 value is 0.978. Although some discrepancy between the analytical curve fit and the experimental data is observed at early times, the fit generally agrees well with the experimental results.
Figure 2.
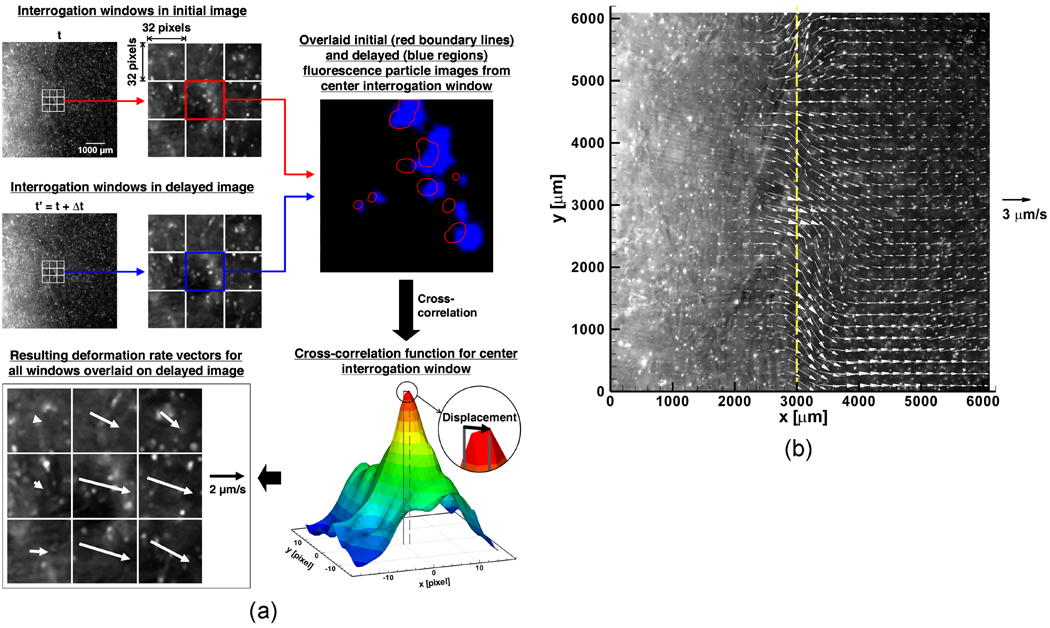
Cell image deformetry analysis flowchart. (a) Two fluorescence micrographs taken 10 seconds apart are divided into a grid of 32 × 32 pixel interrogation windows. The interrogation windows in the initial and delayed images are cross-correlated to produce a map of correlation peaks. The location of the maximum correlation peak provides the two-dimensional displacement vector for the interrogation area. In order to improve the quality of cross-correlation, the delayed interrogation window is shifted toward the estimated deformation direction. (b) A deformation rate vector field is determined for the pair of fluorescence images shown in part (a) by using multi-pass processing with decreasing interrogation window size (1 iteration of 64 × 64 pixels followed by 2 iterations of 32 × 32 pixels) and 50% overlap. Overlaying the fluorescence image with the deformation rate vector field shows that the location of the freezing interface coincides with the location of maximum deformation rates.
Figure 3.
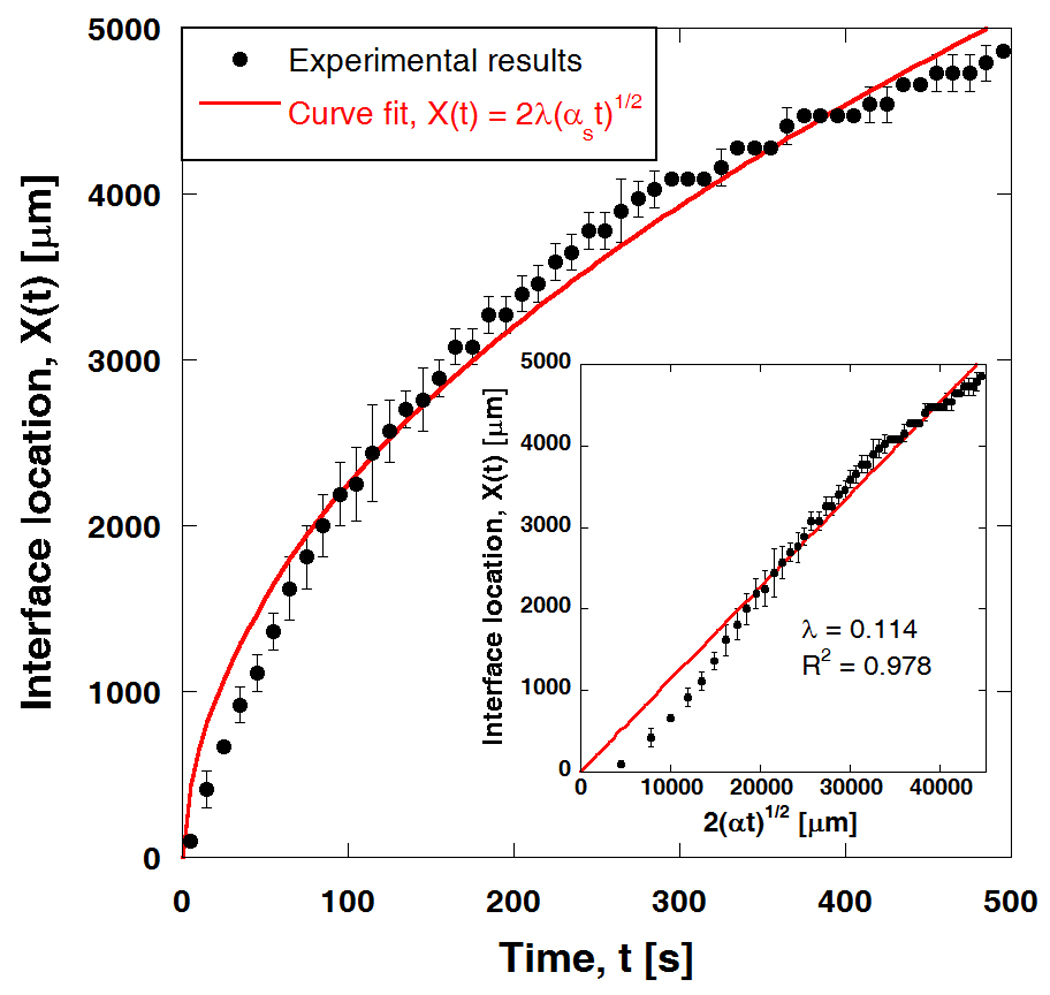
Phase change interface location during freezing and curve fit using analytic Neumann's solution. Interface location is determined from displacement field using ∂u / ∂x = 0 or u = umax (n = 3). Interface location is subsequently curve-fitted to Neumann solution, with αS = 1 × 106 µm2/s (thermal diffusivity of ice), yielding λ = 0.114. Inset shows X(t) plotted against along with a Neumann solution fitting curve (R2 = 0.978).
Figures 4 (a)–(c) show fluorescence micrographs of an ET during directional freezing when X(t) ≈ 1000, 2000 and 4000 µm. Since the cold base is located at x = 0, the freezing interface moves from left to right. The freezing interface is visible in the fluorescence micrographs and is noted with arrows. The interface initially appears to be a sharp front and gradually becomes “mushy” with an apparent thickness as it propagates. During freezing, the movement of the QD-labeled cells, which physically adhere to the ECM, reflects the average local deformation of the ECM. This yields the local details of the non-affine network deformation of the tissue [32].
Figure 4.
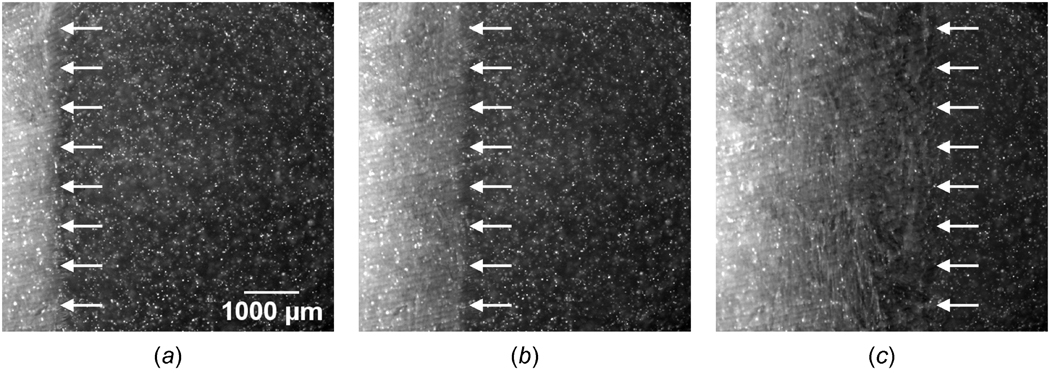
Fluorescence micrographs of engineered tissue when (a) X(t) ≈ 1000 µm, (b) X(t) ≈ 2000 µm, and (c) X(t) ≈ 4000 µm. The phase change interface, denoted by arrows, propagates from left to right while the tissue freezes one-dimensionally.
The corresponding deformation rates experienced by the ET (n = 3) are presented in Figures 5 (a)–(c). The ET undergoes local deformation while it is being frozen. The deformation measured is highly spatiotemporal in nature. As mentioned in regard to Figure 4, the maximum local deformation rate (≈ 2 µm/s) is observed at the freezing interface. In the unfrozen region, the displacement rate gradually decreases away from the interface. These results imply that freezing induces local deformation of the ET in both the frozen and unfrozen zones. The magnitude of the deformation rate varies with both time and location, and the maximum deformation rate is always observed at the phase change interface. Interestingly, even after freezing occurs, deformation is measured. This is probably due to the characteristics of the binary mixture phase change (i.e., water-NaCl) in which the unfrozen fraction of the water-NaCl solution still exists below the freezing temperature of water.
Figure 5.
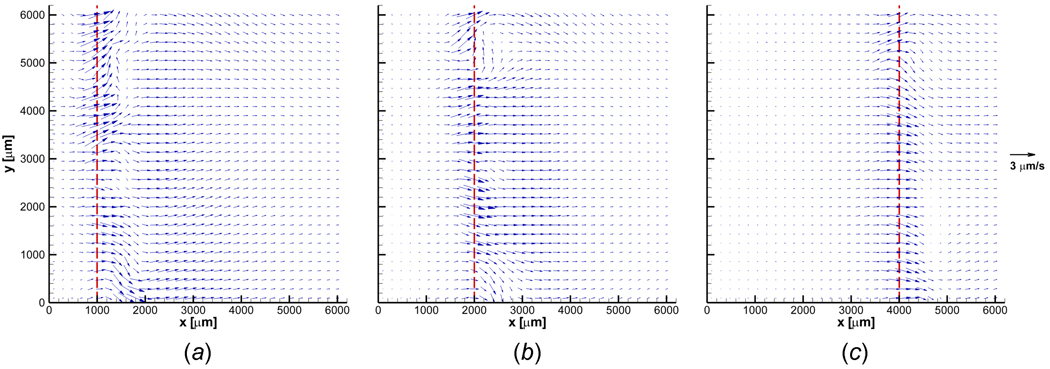
Deformation rate vector fields when (a) X(t) ≈ 1000 µm, (b) X(t) ≈ 2000 µm, and (c) X(t) ≈ 4000 µm. Engineered tissue experiences highly spatiotemporal deformation during freezing. The maximum local deformation rate is observed at the freezing interface. The deformation rate progressively decreases away from the interface in the unfrozen region. A slight to no deformation rate is observed in the frozen region.
Figures 6 (a)–(c) show the corresponding dilatation of the ET (n = 3) when X(t) ≈ 1000, 2000 and 4000 µm. The ET is dilated and compressed during freezing in a highly spatiotemporal manner. Local expansion occurs just after the phase change interface, and the unfrozen region right ahead of the freezing interface shows a resulting compression. This expansion-compression pattern is observed throughout the freezing process. Since the maximum and minimum dilatations are observed adjacent to the freezing interface, these deformations are thought to be induced by freezing. However, the extent of this local deformation varies in time such that the maximum dilatation rate (maximum expansion rate) when X(t) ≈ 1000 µm is approximately 0.006 s−1 and decreases to approximately 0.002 s−1 when X(t) ≈ 4000 µm. Similarly, the minimum dilatation rate (maximum compression rate) varies from about −0.006 to −0.002 s−1 as the interface propagates from X(t) ≈ 1000 to 4000 µm. This deformation with expansion-compression provides new insight into freezing-induced tissue deformation. In addition to the deformation in the xy-plane, z-directional deformation has also been noticed, and it is confirmed by cells moving out of the focal plane (data not shown).
Figure 6.
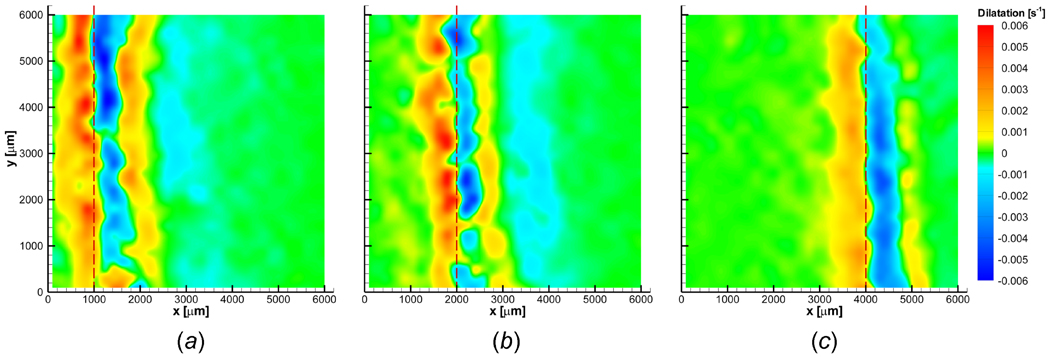
Dilatation contours when (a) X(t) ≈ 1000 µm, (b) X(t) ≈ 2000 µm, and (c) X(t) ≈ 4000 µm. Engineered tissue is dilated and compressed in a highly spatiotemporal fashion during freezing. Engineered tissue experiences local expansion immediately following phase change, and a corresponding local compression is observed concurrently in the unfrozen region. Dilatation is approximately zero at the freezing interface.
Figure 7 shows the deformation rates and dilatation averaged along the y-axis (n = 3) for this nominally one-dimensional process. At the freezing interface, the ET experiences the maximum average horizontal displacement rate. The maximum average deformation rate in the x direction is about 1.8 µm/s and slightly decreases as the interface propagates. The error bars in Figure 7 represent the extent of variation along the y-axis. This variation decreases as the interface continues to advance, implying that the deformation rate becomes more uniform along the y direction (i.e., more one-dimensional) as the propagating interface slows. In addition, a second peak in the average x-deformation rate is measured at a distance of 1000 to 1500 µm ahead of the interface, and this second peak value decreases as the interface continues to propagate with decreasing velocity. As shown in Figure 7 (b), the y-deformation rates also have maxima at the interface. However, the magnitude is significantly smaller than for the x-deformations (< ± 0.5 µm/s) throughout the freezing process. The y-averaged dilatation (n = 3) is shown in Figure 7 (c). Since the major deformation occurs along the x-direction at the freezing interface, approximately zero dilatation is observed at the interface. The maximum average expansion rate (positive dilatation) occurs in the frozen region immediately behind the freezing interface. This peak of average dilatation starts at approximately 0.003 s−1 and decreases to slightly above 0.002 s−1 as the interface moves from X(t) ≈ 1000 to 4000 µm. Meanwhile the maximum average compression rate is measured as approximately −0.002 s−1 in the unfrozen region just ahead of the interface. It is also important to note that the standard variation in the y-averaged dilatation decreases as the interface advances further into the unfrozen region. Moreover, a second peak of average dilatation, which is comparably smaller magnitude than the peak at the freezing interface, takes place in front of the compression in the unfrozen region. This second peak gradually disappears as the interface continues to propagate and decreases in speed.
Figure 7.
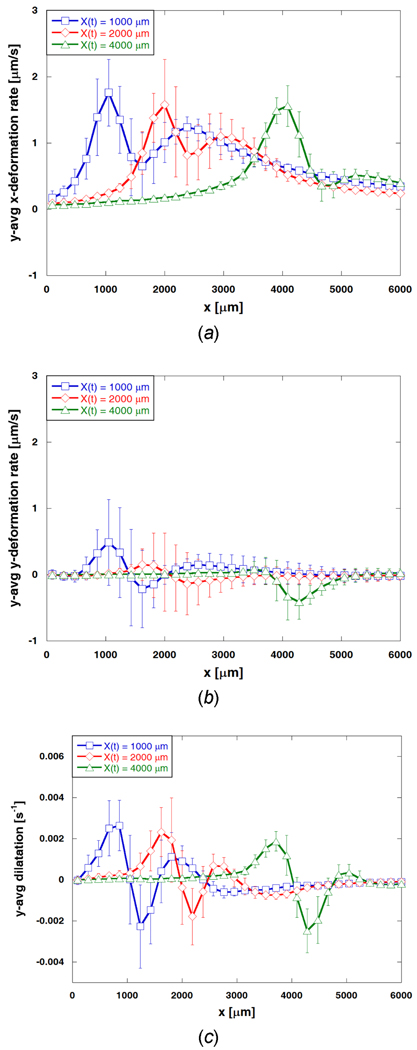
Averaged deformation rates and dilatation profiles. (a) y-averaged x-deformation rate, (b) y-averaged y-deformation rate, and (c) y-averaged dilatation when X(t) ≈ 1000, 2000, and 4000 µm. One-dimensional freezing induces deformation of engineered tissue primarily in the x direction with an average magnitude ranging from 0 to 1.8 µm/s. Average deformation rates in the y direction are much smaller than those in the x direction.
The post-thaw thickness profile of a typical ET sample is shown in Figure 8. The frozen/thawed region is significantly thinner than the unfrozen region (P < 0.005). The unfrozen region has an average thickness of 1.37 ± 0.11 mm (n = 3). That of the frozen region is 0.99 ± 0.06 mm (n = 3), thus representing a 27.7% reduction in thickness after F/T. In addition, the weight of the ET decreases significantly following F/T (P ≪ 0.001). In particular, the ET initially weighs an average of 897.1 ± 10.8 mg (n = 3) and loses 7.8% of its weight after F/T (879.6 ± 11.1 mg; n = 3). A similar thickness change and weight loss after F/T were reported in [33,34]. The thickness change and weight loss are thought to be caused by the efflux of the interstitial fluid during freezing. While ET locally deforms during freezing, the interstitial fluid may flow away from the interface and be extruded from the ET. However, based on our observations, the extruded fluid does not re-hydrate the ET after thawing.
Figure 8.
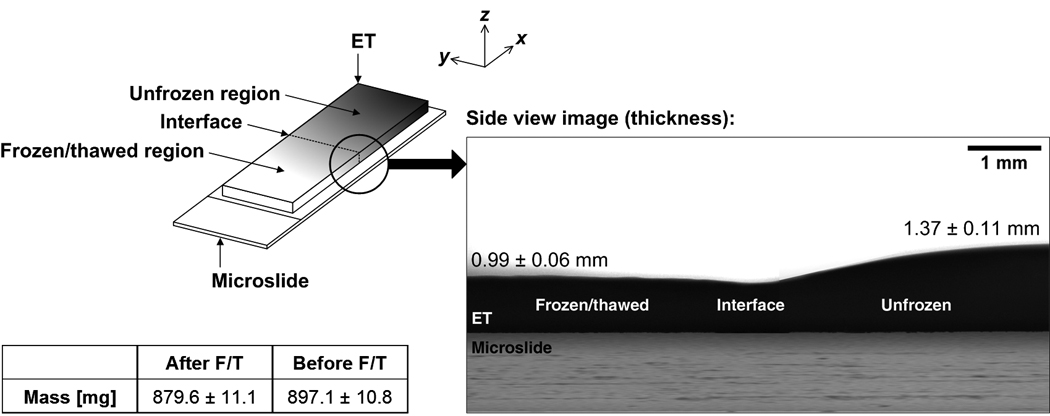
Post-thaw profile of engineered tissue sample. Engineered tissue becomes significantly thinner after freezing and thawing. In addition, engineered tissue experiences a significant loss in mass after freezing and thawing. These changes in thickness and mass are thought to be caused by the efflux of interstitial fluid during freezing and thawing.
DISCUSSION
Freezing-induced Deformation of Engineered Tissue
The present results show that freezing induces the deformation of tissues and the deformation is highly spatial and temporal. Although the majority of previous studies on the effects of freezing of biological tissues [20–23] have focused on addressing its temporal aspects, the present results illustrate that freezing could induce both spatial and temporal deformation of an ET. The maximum local expansion occurs immediately following the freezing interface indicating that expansion is induced by freezing. Since the ET can be approximated as a poroelastic material saturated with interstitial fluid, mainly isotonic saline, its freezing is mainly attributed to the water/ice phase change. Since the expansion associated with ice formation is caused by the water/ice density change, the maximum possible expansion should be approximately 9% (i.e., the ratio of specific volume of ice to that of water = υice/υwater = ρwater/ ρice = (1000 kg/m3)/(920 kg/m3) = 1.09). The maximum freezing-induced tissue expansion measured in the present study (~ 6%) is less than that of ice formation. Even considering that the current methodology is a two-dimensional measurement of three-dimensional phenomena, the measured expansion is still smaller than the volume expansion of water/ice phase change. This may be explained by the following reasons - 1) the interstitial fluid is a mixture of water and other solutes, and its phase change is different from that of pure water; and 2) complex cell-fluid-matrix interactions are associated with local tissue expansion. Even though water is the major component of the interstitial fluid, various solutes are dissolved in the fluid including salts (or electrolytes), carbohydrates, amino acids, and proteins. During freezing, the presence of these solutes affects the phase change behavior, including freezing point depression and eutectic phase change as described in [35,36]. Furthermore, this could lead to osmotic pressure-driven water transport across the cellular membrane.
In addition, complex interactions among cells, interstitial fluid and ECM could affect the volumetric expansion. When tissue undergoes F/T, as proposed in [25], freezing induces interstitial fluid movement. This fluid transport may interact with the ECM as follows: 1) volumetric expansion during water-ice phase change; 2) interstitial fluid transport from the freezing interface; 3) local swelling of the ECM to accommodate the interstitial fluid transport; and 4) reciprocal action of the ECM through the interstitial fluid pressure (IFP)-stress balance. In addition to this fluid-matrix interaction, cells may play various roles in these freezing-induced phenomena which include - 1) cell-fluid interaction: both osmotic and interstitial fluid pressure-driven water transport across the cellular membrane; and 2) cell-matrix interaction: mechanical stress interaction induced by F/T-induced deformation. If the deformation caused by these interactions is beyond the tolerable range, this could lead to a post-thaw change of tissue functionality.
In addition to the expansion due to freezing (water/ice phase change), as mentioned earlier, local compression was observed in the unfrozen region, and was particularly significant in front of the freezing interface. This may be caused by the freezing-induced expansion in the adjacent frozen region. The compression in the unfrozen region may lead to the extrusion of the interstitial fluid out of the ET, which is confirmed by the following observations: 1) The frozen/thawed region is thinner than the unfrozen region; 2) the ET weighs less after freezing than that before freezing; 3) the frozen/thawed ET appears to be more translucent as compared to the unfrozen ET; (4) water accumulates on the outside surface of the ET after F/T. Controlling these freezing-induced spatiotemporal deformation and dehydration phenomena is thought to be critical in maintaining the functionality of ETs throughout cryopreservation protocols.
Measurements by Cell Image Deformetry
Various experimental techniques have been developed to measure micro-scale tissue deformation using various microscopy techniques including differential interference contrast microscopy [37], laser confocal microscopy [38–40], and multiphoton fluorescence microscopy [41]. In addition, tracking the movement of micron-sized fluorescent beads was also employed [42]. Cross-correlation of digital video microscopy was developed in [43] based on bright field or conventional fluorescence microscopy. Other recent studies [44,45] applied the micro-PIV technique to hydrogel deformation (i.e., displacement) measurements, but these studies need a relatively large amount of micron-sized seed particles (~ 1% v/v), which may alter the rheological and mechanical properties of the hydrogels. Many of these techniques are useful to investigate subcellular and cellular level deformation, but their effectiveness is limited - 1) when ice crystals are formed within the tissues; and 2) by photobleaching of conventional fluorescence dyes.
Cell image deformetry has been shown in our study to be a feasible method for measuring freezing-induced deformation in engineered tissues spatially and temporally. It combines a high-resolution time-lapse digital microscopy system with particle image velocimetry (PIV), a well-established digital image correlation technique for measuring continuum deformations (or velocities). The major advantage of the method lies in the fact that it is a non-intrusive optical visualization technique. No physical probe is used for measurement purposes, and the sample is not perturbed by the measuring instrument. Since the seed particles used are QD-labeled cells physically adhered to the ECM, no foreign tracking particles are introduced that may undesirably alter the mechanical properties of the sample examined. As the tissue deforms on the microscale level during freezing, the embedded cells respond and move correspondingly, yielding information about the degree of deformation of their local environment. The capability of the method to continuously monitor the movement of the cells embedded in the collagen matrix during freezing makes it possible to visualize the phenomenon of freezing-induced tissue deformation in real time. Digital image cross-correlation is then used to determine the extent of local tissue deformation quantitatively. In addition, the fluorescent labels used (i.e., QDs) are specific (i.e., cell-targeting) and robust for imaging purposes. The fluorescence signal of the QDs, unlike other fluorophores, is stable and resistant to photobleaching.
ACKNOWLEDGMENT
This work is supported by Grant R01 EB008388 from NIH/NIBIB and Grant CBET-0747631 from NSF. We thank Dr. Hyejin Moon at UT-Arlington for her help with the optical contact angle measuring system.
REFERENCES
- 1.Nerem RM. Tissue Engineering: The Hope, the Hype, and the Future. Tissue Engineering. 2006;12(5):1143–1150. doi: 10.1089/ten.2006.12.1143. [DOI] [PubMed] [Google Scholar]
- 2.Pancrazio JJ, Wang F, Kelley CA. Enabling Tools for Tissue Engineering. Biosensors & Bioelectronics. 2007;22(12):2803–2811. doi: 10.1016/j.bios.2006.12.023. [DOI] [PubMed] [Google Scholar]
- 3.Archer R, Williams DJ. Why Tissue Engineering Needs Process Engineering. Nature Biotechnology. 2005;23(11):1353–1355. doi: 10.1038/nbt1105-1353. [DOI] [PubMed] [Google Scholar]
- 4.Coger R, Toner R. The Biomedical Engineering Handbook. Boca Raton: CRC Press; 1995. pp. 1567–1577. [Google Scholar]
- 5.Han B, Bischof JC. Engineering Challenges in Tissue Preservation. Cell Preservation Technology. 2004;2:91–112. [Google Scholar]
- 6.Karlsson JOM, Toner M. Long-Term Storage of Tissues by Cryopreservation: Critical Issues. Biomaterials. 1996;17(3):243–256. doi: 10.1016/0142-9612(96)85562-1. [DOI] [PubMed] [Google Scholar]
- 7.Karlsson JOM, Toner M. Principles of Tissue Engineering. San Diego, CA: Academic Press; 2000. pp. 293–307. [Google Scholar]
- 8.Schenke-Layland K, Madershahian N, Riemann I. Impact of Cryopreservation on Extracellular Matrix Structures of Heart Valve Leaflets. The Annals of Thoracic Surgery. 2006;81(3):918–926. doi: 10.1016/j.athoracsur.2005.09.016. [DOI] [PubMed] [Google Scholar]
- 9.Schenke-Layland K, Xie J, Heydarkhan-Hagvall S. Optimized Preservation of Extracellular Matrix in Cardiac Tissues: Implications for Long-Term Graft Durability. The Annals of Thoracic Surgery. 2007;83(5):1641–1650. doi: 10.1016/j.athoracsur.2006.12.005. [DOI] [PubMed] [Google Scholar]
- 10.Narine K, Ing EC, Cornelissen M. Readily Available Porcine Aortic Valve Matrices for Use in Tissue Valve Engineering. Is Cryopreservation an Option? Cryobiology. 2006;53(2):169–181. doi: 10.1016/j.cryobiol.2006.05.007. [DOI] [PubMed] [Google Scholar]
- 11.Toner M. Advances in Low-Temperature Biology. London: JAI Press; 1993. pp. 1–51. [Google Scholar]
- 12.Karlsson JOM, Cravalho EG, Toner M. A Model of Diffusion-Limited Ice Growth Inside Biological Cells during Freezing. Journal of Applied Physics. 1994;75:4442–4445. [Google Scholar]
- 13.Fahy GM. Analysis of "Solution Effects" Injury. Equations for Calculating Phase Diagram Information for the Ternary Systems NaCl-Dimethylsulfoxide-Water and NaCl-Glycerol-Water. Biophysical Journal. 1980;32(2):837–850. doi: 10.1016/S0006-3495(80)85019-3. [DOI] [PMC free article] [PubMed] [Google Scholar]
- 14.Pegg DE, Diaper MP. The "Unfrozen Fraction" Hypothesis of Freezing Injury to Human Erythrocytes: A Critical Examination of the Evidence. Cryobiology. 1989;26(1):30–43. doi: 10.1016/0011-2240(89)90031-x. [DOI] [PubMed] [Google Scholar]
- 15.Caffrey M. The Combined and Separate Effects of Low Temperature and Freezing on Membrane Lipid Mesomorphic Phase Behavior: Relevance to Cryobiology. Biochimica Et Biophysica Acta. 1987;896(1):123–127. doi: 10.1016/0005-2736(87)90365-8. [DOI] [PubMed] [Google Scholar]
- 16.Crowe JH, Hoekstra FA, Crowe LM. Lipid Phase Transitions Measured in Intact Cells with Fourier Transform Infrared Spectroscopy. Cryobiology. 1989;26(1):76–84. doi: 10.1016/0011-2240(89)90035-7. [DOI] [PubMed] [Google Scholar]
- 17.Jameel F, Bogner R, Mauri F. Investigation of Physicochemical Changes to L-Asparaginase during Freeze-Thaw Cycling. The Journal of Pharmacy and Pharmacology. 1997;49(5):472–477. doi: 10.1111/j.2042-7158.1997.tb06826.x. [DOI] [PubMed] [Google Scholar]
- 18.Pikal-Cleland KA, Rodriguez-Hornedo N, Amidon GL. Protein Denaturation during Freezing and Thawing in Phosphate Buffer Systems: Monomeric and Tetrameric Beta-Galactosidase. Archives of Biochemistry and Biophysics. 2000;384(2):398–406. doi: 10.1006/abbi.2000.2088. [DOI] [PubMed] [Google Scholar]
- 19.Mazur P. Cryobiology: The Freezing of Biological Systems. Science (New York, N.Y.) 1970;168(934):939–949. doi: 10.1126/science.168.3934.939. [DOI] [PubMed] [Google Scholar]
- 20.Bischof J, Hunt CJ, Rubinsky B. Effects of Cooling Rate and Glycerol Concentration on the Structure of the Frozen Kidney: Assessment by Cryo-Scanning Electron Microscopy. Cryobiology. 1990;27(3):301–310. doi: 10.1016/0011-2240(90)90029-4. [DOI] [PubMed] [Google Scholar]
- 21.Hong JS, Rubinsky B. Patterns of Ice Formation in Normal and Malignant Breast Tissue. Cryobiology. 1994;31(2):109–120. doi: 10.1006/cryo.1994.1015. [DOI] [PubMed] [Google Scholar]
- 22.Pazhayannur PV, Bischof JC. Measurement and Simulation of Water Transport during Freezing in Mammalian Liver Tissue. Journal of Biomechanical Engineering. 1997;119(3):269–277. doi: 10.1115/1.2796091. [DOI] [PubMed] [Google Scholar]
- 23.Muldrew K, Novak K, Yang H. Cryobiology of Articular Cartilage: Ice Morphology and Recovery of Chondrocytes. Cryobiology. 2000;40(2):102–109. doi: 10.1006/cryo.2000.2236. [DOI] [PubMed] [Google Scholar]
- 24.Han B, Grassl ED, Barocas VH. A Cryoinjury Model using Engineered Tissue Equivalents for Cryosurgical Applications. Annals of Biomedical Engineering. 2005;33(7):972–982. doi: 10.1007/s10439-005-3478-z. [DOI] [PubMed] [Google Scholar]
- 25.Han B, Miller JD, Jung JK. Freezing-Induced Fluid-Matrix Interaction in Poroelastic Material. Journal of Biomechanical Engineering. 2009;131(2):021002. doi: 10.1115/1.3005170. [DOI] [PMC free article] [PubMed] [Google Scholar]
- 26.Rhee S, Grinnell F. Fibroblast Mechanics in 3D Collagen Matrices. Advanced Drug Delivery Reviews. 2007;59(13):1299–1305. doi: 10.1016/j.addr.2007.08.006. [DOI] [PMC free article] [PubMed] [Google Scholar]
- 27.Tamariz E, Grinnell F. Modulation of Fibroblast Morphology and Adhesion during Collagen Matrix Remodeling. Molecular Biology of the Cell. 2002;13(11):3915–3929. doi: 10.1091/mbc.E02-05-0291. [DOI] [PMC free article] [PubMed] [Google Scholar]
- 28.Grinnell F. Fibroblasts, Myofibroblasts, and Wound Contraction. The Journal of Cell Biology. 1994;124(4):401–404. doi: 10.1083/jcb.124.4.401. [DOI] [PMC free article] [PubMed] [Google Scholar]
- 29.Bell E, Ivarsson B, Merrill C. Production of a Tissue-Like Structure by Contraction of Collagen Lattices by Human Fibroblasts of Different Proliferative Potential in Vitro. Proceedings of the National Academy of Sciences. 1979;76(3):1274–1278. doi: 10.1073/pnas.76.3.1274. [DOI] [PMC free article] [PubMed] [Google Scholar]
- 30.Raffel M. Particle image velocimetry: a practical guide. New York: Springer; 2007. pp. 86–88. [Google Scholar]
- 31.Özisik MN. Heat conduction. New York: Wiley; 1993. pp. 405–408. [Google Scholar]
- 32.Pedersen JA, Swartz MA. Mechanobiology in the Third Dimension. Annals of Biomedical Engineering. 2005;33(11):1469–1490. doi: 10.1007/s10439-005-8159-4. [DOI] [PubMed] [Google Scholar]
- 33.Venkatasubramanian RT, Grassl ED, Barocas VH. Effects of Freezing and Cryopreservation on the Mechanical Properties of Arteries. Annals of Biomedical Engineering. 2006;34(5):823–832. doi: 10.1007/s10439-005-9044-x. [DOI] [PubMed] [Google Scholar]
- 34.Devireddy RV, Neidert MR, Bischof JC. Cryopreservation of Collagen-Based Tissue Equivalents. I. Effect of Freezing in the Absence of Cryoprotective Agents. Tissue Engineering. 2003;9(6):1089–1100. doi: 10.1089/10763270360728008. [DOI] [PubMed] [Google Scholar]
- 35.Han B, Bischof JC. Thermodynamic Nonequilibrium Phase Change Behavior and Thermal Properties of Biological Solutions for Cryobiology Applications. Journal of Biomechanical Engineering. 2004;126(2):196–203. doi: 10.1115/1.1688778. [DOI] [PubMed] [Google Scholar]
- 36.Han B, Choi JH, Dantzig JA. A Quantitative Analysis on Latent Heat of an Aqueous Binary Mixture. Cryobiology. 2006;52(1):146–151. doi: 10.1016/j.cryobiol.2005.09.007. [DOI] [PubMed] [Google Scholar]
- 37.Petroll WM, Ma L. Direct, Dynamic Assessment of Cell-Matrix Interactions Inside Fibrillar Collagen Lattices. Cell Motility and the Cytoskeleton. 2003;55(4):254–264. doi: 10.1002/cm.10126. [DOI] [PubMed] [Google Scholar]
- 38.Roeder BA, Kokini K, Robinson JP. Local, Three-Dimensional Strain Measurements within Largely Deformed Extracellular Matrix Constructs. Journal of Biomechanical Engineering. 2004;126(6):699–708. doi: 10.1115/1.1824127. [DOI] [PubMed] [Google Scholar]
- 39.Petroll WM, Cavanagh HD, Jester JV. Dynamic Three-Dimensional Visualization of Collagen Matrix Remodeling and Cytoskeletal Organization in Living Corneal Fibroblasts. Scanning. 2004;26(1):1–10. doi: 10.1002/sca.4950260102. [DOI] [PubMed] [Google Scholar]
- 40.Kim A, Lakshman N, Petroll WM. Quantitative Assessment of Local Collagen Matrix Remodeling in 3-D Culture: The Role of Rho Kinase. Experimental Cell Research. 2006;312(18):3683–3692. doi: 10.1016/j.yexcr.2006.08.009. [DOI] [PMC free article] [PubMed] [Google Scholar]
- 41.Huang H, Dong CY, Kwon HS. Three-Dimensional Cellular Deformation Analysis with a Two-Photon Magnetic Manipulator Workstation. Biophysical Journal. 2002;82(4):2211–2223. doi: 10.1016/S0006-3495(02)75567-7. [DOI] [PMC free article] [PubMed] [Google Scholar]
- 42.Roy P, Petroll WM, Cavanagh HD. An in Vitro Force Measurement Assay to Study the Early Mechanical Interaction between Corneal Fibroblasts and Collagen Matrix. Experimental Cell Research. 1997;232(1):106–117. doi: 10.1006/excr.1997.3511. [DOI] [PubMed] [Google Scholar]
- 43.Wang CC, Deng JM, Ateshian GA. An Automated Approach for Direct Measurement of Two-Dimensional Strain Distributions within Articular Cartilage Under Unconfined Compression. Journal of Biomechanical Engineering. 2002;124(5):557–567. doi: 10.1115/1.1503795. [DOI] [PubMed] [Google Scholar]
- 44.Olsen MG, Bauer JM, Beebe DJ. Particle Imaging Technique for Measuring the Deformation Rate of Hydrogel Microstructures. Applied Physics Letters. 2000;76(22):3310–3312. [Google Scholar]
- 45.Johnson BD, Bauer JM, Niedermaier DJ. Experimental Techniques for Mechanical Characterization of Hydrogels at the Microscale. Experimental Mechanics. 2004;44(1):21–28. [Google Scholar]


