

Abstract
Gold microelectrode arrays functionalized with Dithiobis(succinimidyl propionate) self-assembled monolayer (SAM) have been used to fabricate an ultrasensitive, disposable, electrochemical cortisol immunosensor. Cortisol specific monoclonal antibody (C-Mab) was covalently immobilized on the surface of gold microelectrode array and the sensors were exposed to solutions with different cortisol concentration. After C-Mab binding, unreacted active groups of DTSP were blocked using ethanol amine (EA) and label-free electrochemical impedance (EIS) technique was used to determine cortisol concentration. EIS results confirmed that EA/C-Mab/DTSP/Au based biosensor can accurately detect cortisol in the range of 1 pM to 100 nM. The biosensor was successfully used for measurement of cortisol in interstitial fluid in-vitro. This research establishes the feasibility of using impedance based biosensor architecture for disposable, wearable cortisol detector.
Keywords: Cortisol, self assembled monolayer, electrochemical impedance, immunosensor, Dithiobis(succinimidyl propionate), disposable biosensor
1. Introduction
Cortisol, a steroid hormone, is a biomarker for numerous diseases and is important for the regulation of blood pressure, glucose levels, and carbohydrate metabolism, within the physiological limit (Zhou et al., 2004; Tai and Welch, 2004; Stevens et al., 2008). Abnormal increase in cortisol level inhibits inflammation, depresses immune system, increases fatty and amino acid levels in blood. In addition, while excess cortisol levels contribute to the development of Cushing's disease with the symptoms of obesity, fatigue and bone fragility, decreased cortisol levels lead to Addison's disease which is manifested by weight loss, fatigue, and darkening of skin folds and scars (Zhou et al., 2004; Stevens et al., 2008).
Cortisol in blood primarily exists in a bound state with corticosteroid-binding globulin (CBG). It has been reported that while nearly 90% of cortisol is bound, about 10% of it exists in a free biologically active form (Cook et al., 1997) and can also be found in bodily fluids like saliva, urine and interstitial fluids. Normal level of cortisol in serum is generally in the 100-500 nM range. There is good correlation in the amount of free cortisol present in the saliva and the total cortisol present in the blood (Gozansky et al., 2005), however, free cortisol levels in saliva and urine are up to 100-fold lower than in serum (Morineau et al., 1997; Levin et al., 2007).
There has been growing interest in measurement of cortisol to establish whether cortisol variation can be used as a precursor to medically and psychologically relevant events, the most recent affliction being Post-traumatic stress disorder (PTSD) (Hauer, et al., 2009; Lindley et al., 2004). Measurement of cortisol requires reliable and accurate collection of any body fluid, e.g., blood, saliva, or urine. Blood collection, however, requires trained medical personnel. Additionally, the trauma of venipuncture results in much reduced patient participation. Hence, researchers have been exploring non-invasive/minimally invasive techniques that ensure (a) high fidelity samples (cortisol is a small molecule that diffuses rapidly) (b) minimal patient participation in the sample handling process and trauma. These efforts have resulted in researchers exploring completely non-invasive sampling: (a) saliva or (b) urine for the free cortisol concentration estimation (Cook et al., 1997; Mitchell et al., 2009; Rowe et al., 2007; Gatti et al., 2005). The need for the patient to collect samples at odd hours however adds to additional stress, thereby adding a bias constituent to the results. Collection of interstitial fluid (ISF) or transdermal body fluid (TDF) is a technique which, while minimally invasive, does not require the patient's compliance as a simple harvesting device is attached to the patients. These harvesting devices can harvest ISF continually over 3-4 days without any additional compliance from the patient (Nindl et al., 2006). The use of ISF collection approach necessitates development of a wearable biosensing technique that can accurately measure cortisol in ISF. This paper reports on the development of such a cortisol biosensor.
ISF is an extra cellular fluid that surrounds the cells in the human body and consists of small and moderate sized molecules, including glucose, ethanol, and cortisol. The homeostatic feedback loop in the body ensures that these molecules have a direct correlation to the concentration of molecules in blood (Stout et al., 1999; Bentle and Thomas, 1997; Knoll et al., 2002). ISF is especially attractive for cortisol monitoring, as it can be drawn continuously from the dermis through an ablated stratum corneum by simply applying a small amount of vacuum.
Currently, in clinical practice, total cortisol, which is the sum of free and protein bound fractions, is measured, however, free cortisol is the only biologically active fraction (Levin et al., 2007; Stevens et al., 2008). Hence, in order to diagnose and properly treat cortisol-related conditions, regular estimation of free cortisol is required. Current techniques for estimation of free cortisol e.g. High Performance Liquid Chromatography (HPLC) (Oka et al., 1987); fluorometric assay (Appel et al., 2005); and reverse phase chromatography (Gatti et al., 2005); require long analysis time, are expensive, and cannot be implemented at point of care. Alternate techniques of cortisol detection including radioimmunoassay (RIA), flow immunoassay and enzyme-linked immunosorbent assay, (ELISA) (Cook et al., 1997; Zhou et al., 2004; Schmaldng et al., 1995; Kaptein et al., 1997; Koutny et al., 1996; Sarkar et al., 2007) are reliable and accurate. However, these approaches are laborious, time-consuming, require large sample volume and involve the use of radioisotopes.
Free cortisol can be measured experimentally by equilibrium dialysis and ultra filtration techniques (Jerkunica et al., 1980; Vogeser et al., 2007), or it can be derived by calculation from Coolens equations (Dorin et al., 2009). However, these methods are cumbersome as estimation requires assaying of both total cortisol and CBG on the same sample requiring 5ml of blood per assay. Recently, various biosensors have been reported for cortisol estimation (Stevens et al., 2008; Mitchell et al., 2009; (Kumar et al., 2007; Sun et al., 2008; Zhou et al., 2004). However, all of these involve complicated system, tedious fabrication, indirect cortisol estimation, measurement at very high voltages or modification of analyte itself.
Biosensor development using self-assembled monolayers (SAM) and electrochemical techniques have gained increased attention in recent years (Arya et al., 2007a,b; Valera et al., 2007; Geng et al., 2008; Chen et al., 2006; Maalouf et al., 2007; Khan and Dhayal, 2009; Loyprasert et al., 2008, 2010; Kim et al., 2010; Weng et al., 2010; Ng et al., 2010). SAM formation allows the binding of biomolecules in the closest vicinity of electrode surface, and electrochemical detection technique results in enhanced sensitivity, fast response, low cost and portability. The use of electrochemical impedance spectroscopy (EIS) coupled with SAMs is promising as they allow for the possibility of recording of direct signatures of bio-recognition events, occurring at the electrode surfaces through changes in capacitance and resistance (Azcon et al., 2008).
In EIS, when a biological receptor binds to its counterpart, the measurement of changed impedance enables direct and label-free measurement. The data points are generated using a small perturbation in signal, that reduces the matrix interference (Katz and Willer, 2003; Barsoukov and MacDonald, 2005). The main drawback of EIS, however, is decreased sensitivity and lower detection limits. This can be overcome through the use of microelectrodes. Microelectrodes also lead to lower detection limits and minimization of an interference effect coming from non-target analytes (Laschi and Mascini 2006; Hagelsieb et al., 2007; Thomas et al., 2004; Radke and Alocilja., 2005; Valera et al., 2007).
In this work, we report on a successful fabrication of a label-free impedance based immunosensor for ultrasensitive cortisol testing. SAM formation utilized the Dithiobis(succinimidyl propionate) (DTSP), which was used for an antibody immobilization onto Au micro array electrode. The sensor was tested with ISF and the measurements were compared to ELISA. This biosensor enabled cortisol detection upto 1 pM within the 40 minutes analysis time
2. Materials and methods
2.1. Chemicals and reagents
Dithiobis(succinimidyl propionate) (DTSP) and sodium borohydride (NaBH4) were purchased from ThermoFisher Scientific. Monoclonal cortisol antibody (anti-cortisol, C-Mab) 2330-4809 was procured from Abd serotec. Phosphate buffered saline and hydrocortisone (cortisol) were purchased from Sigma Aldrich. SU-8 resist was purchased from Microchem Corp. All other chemicals were of analytical grade and were used without further purification. Working solutions of hydrocortisone were prepared by dilution in phosphate buffer saline (PBS) (10 mM, pH 7.4). Commercially available Cortisol Luminescence Competitive Immunoassay manufactured by IBL, Hamburg was used for the human ISF sample analysis which was performed by the Systems Laboratory (Dr. Clemens Kirschbaum) in Dresden, Germany.
2.2. Measurement and apparatus
Electrochemical impedance (EIS) was utilized to characterize the EA/C-Mab/DTSP/Au bio-electrodes and to estimate cortisol as a function of its concentration. EIS measurements were carried out at equilibrium potential called open circuit potential (OCP) without bias voltage in the frequency range of 0.1–105 Hz with a 5 mV amplitude using Autolab Potentiostat/Galvanostat (Eco Chemie, Netherlands). Three-electrode cell configuration with Ag/AgCl as reference electrode and the gold electrode as a counter electrode was used for measurements. EIS measurements were carried out using 30 μl of phosphate buffer saline (PBS) solution (10 mM, pH 7.4) containing mixture of 5 mM (Ferrocyanide) and 5 mM of (Ferricyanide) i.e. 5 mM as a redox probe. Using the redox probe (5 mM ), change in charge transfer resistance at electrode/electrolyte interface has been investigated in electrochemical impedance.
2.3. Fabrication of test chip
The biosensor chips were fabricated on an oxidized 4” silicon wafer using standard photolithography techniques (Sun et al., 2008). Briefly, Cr/Au (200/2000 Å) and Cr/Ag (200/3000 Å) layers deposited using evaporation and were patterned, through liftoff. Gold micro electrode arrays with 5μm wide electrode fingers at a pitch of 15 μm were used. As a final step, SU8 chamber patterned around the electrodes using SU8 50 to create a sample well around these electrodes (Fig1a). Further SU8 was hard baked at 200 °C to improve its resistance against hard solvents like acetone.
Fig 1.
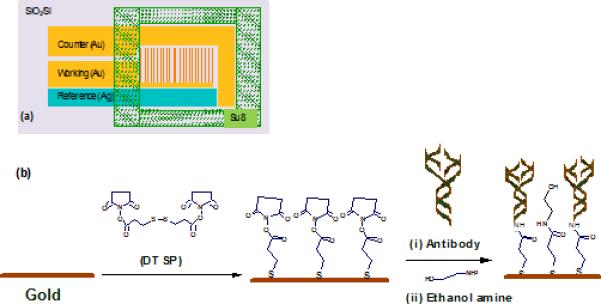
Schematic for (a) gold micro array chip and (b) EA/C-Mab/DTSP/Au bio-electrode fabrication.
2.4. SAM preparation and antibody immobilization
The gold microelectrode array chips were pre-cleaned with acetone, isopropyl alcohol, and de-ionized water. Next they were exposed to 2 mg ml-1 solution of DTSP in acetone for 1hr for SAM formation. DTSP solution was first reduced using NaBH4 and then dispensed on the pre-cleaned chips at room temperature for SAM formation. The DTSP SAM modified electrodes were then rinsed with acetone to remove any unbound DTSP followed by water rinsing and then utilized for antibody immobilization. Cortisol antibodies were covalently attached to DTSP self-assembled monolayer by incubating the electrode in 30 μl of 1 μg ml-1 antibody in phosphate buffer saline (PBS) solution (10 mM, pH 7.4), for 1 hr. Covalent binding (amide bond formation) results from the facile reaction between amino group of antibody and reactive succinimidyl group of the DTSP on the SAM surface. The sensor (C-Mab/DTSP/Au) was washed thoroughly with phosphate buffer (10 mM, pH 7.4) to remove any unbound biomolecules followed by a 10 min washing with 10% ethanolamine solution in PBS. Ethanol amine was used to block unreacted succinimidyl group on DTSP SAM and to remove extra unbound antibodies onto the electrode surface. Fig. 1 schematically illustrates (a) gold micro array chip and (b) EA/C-Mab/DTSP/Au bio-electrode fabrication. The fabricated bio-electrodes were characterized using the electrochemical impedance technique.
3. Results and discussion
3.1. Electrochemical impedance studies
Electrochemical impedance spectroscopy (EIS) is a technique that utilizes an application of periodic small amplitude AC signal over wide frequency range to get electrical response. It is very sensitive and can be used as a characterization tool for studying the charge transfer processes occurring at the sensor-sample interface. Nyquist plots of impedance spectra in present studies have been exploited to study (i) charge transfer change at sensor-solution interfaces after DTSP SAM formation, C-Mab binding and ethanol amine blocking, (ii) the change of charge resistance with changing concentration of cortisol and to measure association constant for the cortisol-C-Mab interaction. All EIS spectra were recorded in PBS (10 mM, pH 7.4) containing 5 mM as a redox probe.
3.1.1. EA/C-Mab/DTSP/Au bio-electrode fabrication
Fig.2 shows the Nyquist plots of impedance spectra measured on the gold microelectrode arrays after each modification processes. Diameter of semicircle represents the charge transfer resistance (Rct) on the electrode surface. In Fig 2(ii), increase in Rct from 670 Ω for curve 2 (i) to 4008 Ω reveals DTSP SAM formation. Increasing Rct is an indication that SAM formation retards the charge-transfer process. Assuming the current was due to defects in monolayer, the change in charge transfer value used in equation to estimate the surface coverage. Rct and R’ct indicate charge transfer resistance before and after SAM formation. The above suggests 85% electrode coverage indicating the presence of some pin holes in the SAM. Covalent binding of C-Mab (curve (iii)) onto the DTSP SAM result in increase of Rct to 8648 Ω due to non-conducting nature of C-Mab. After the treatment with EA slight decrease in Rct to 7813 Ω (curve (iv) was observed. The decrease in Rct can be attributed to the removal of unbound C-Mab molecules.
Fig 2.
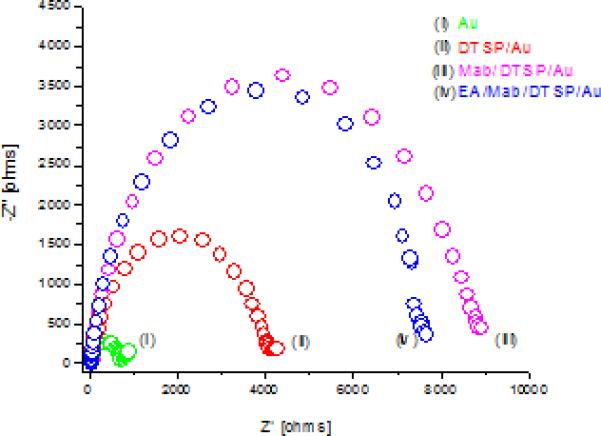
Nyquist plots of (i) blank Au micro electrodes array, (ii) DTSP/Au electrode, (iii) C-Mab/DTSP/Au bio-electrode and (iv) EA/C-Mab/DTSP/Au bioelectrode.
3.1.2. Cortisol response studies of EA/C-Mab/DTSP/Au bio-electrode
Fig. 3 shows the EIS spectra obtained on the EA/C-Mab/DTSP/Au bio-electrode for cortisol concentrations 1 pM to 100 nM. For each concentration, the bio-electrode was incubated in cortisol solution for 30 minutes, followed by PBS washing and EIS spectra recording using PBS (10 mM, pH 7.4) containing 5 mM as a redox probe. With increasing cortisol concentration, diameter of the Nyquist plots was found to increase regularly, indicating that cortisol binds to immobilized C-Mab on bio-electrode, producing a packed layer that decreases the electron transfer for redox probe. A linear relationship between the change in Rct values and the logarithm of cortisol concentrations was observed for the cortisol concentrations in the range of 1 pM to 100 nM. The relationship could be characterized using the following linear equation: Δ Rct (Kohms) = 30.1 + 2.296 log Ccortisol (M). This biosensing electrode reveals the sensitivity of 2.296 Kohms M-1 with standard deviation of 0.399 Kohms and correlation coefficient of 0.997.
Fig 3.
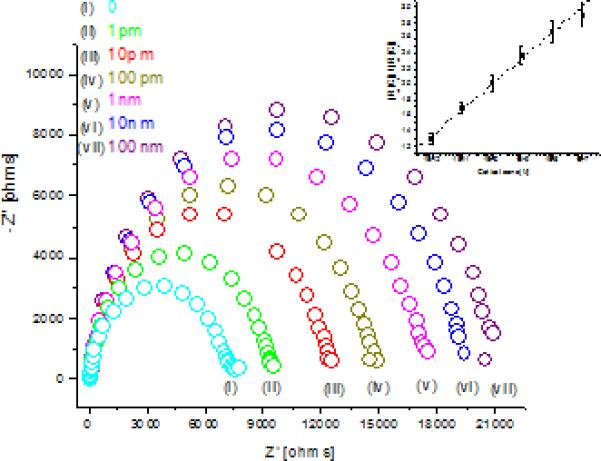
EIS spectra of EA/C-Mab/DTSP/Au for cortisol concentration (i) buffer, (ii) 1pM, (iii) 10 pM, (iv) 100 pM (v) 1 nM, (vi) 10 nM and (vii) 100 nM. (Inset Fig 3) Linearity curve for normalized data obtained from EIS studies for different cortisol concentration.
Though the impedance of all electrodes fabricated in the same batch can be expected to be the same, lack of industrial scale process control in the lab leads to variations in impedance of individual electrode and C-Mab modified electrode. In order to confirm that observed change in impedance was due to surface modification and not due to superimposed effects, all data was normalized. For linear range detection normalization was achieved by plotting [charge transfer resistance for desired concentration (Rct (Ci))]/[charge transfer resistance of blank EA/C-Mab/DTSP/Au bio-electrode (Rct (Co))] versus logarithm of cortisol concentration (Fig 3, inset). After normalization, all electrodes with different base impedance for EA/C-Mab/DTSP/Au bio-electrode exhibited similar response within the 5% error for each concentration. Fig 3 inset, shows curve for normalized data and reveals the linear range of 1 pM to 100 nM. It follows linear equation [Rct (Ci)/(Rct (Co)] = 5.362 + 0.336 log Ccortisol (M) and exhibit correlation coefficient of 0.997 and standard deviation of 0.507.
Further, to account for the variation in initial impedance values for individual electrodes, all experiments were carried out using a step-by-step approach to increasing cortisol concentration. Similar step-by-step concentration studies have been reported by other researchers and help in avoiding superimposed effects of multi electrode measurement (Stevens et al., 2008; Maalouf et al., 2007; Su and Li, 2004; Huang et al., 2008; Lee and Chang, 2005; Lien et al., 2009; Ionescu et al., 2007).
3.2 Estimation of Association constant between the covalently bound C-Mab and cortisol
Association constant for binding interaction was determined using Langmuir isotherm approach, where isotherm assumes equal binding energy for all binding sites. This EIS based approach has already been reported by Szymanska et al., 2007 and Li et al., 2008. Briefly, in binding experiments, change in Rct may be related to the binding of cortisol with immobilized C-Mab and can be represented by equation 1, where M, Rct (co) and Rct (ci) indicate occupied binding sites, charge transfer resistance without cortisol and with desired concentration of cortisol respectively.
| Eq. 1 |
In Langmuir isotherm, M can be related to association constant using equation 2 (Atkins 2001)
| Eq. 2 |
where Ka is association constant and c is concentration of molecule in solution. On rearrangement equation 2 we get
| Eq. 3 |
From equation 1 and 3
| Eq. 4 |
Using equation 4, the curve was plotted between Δ Rct / Rct (co) and concentration of cortisol (Fig 4). Fig 4 reveals that ΔRct (Ci)/(Rct (Co) varies linearly with concentration and follow linear equation [ΔRct (Ci)/(Rct (Co)] = 4.468 + 0.346 log Ccortisol (M) with correlation coefficient of 0.998 and standard deviation of 0.997. Ka was estimated from the slope of regression equation and found to be 0.346 M-1.
Fig 4.
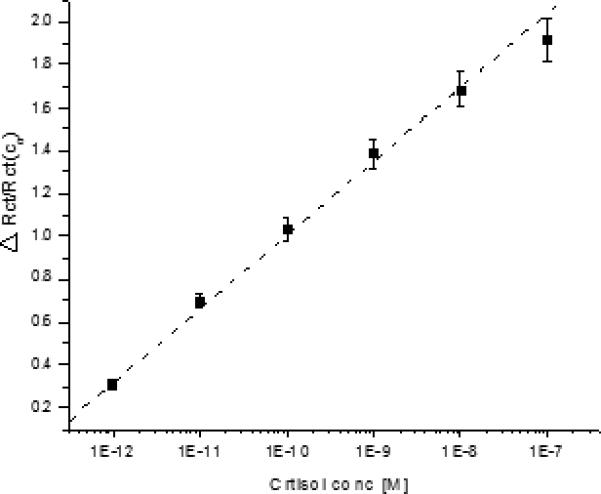
Curve between ΔRct (Ci) / (Rct (Co) and concentration of cortisol for measurement of Ka.
3.3. Non specificity and Selectivity studies
The non-specific adsorption was determined by testing the EA/DTSP/Au electrode against various cortisol concentrations (Supplement Fig 1), and the selectivity test was conducted using EA/C-Mab/DTSP/Au electrode against corticosterone which is very similar in structure to cortisol in a steroid family. There was no significant change in Rct with changing cortisol concentration in non specific studies, which reveals the specificity of the electrode. In selectivity studies, EA/C-Mab/DTSP/Au bio-electrode was investigated in relation to corticosterone. Fig. 5 shows the selectivity study results which include the EIS electrode spectra of a buffer only (i), after incubation with corticosterone (ii), and after incubation with cortisol (iii). As shown in Figure 5, the change in Rct for corticosterone was minuscule as compared to cortisol with same concentration and can be attributed to the 10% affinity of used C-Mab for corticosterone. Thus, the bio-electrode is quite selective and can be used for selective estimation of cortisol.
Fig 5.
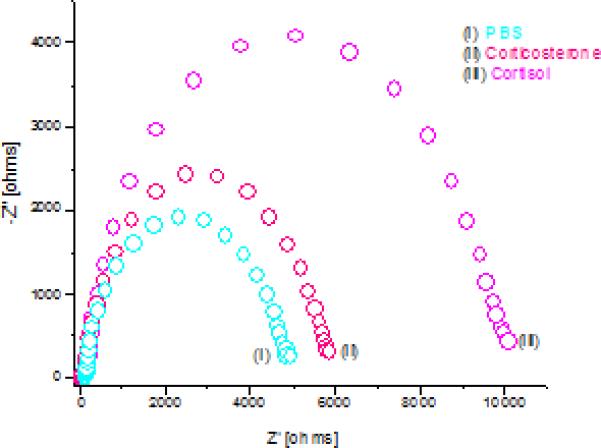
EIS spectra of EA/C-Mab/DTSP/Au for (i) buffer, (ii) corticosterone, (iii) cortisol.
3.4. ISF sample studies
Impedance-based biosensor, described above, was used to analyze the human ISF samples. ISF samples of six subjects, collected between 8AM and 2 PM, were analyzed and compared with the commercially available competitive ELISA results obtained for the same samples (Table 1). For each EA/C-Mab/DTSP/Au bio-electrode, EIS spectra were first recorded in PBS buffer to get the base value. For each ISF sample, the bio-electrode previously analyzed was then incubated with the sample diluted 100 times in PBS buffer for 30 minute, followed by PBS washings, and EIS spectra recording in PBS (10 mM, pH 7.4) containing 5 mM as a redox probe. For each bio-electrode, diameter of the Nyquist plots was found to increase after incubation with an ISF sample. The Rct (Ci)/(Rct (Co) was calculated to determine the cortisol concentration. These values were compared with the values obtained with the commercial ELISA and it was found that the Rct (Ci)/(Rct (Co) value projected a similar trend. It was observed that the values obtained can be used to get the cortisol concentration if normalized with the factor of 10/0.65 (Table 1).
Table 1.
Estimation of cortisol concentration in real ISF sample.
| Subject | ISF SAMPLE | Rct Base (103) Ohms | Rct sample (100 × dilution) (104) Ohms | Rct sample/base (A) | Cortisol Value after normalization [(A×10)/0.65] (nM) | Cortisol Values from Elisa (nM) | % Deviation in measured value from Elisa value |
|---|---|---|---|---|---|---|---|
| Sub. 1 | ISF1 | 5.73 | 1.45 | 2.53 | 38.92 | 39.64 | 1.8 |
| Sub. 2 | ISF2 | 9.65 | 2.09 | 2.16 | 33.23 | 32.19 | 3.1 |
| Sub. 3 | ISF3 | 6.58 | 1.94 | 2.95 | 45.38 | 49.41 | 8.1 |
| Sub. 4 | ISF4 | 8.79 | 2.24 | 2.55 | 39.23 | 40.38 | 2.8 |
| Sub. 5 | ISF5 | 5.82 | 1.32 | 2.27 | 34.92 | 30.0 | 14.1 |
| Sub. 6 | ISF6 | 1.37 | 2.53 | 1.85 | 28.46 | 28.37 | 0.3 |
4. Conclusions
Dithiobis(succinimidyl propionate) (DTSP) self-assembled monolayer (SAM) functionalized gold microelectrode array can be used to fabricate an ultrasensitive impedemetric cortisol immunosensor. Covalently immobilized monoclonal cortisol antibody based EA/C-Mab/DTSP/Au electrode exhibits linear behavior in the concentration range 1pM to 100 nM, has low detection limit of 1 pM with high linear regression coefficient of 0.997. The Bio-electrode was found selective against corticosterone and was validated using the human ISF samples.
Supplementary Material
Acknowledgement
This work was partially supported through NIH award 1r43mh085474-01; Instacortisol:A Realtime and Continuous Assessment of Cortisol In ISF and USF BITT Award; An Automated Cell Health Monitoring System (CHMS) Based on Electrical Impedance. Sunil K. Arya is thankful to University of South Florida, Tampa, Fl, USA, for the award of Post doctoral fellowship.
Footnotes
Publisher's Disclaimer: This is a PDF file of an unedited manuscript that has been accepted for publication. As a service to our customers we are providing this early version of the manuscript. The manuscript will undergo copyediting, typesetting, and review of the resulting proof before it is published in its final citable form. Please note that during the production process errors may be discovered which could affect the content, and all legal disclaimers that apply to the journal pertain.
References
- Appel D, Schmid RD, Dragan CA, Bureik M, Urlacher VB. Anal. Bioanal. Chem. 2005;383:182–186. doi: 10.1007/s00216-005-0022-9. [DOI] [PubMed] [Google Scholar]
- Arya SK, Pandey P, Singh SP, Datta M, Malhotra BD. Analyst. 2007b;132:1005–1009. doi: 10.1039/b707000d. [DOI] [PubMed] [Google Scholar]
- Arya SK, Solanki PR, Singh SP, Kaneto K, Pandey MK, Datta M, Malhotra BD. Biosens. Bioelectron. 2007a;22:2516–2524. doi: 10.1016/j.bios.2006.10.011. [DOI] [PubMed] [Google Scholar]
- Atkins PW. Physical Chemistry. PWN; Warsaw: 2001. pp. 827–829. [Google Scholar]
- Azcon JR, Valera E, Rodriguez A, Barranco A, Alfaro B, Baeza FS, Marco MP. Biosens. Bioelectron. 2008;23:1367–1373. doi: 10.1016/j.bios.2007.12.010. [DOI] [PubMed] [Google Scholar]
- Bantle JP, Thomas W. J. Lab Clin Med. 1997;130:436–41. doi: 10.1016/s0022-2143(97)90044-5. [DOI] [PubMed] [Google Scholar]
- Barsoukov E, MacDonald JR. Impedance Spectroscopy: Theory, Experiment and Applications. second ed. Wiley Interscience; New Jersey: 2005. Chapter 1. [Google Scholar]
- Chen H, Jiang JH, Huang Y, Deng T, Li JS, Shen GL, Yu RQ. Sens. Actuators B. 2006;117:211–218. [Google Scholar]
- Cook NJ, Schaefer AL, Lepage P, Jones SDM. J. Agric. Food Chem. 1997;45:395–399. [Google Scholar]
- Dorin RI, Pai HK, Ho JT, Lewis JG, Torpy DJ, Urban FK, III, Qualls CR. Clin. Biochem. 2009;42:64–71. doi: 10.1016/j.clinbiochem.2008.09.115. [DOI] [PubMed] [Google Scholar]
- Gatti R, Cappellin E, Zecchin B, Antonelli G, Spinella P, Mantero F, De Palo EF. J. Chromatography B. 2005;824:51–56. doi: 10.1016/j.jchromb.2005.06.037. [DOI] [PubMed] [Google Scholar]
- Geng P, Zhang X, Meng W, Wang Q, Zhang W, Jin L, Feng Z, Wu Z. Electrochim. Acta. 2008;53:4663–4668. [Google Scholar]
- Gozansky WS, Lynn JS, Laudenslager ML, Kohrt WM. Clin. Endocrinology. 2005;63:336–341. doi: 10.1111/j.1365-2265.2005.02349.x. [DOI] [PubMed] [Google Scholar]
- Hagelsieb LM, Foultier B, Laurent G, Pampin R, Remacle J, Raskin JP, Flandre D. Biosens. Bioelectron. 2007;22:2199–2207. doi: 10.1016/j.bios.2006.10.024. [DOI] [PubMed] [Google Scholar]
- Hauer D, Weis F, Krauseneck T, Vogeser M, Schelling G, Roozendaal B. Brain Research. 2009;1293:114–120. doi: 10.1016/j.brainres.2009.04.014. [DOI] [PubMed] [Google Scholar]
- Huang Y, Bell MC, Suni II. Anal. Chem. 2008;80:9157–9161. doi: 10.1021/ac801048g. [DOI] [PubMed] [Google Scholar]
- Ionescu RE, Renault NJ, Bouffier L, Gondran C, Cosnier S, Pinacho DG, Marco MP, Baeza FJS, Healy T, Martelet C. Biosens. Bioelectron. 2007;23:549–555. doi: 10.1016/j.bios.2007.07.014. [DOI] [PubMed] [Google Scholar]
- Jerkunica I, Sophianopoulos J, Sgoutas D. Clin. Chem. 1980;26:1734–1737. [PubMed] [Google Scholar]
- Kaptein WA, Zwaagstra JJ, Venema K, Ruiters MHJ, Korf J. Sens. Actuators B. 1997;45:63–69. [Google Scholar]
- Katz E, Willner I. Electroanalysis. 2003;15:913–947. [Google Scholar]
- Khan R, Dhayal M. Biosens. Bioelectron. 2009;24:1700–1705. doi: 10.1016/j.bios.2008.08.046. [DOI] [PubMed] [Google Scholar]
- Kim A, Ah CS, Park CW, Yang JH, Kim T, Ahn CG, Park SH, Sung GY. Biosens. Bioelectron. 2010;25:1767–1773. doi: 10.1016/j.bios.2009.12.026. [DOI] [PubMed] [Google Scholar]
- Knoll M, Adam S, Bahr E, Eshold J, Rob B, Steinkuhl R, Sundermeier C, Haueter U, Reihl B, Vering T. Sens. Actuators B. 2002;87:150–158. [Google Scholar]
- Koutny LB, Schmalzing D, Taylor TA, Fuchs M. Anal. Chem. 1996;68:18–22. doi: 10.1021/ac9508311. [DOI] [PubMed] [Google Scholar]
- Kumar A, Aravamudhan S, Gordic M, Bhansali S, Mohapatra SS. Biosens. Bioelectron. 2007;22:2138–2144. doi: 10.1016/j.bios.2006.09.035. [DOI] [PubMed] [Google Scholar]
- Laschi S, Mascini M. Med. Eng. Phys. 2006;28:934–943. doi: 10.1016/j.medengphy.2006.05.006. [DOI] [PubMed] [Google Scholar]
- Lee YG, Chang KS. Talanta. 2005;65:1335–1342. doi: 10.1016/j.talanta.2004.09.011. [DOI] [PubMed] [Google Scholar]
- Levine A, Sharon OZ, Feldman R, Lewis JG, Weller A. Physi. Behavior. 2007;90:43–53. doi: 10.1016/j.physbeh.2006.08.025. [DOI] [PubMed] [Google Scholar]
- Li X, Shen L, Zhang D, Qi H, Gao Q, Ma F, Zhang C. Biosens. Bioelectron. 2008;23:1624–1630. doi: 10.1016/j.bios.2008.01.029. [DOI] [PubMed] [Google Scholar]
- Lien TTN, Lam TD, An VTH, Hoang TV, Quang DT, Khieu DQ, Tsukahara T, Lee YH, Kim JS. Talanta. 2009 In press. [Google Scholar]
- Lindley SE, Carlson EB, Benoit M. Biol Psychiatry. 2004;55:940–945. doi: 10.1016/j.biopsych.2003.12.021. [DOI] [PubMed] [Google Scholar]
- Loyprasert S, Hedstrom M, Thavarungkul P, Kanatharana P, Mattiasson B. Biosens. Bioelectron. 2010 doi: 10.1016/j.bios.2010.01.020. In press. [DOI] [PubMed] [Google Scholar]
- Loyprasert S, Thavarungkul P, Asawatreratanakul P, Wongkittisuksa B, Limsakul C, Kanatharana P. Biosens. Bioelectron. 2008;24:78–86. doi: 10.1016/j.bios.2008.03.016. [DOI] [PubMed] [Google Scholar]
- Maalouf R, Wirth CF, Coste J, Chebib H, Saikali Y, Vittori O, Errachid A, Cloarec JP, Martelet C, Renault NJ. Anal. Chem. 2007;79:4879–4886. doi: 10.1021/ac070085n. [DOI] [PubMed] [Google Scholar]
- Mitchell JS, Lowe TE, Ingram JR. Analyst. 2009;134:380–386. doi: 10.1039/b817083p. [DOI] [PubMed] [Google Scholar]
- Morineau G, Boudi A, Barka A, Gourmelen M, Degeilh F, Hardy N, Al-Halnak A, Soliman H, Gosling JP, Julien R, Brerault JL, Boudou P, Aubert P, Villette JM, Pruna A, Galons H. J. Fiet, Clin. Chem. 1997;43:1397–407. [PubMed] [Google Scholar]
- Ng SY, Reboud J, Wang KYP, Tang KC, Zhang L, Wong P, Moe KT, Shim W, Chen Y. Biosens. Bioelectron. 2010;25:1095–1101. doi: 10.1016/j.bios.2009.09.031. [DOI] [PubMed] [Google Scholar]
- Nindl BC, Tuckow AP, Alemany JA, Harman EA, Rarick KR, Staab JS, Faupel ML, Khosravi MJ. Diabetes Technology & Therapeutics. 2006;8:244–252. doi: 10.1089/dia.2006.8.244. [DOI] [PubMed] [Google Scholar]
- Oka K, Noguchi M, Kitamura T, Shima S. Clin. Chem. 1987;33:1639–1642. [PubMed] [Google Scholar]
- Radke SM, Alocilja EC. Biosens. Bioelectron. 2005;20:1662–1667. doi: 10.1016/j.bios.2004.07.021. [DOI] [PubMed] [Google Scholar]
- Rowe L, Deo S, Shofner J, Ensor M, Daunert S. Bioconjugate Chem. 2007;18:1772–1777. doi: 10.1021/bc070039u. [DOI] [PubMed] [Google Scholar]
- Sarkar M, Das BC, Bora BD, Kumar V, Mohan K, Meyer HHD, Prakash BS. Gen. Comp. Endo. 2007;154:85–90. doi: 10.1016/j.ygcen.2007.05.035. [DOI] [PubMed] [Google Scholar]
- Schmaldng D, Nashabeh W, Yao XW, Mhatre R, Regnier FE, Afeyan NB, Fuchs M. Anal. Chem. 1996;67:606–612. doi: 10.1021/ac00099a019. [DOI] [PubMed] [Google Scholar]
- Stevens RC, Soelberg SD, Near S, Furlong CE. Anal. Chem. 2008;80:6747–6751. doi: 10.1021/ac800892h. [DOI] [PMC free article] [PubMed] [Google Scholar]
- Stout P, Pokela K, Hirte DM, Hoegh T, Hilgers M, Thorp A, Collison M, Glushko T. Clin. Chem. 1999;45:1674–1676. [PubMed] [Google Scholar]
- Su XL, Li Y. Biosens. Bioelectron. 2004;19:563–574. doi: 10.1016/s0956-5663(03)00254-9. [DOI] [PubMed] [Google Scholar]
- Sun K, Ramgir N, Bhansali S. Sens. Actuators B. 2008;133:533–537. [Google Scholar]
- Szymanska I, Radecka H, Radecki J, Kaliszan R. Biosens. Bioelectron. 2007;22:1955–1960. doi: 10.1016/j.bios.2006.08.025. [DOI] [PubMed] [Google Scholar]
- Tai SSC, Welch MJ. Anal. Chem. 2004;76:1008–1014. doi: 10.1021/ac034966f. [DOI] [PubMed] [Google Scholar]
- Thomas JH, Kim SK, Hesketh PJ, Halsall HB, Heineman WR. Anal. Biochem. 2004;328:113–122. doi: 10.1016/j.ab.2004.02.020. [DOI] [PubMed] [Google Scholar]
- Valera E, Azcon JR, Rodriguez A, Castaner LM, Sanchez FJ, Marco MP. Sens. Actuators B. 2007;125:526–537. [Google Scholar]
- Vogeser M, Mojmle P, Briegel J. Clin. Chem. Lab. Med. 2007;45:521–525. doi: 10.1515/CCLM.2007.104. [DOI] [PubMed] [Google Scholar]
- Weng J, Zhang Z, Sun L, Wang JA. Biosens. Bioelectron. 2010 doi: 10.1016/j.bios.2010.01.027. In press. [DOI] [PubMed] [Google Scholar]
- Zhou JC, Chuang MH, Lan EH, Dunn B, Gillman PL, Smith SM. J. Mater. Chem. 2004;14:2311–2316. [Google Scholar]
Associated Data
This section collects any data citations, data availability statements, or supplementary materials included in this article.