SUMMARY
In recent years, the control or eradication of scrapie and any other transmissible spongiform encephalopathies (TSEs) possibly circulating in the sheep population has become a priority in Britain and elsewhere in Europe. A better understanding of the epidemiology of scrapie would greatly aid the development and evaluation of control and eradication strategies. Here we bound the range of key epidemiological parameters using a combination of relatively detailed pathogenesis and demography data, more limited data on susceptibility and incubation times, and recent survey data on scrapie incidence in Great Britain. These data are simultaneously analysed using mathematical models describing scrapie transmission between sheep and between flocks. Our analysis suggests that occurrence of scrapie in a flock typically provokes changes in flock management that promote termination of the outbreak, such as the adoption of selective breeding, and that a large fraction of cases (possibly over 80%) goes undetected. We show that the data analysed are consistent with the within-flock reproduction number of scrapie lying in the range 1·5–6, consistent with previous epidemiological studies.
INTRODUCTION
Scrapie is a fatal, transmissible neurological disease of sheep with an incubation period of a few years, and which is endemic at relatively low levels in European sheep populations [1]. Despite being the first transmissible spongiform encephalopathy (TSE) identified, its epidemiology remains poorly understood [1]. Improving our understanding of the transmission dynamics of this pathogen has become a matter of greater urgency since it was demonstrated that bovine spongiform encephalopathy (BSE) is orally transmissible to sheep [2], causing clinical signs similar to those associated with clinical scrapie. At present, the hypothetical possibility that BSE has entered the British sheep flock, masquerading as scrapie, still cannot be ruled out. This has been substantiated in recent theoretical work [3, 4]. Unfortunately, a recent laboratory study investigating what was believed to be a pooled sample of more than 2000 brains of ovine TSE cases [5] failed to provide information about the (possible) prevalence of ovine BSE in Great Britain.
Whereas transmission mechanisms, prevalence and incidence of scrapie infection are poorly characterized at present, genetically determined differences in susceptibility to the infection are better understood [6, 7]. Scrapie control programmes that have been started recently in a number of European countries (such as the National Scrapie Plan in Great Britain [8, 9]) as well as EU legislation for scrapie control that came into force in 2004 [10] are essentially based on breeding for resistance. In this context, a better understanding of scrapie transmission would aid efforts to control and possibly eradicate ovine TSEs.
Given the current high level of uncertainty regarding the values of key transmission parameters, one of the main roles of epidemiological analysis is bounding the range of possible transmission scenarios. Recent progress [3] in characterizing sheep demography and in summarizing pathogenesis data in terms of an infectivity function allows us to consider a more restricted range of within-flock transmission scenarios than was previously possible. The purpose of this paper is to investigate, first, if information on outbreak durations [11] obtained from a postal survey across British farms is consistent with current understanding of within-flock transmission characteristics and, second, if this information can further reduce the range of possible transmission scenarios.
The strategy of our modelling analysis is to calculate the mean duration of scrapie outbreaks on a farm, from two directions: both using a within-flock and a between-flock transmission model. The comparison of the outcomes from both directions serves to link up the epidemiological information available at different scales. At the within-flock level, we describe scrapie transmission using a stochastic model incorporating the available data on pathogenesis, sheep demography, genetic susceptibility and incubation times. At the between-flock level a simple model is used to calculate, from the postal-survey data, the mean outbreak duration on a farm. From the within-flock model we obtain a joint distribution of incidence and outbreak duration for each within-flock transmission scenario considered. Within-flock transmission scenarios consistent with the postal-survey data are identified by comparing their predicted mean outbreak duration to that calculated using the between-flock model, and by comparing their predicted observed incidence with the observed incidence found in the postal survey.
METHODS
Within-flock transmission model
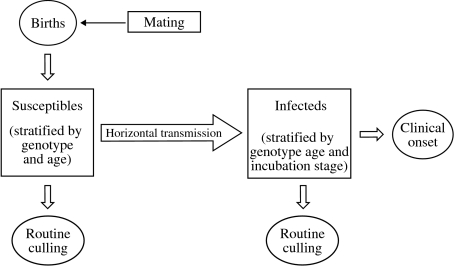
In studying within-flock transmission scenarios, we use a stochastic age-structured susceptible–infected (SI) model (see Fig. 1). The stratification by age allows us to distinguish between animals of reproductive and pre-reproductive age, and to model realistically the host demography using the estimated pattern of sheep survival [3]. We stratify the population of infected animals by incubation stage. The general population is also stratified by genotype, including six genotypes corresponding to the three alleles ARR, ARQ and VRQ (here the three amino-acid symbols correspond to the codons 136, 154 and 171 of the sheep PrP gene respectively). For simplicity ram and ewe genotype frequencies are assumed to be the same. We assume that the genotype structure is in Hardy–Weinberg equilibrium initially with frequencies 0·45, 0·5 and 0·05 for the three alleles ARR, ARQ and VRQ respectively. This structure closely matches a simplified representation, obtained by lumping together genotypes that differ at locus 154 but share the same amino acids at the loci 136 and 171, of the average frequencies in Great Britain of the most important genotypes as estimated by Arnold et al. [12].
Fig. 1.
Schematic representation of the stochastic within-flock transmission model.
We examine two alternative sets of relative susceptibility values for the six genotypes included. Both assume full resistance for the genotype ARR/ARR and maximum susceptibility (normalized at 1·0) for VRQ/VRQ, with model I (model II) assuming the susceptibilities of ARQ/VRQ, ARQ/ARQ, VRQ/ARR and ARQ/ARR to be 1·0 (0·5), 1·0 (0·25), 0·1 (0·1) and 0·1 (0·05) respectively. These relative susceptibility values are motivated by data on relative incidences [6, 13]. However, we note that very recent estimates of the genotype-dependent risk of becoming a confirmed scrapie case for British sheep [14] yield very low risks for animals of the heterozygote genotypes VRQ/ARR (about 0·01 times the risk for VRQ/VRQ) and ARQ/ARR (0·001 times the risk for VRQ/VRQ). Although we believe that due to longer incubation periods in these genotypes, these numbers are underestimates of the infection risks for these genotypes, we have checked that the main findings of this paper remain unaffected when assuming very low susceptibility to scrapie infection in animals of VRQ/ARR and ARQ/ARR genotype.
We use the infectiousness profile estimated in ref. [3] from both scrapie and ovine BSE pathogenesis data to describe how the infectiousness of infected animals develops during incubation. Incubation period distributions are modelled by gamma distributions with an initial 1-year delay. The minimum incubation period of 1 year is motivated by the virtual absence of observed scrapie cases in animals below 1 year of age [1]. The incubation period distribution is assumed to have substantial variance [3]. We consider two alternative breeding assumptions: in the first, referred to as ‘default breeding’, no new ewes are bought into the flock in response to scrapie mortality. In the second, sheep lost due to scrapie are replaced by 1-year-old sheep of scrapie-resistant genotype.
For a precise mathematical specification of the model we refer the reader to previous work [14, 15]. The overall transmission potential of the within-flock scenarios is measured by the reproduction number R0, defined as the expected number of secondary infections caused by a single primary infection in an otherwise infection-naive population.
Two quantities of central interest in our model calculations are the yearly incidence in affected flocks and the mean duration of outbreaks on a flock. As both these quantities depend on flock size in a single-flock model calculation, the following technical comments are in order, specifying how we average across different flock sizes in the within-flock model calculations. The size distribution of the flocks participating in the postal survey was found to be well described by a log-normal distribution [16]. Calculation, using the within-flock transmission model, shows an approximately logarithmic dependence of the outbreak duration, T(N), on flock-size, N; i.e.
 |
Here c1 and c2 are constants. Combining these two results, we may obtain the mean outbreak duration across all sizes simply by calculating the expected outbreak duration for a flock of fixed size equal to the geometric mean n of the size distribution. Denoting the average across all flocks by 〈 〉, one has:
In contrast, mean scrapie incidence is approximately linearly dependent on flock size. Therefore, the expected mean incidence across all sizes is estimated by calculating the expected mean incidence for a flock of arithmetic mean size.
Between-flock transmission model
The postal survey [17] results provide information on (a) annual rates of scrapie-affected farms, (b) the fraction of farms affected over the period 1993–1998 and in 1998, and (c) on the annual incidence ρ, on affected farms. In order to calculate the mean duration of scrapie outbreaks from these data, we need to relate this mean duration to the number of farms that have experienced at least one scrapie case over a defined time period. To derive this relationship we use a simple differential-equation model for the time evolution of the fraction of farms experiencing an ‘observed’ case of scrapie. Here and elsewhere in this paper the notion of ‘observed cases’ refers to cases reported by respondents in the postal survey. The between-flock model takes the form of a compartmental transmission model, however with the usual compartment of infected individuals (farms) replaced by a compartment a of affected farms, where ‘affected’ is defined as experiencing an outbreak of clinical cases:
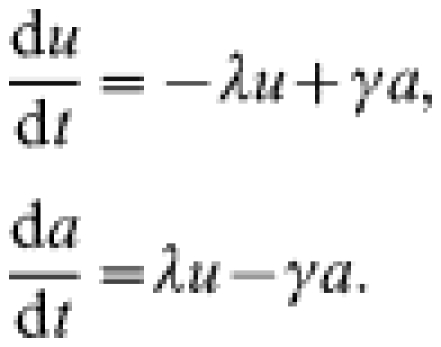 |
Here u(t) is the fraction of farms unaffected at time t, and a(t) the fraction of farms affected at time t. λ denotes the per capita rate at which unaffected farms become affected, i.e. experience a first observed clinical case, and is assumed to be constant through time. γ denotes the recovery rate of affected farms, i.e. 1/γ equals the mean duration of outbreaks. The duration of an outbreak is defined here as the time between the first observed case and the moment in time at which the flock becomes free from individuals infected with scrapie.
The endemic equilibrium values of the state variables are:
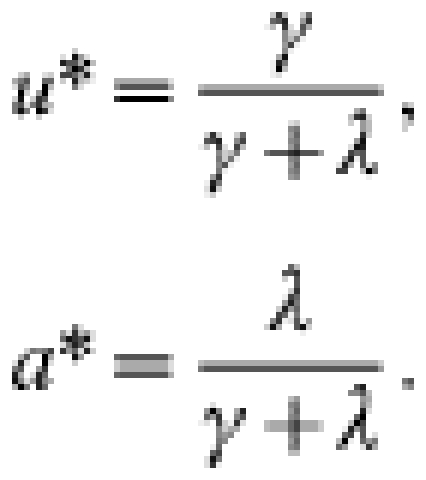 |
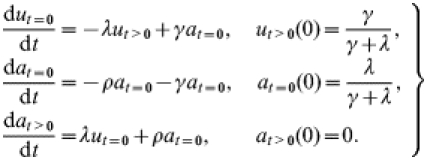
In order to relate to the postal-survey information on the fraction of farms affected within given time periods, we introduce the state variables ut>0, at=0 and at>0 with reference to a given point t=0 in time. We define ut>0(t) as the fraction of farms that were unaffected at t=0 and have had no history of scrapie cases since t=0, at=0(t) as the fraction of farms which were affected at t=0 but which have not (or not yet) produced any observed scrapie cases since t=0, and at>0(t) as the fraction of farms at time t which have experienced at least one case since t=0, regardless of current farm status. Together these fractions make up the full population of farms: ut>0(t)+at=0(t)+at>0(t)=1 for all t. Their time evolution is governed by the following equations:
 |
(1) |
where ρ denotes the case rate on affected farms. The ut>0 class consists of all flocks that were unaffected at t=0 and have remained unaffected since, together with those flocks that were affected at t=0 but have recovered without having seen a case since t=0, as described by the γat=0 terms. The at>0 class comprises all flocks that have seen at least one case since t=0. These can be newly affected flocks (as described by the λut>0 terms, note that ‘becoming affected’ is defined as experiencing a first case and not a first infection) or flocks that were already affected before t=0 and have shown at least one case since (as described by the ρat=0 terms).
Since the above model (1) is linear, it can be solved explicitly. As shown in the Appendix, for λ≪ρ, the solution enables us to express the rate γ in terms of λ, ρ, and at>0(t) in the following manner:
 |
(2) |
In the limit ρ→∞ and for t=1 year this expression reduces to the result used in [10]:
 |
(3) |
On the basis of the postal-survey data, Gravenor et al. [11] estimated the mean hazard λ of farms experiencing a first clinical case of scrapie to be 0·0045/year in recent years, using a model to correct for the between-farm variation in the probability of acquiring a case. A further analysis by the same authors [11] employs the ρ→∞ limit as described by eqn (3) to obtain estimates for the mean underlying (i.e. not necessarily fully observed) outbreak duration (1/γ) on individual farms. This analysis is based on their estimate of λ and on the fraction of farms affected in 1998 [denoted here by at>0(t=1)].
Below we use the model result (2) to obtain (ρ-dependent) estimates for the typical duration of an outbreak from the postal-survey results. The bivariate confidence region of (ρ, 1/γ), together with a point estimate of ρ, is used below to judge consistency of within-flock transmission scenarios with the postal-survey results.
Below we will also compare the population-level prevalence of scrapie infection between various within-flock transmission scenarios. This quantity can be obtained by multiplying the endemic prevalence of affected flocks [given by the between-flock model expression λ/(λ+γ)] by the mean within-flock infection prevalence. We calculate the endemic prevalence of affected flocks using the estimate for λ from Gravenor et al. [11] and estimates of the mean outbreak duration 1/γ obtained from the model calculation of the within-flock transmission scenario.
RESULTS
Estimating the mean outbreak duration from the postal survey
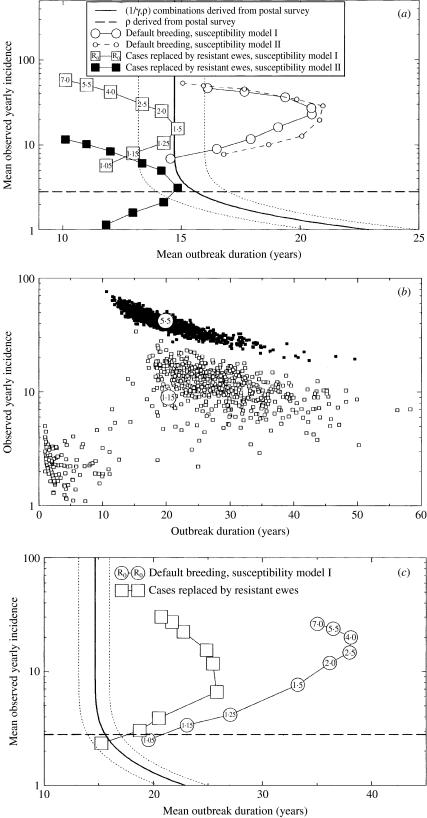
After substituting the estimates for λ and at>0(t=1) obtained by Gravenor et al. [11] from the postal-survey data for outbreaks affecting home-bred animals, eqn (2) provides a relationship between the observed incidence ρ on affected farms and the mean duration of outbreaks 1/γ. This relationship is represented by the thick line in Figure 2(a, c), and the upper and lower confidence bounds on mean duration are shown as dotted lines. If the incidence ρ is large enough, the duration is essentially independent of it, and we recover the estimates obtained in [11]. For lower incidences (below ρ≈5/year)the mean duration increases with decreasing incidence. The estimated annual incidence on affected farms in the postal survey is 2·8 cases and is represented in Figure 2(a, c) as a horizontal dashed line. This value is based on multiplying the median annual incidence for farms with home-bred cases as given in ref. [17] with the ratio between the mean and median flock sizes given in ref. [16].
Fig. 2.
Comparison of results from within-flock transmission model (lines with symbols) and estimates derived from the postal survey results (lines without symbols) using the simple between-flock transmission model. The dashed lines are postal-survey 95% confidence bounds on mean outbreak durations. The horizontal dashed line represents the estimated annual incidence on affected farms in the postal survey, 2·8 cases per year. (a) The within-flock model results shown here correspond to a mean incubation period of 1·5 years. The solid squares correspond to 20% case recognition and the open symbols to 100% case recognition. (b) Individual realization results (small squares) for two choices of R0 (1·15, open symbols, and 5·5, full symbols) under the default breeding, model I, 100% case recognition scenario of (a), for a flock of mean size in the postal survey. The corresponding mean results are shown as large circles. (c) As for (a), but now we consider a mean incubation period of 2·5 years.
Testing within-flock transmission scenarios against the postal-survey results
Within-flock model results are shown as lines with symbols in Figures 2 and 3. In Figure 2a we choose a mean incubation period of 1·5 years, which we consider to be at the lower end of what is plausible, and assume, unrealistically, that all scrapie cases are observed. The within-farm transmission scenarios are further defined by choosing the basic reproduction number R0 from a set of values ranging between 1·05 and 7·0. The results shown are averages over outbreaks with at least one secondary case from 10 000 realizations of single flock outbreaks seeded with a single newly introduced infection. Yearly incidence is an average over the full durations of outbreaks. We observe that these results depend quantitatively but not qualitatively on the choice of susceptibility model. The results indicate that for low enough R0, the mean outbreak duration increases with increasing reproduction number, but for higher R0 the duration shortens with increasing reproduction number. This phenomenon can be understood as follows. In the high-R0 regime, during most of the outbreak the infection prevalence is so high that stochastic extinction is unlikely and, thus, the process of selection for resistance, which becomes faster with increasing reproduction number, is the dominant determinant of the outbreak duration. In the low-R0 regime, due to the low infection prevalence the disease is vulnerable to stochastic extinction during most of the outbreak, and thus, the reduction in the impact of stochastic fluctuations with increasing reproduction number translates into a lengthening of the mean duration.
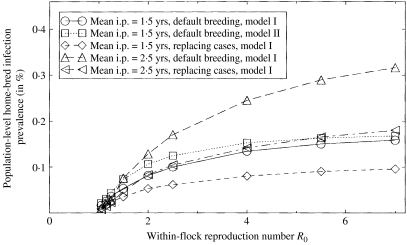
Fig. 3.
Population-level scrapie infection prevalence (arising from epidemics involving home-bred animals) under various scenarios, calculated from mean within-flock infection prevalence and duration results assuming endemic between-flock transmission with a force of infection λ=0·0011 [10].
We now compare the estimated annual incidence on affected farms, 2·8 cases (horizontal dashed line) and confidence region of incidence-duration combinations obtained from the postal survey with results from our within-flock model. First, we consider scenarios with 100% case recognition (represented by open symbols in Fig. 2a). For most of the default-breeding scenarios considered in Figure 2a, the values obtained for both outbreak duration and incidence are significantly larger than the postal-survey estimates. In particular, unless the assumed reproduction number is rather large or rather close to unity, the durations are outside the postal-survey confidence bounds. As the assumed mean incubation period of 1·5 years is at the bottom end of what is considered plausible, the discrepancy in estimated durations cannot be resolved by assuming a shorter incubation period. It can, however, be resolved by assuming that the occurrence of scrapie will typically provoke changes in flock management, such as selective breeding and sell-offs of animals, that act to reduce the outbreak duration.
To demonstrate the effect of breeding for resistance we examine the effect of replacing the default-breeding pattern with an assumption that farmers replace scrapie cases by ewes of ARR/ARR genotype. The introduction of these animals, that are here assumed to be fully resistant to infection, enhances the natural selection for resistance and leads to mean duration results that are within the postal-survey confidence bounds for a range of values of the reproduction number.
However, for all scenarios that assume full detection of scrapie cases, we still find that the mean annual incidence rates calculated are above the observed mean annual incidence of 2·8 cases (see Fig. 2a). The difference is smallest if the reproduction number R0 is chosen within a narrow range above 1. However, across British sheep flocks it is unlikely that within-flock R0 values would be distributed across such a narrow range. Focusing therefore on results for somewhat higher reproduction numbers (say R0>1·25), we conclude that a substantial proportion of clinical cases must remain undetected – perhaps 80% or more, in line with earlier suggestive estimates of under-reporting [17]. Figure 2a illustrates how scenarios combining low case ascertainment with selective breeding can match both the outbreak duration and annual incidence estimates obtained from the postal-survey data.
In Figure 2b we illustrate the effect of demographic stochasticity in the within-flock epidemic on incidence and duration, for two selected scenarios assuming default breeding: in the low-R0 (demonstrated by R0=1·15) regime there is a positive correlation between incidence and duration, whereas in the high-R0 (demonstrated by R0=5·5) regime the correlation is negative. However, in neither case is the scatter substantial enough to convincingly explain the postal- survey results without invoking under-ascertainment and/or selective breeding.
Figure 2c presents results for scenarios that differ from those considered in Figure 2(a, b) in having a longer mean incubation periods (2·5 years). A longer mean incubation period, unsurprisingly, leads to longer mean durations. As a result, even the scenario with replacement of cases by resistant animals results in durations above the postal-survey upper confidence bound. Although there is scope for generating lower outbreak durations through more intensive selective breeding strategies (e.g. using resistant rams only) and sell-offs, these results indicate that the mean incubation period is <2·5 years. This result is in line with the work of Woolhouse et al. [18] who arrived at a similar conclusion based on analysis of data from an outbreak in an experimental Cheviot flock.
An important but as yet poorly quantified epidemiological quantity is the population-level prevalence of scrapie infection. Figure 3 displays this quantity for the scenarios considered in Figure 2, calculated as explained in the ‘Between-flock transmission model’ section. Inclusion of the prevalence arising from epidemics in bought-in animals only [17] adds ∼25% to these numbers. Assuming that ascertainment is such that not more than half of the outbreaks remain undetected, the infection prevalence range thus found across all scenarios considered is in line with our previously published order-of-magnitude estimate of between 0·1 and 1·0% of animals [3].
DISCUSSION
At present, limitations in available data impede a thorough understanding of scrapie epidemiology. However, as we have shown in this paper, useful progress can be made by integrating information on susceptibility, pathogenesis and survival of animals and recent population-level incidence data from a postal survey. We have used a stochastic within-flock transmission model to calculate within-flock outbreak durations based on the demographic, susceptibility and pathogenesis data. A simple between-flock transmission model was used to extract independent duration estimates from the postal-survey data. We have shown that the estimates derived from these two approaches are consistent if one assumes that the majority of clinical cases of scrapie go undetected. Our results are also consistent with earlier work [3] estimating the population-wide scrapie infection prevalence to be of the order of 0·1% to 1·0% of animals.
Our results also suggest that the occurrence of scrapie typically provokes changes in flock management. Assuming that flock management is unaffected by scrapie occurrence produces an estimate of the mean outbreak duration from within-flock transmission models that is significantly longer than the postal-survey based estimate even when assuming a mean incubation period of only 1·5 years – a discrepancy that worsens if a longer mean incubation period is assumed. For a mean incubation period of ∼1·5 years (but not substantially longer) agreement with the postal survey estimate of mean outbreak duration can be achieved if we further assume that scrapie cases are replaced by genetically resistant (ARR/ARR) animals. Further reductions in outbreak duration are possible by assuming more drastic changes in management, such as the introduction of more aggressive breeding for resistance.
Our analysis illustrates the utility of mathematical modelling in making best use of limited and complex epidemiological data obtained on three different scales: that of the animal (susceptibility, incubation, pathogenesis), the flock (demography, genetics) and the national population (survey data). However, despite recent progress in the study of scrapie, precise transmission routes and their relative contributions to the overall transmission intensity remain poorly characterized. Current monitoring of the effects of selective breeding strategies adopted in several European countries should yield useful further insight into the relationship between the transmission potential of scrapie and the genetic composition of a flock.
ACKNOWLEDGEMENTS
This work was funded by the Food Standards Agency. N. M. F. also acknowledges funding from the Royal Society. We are grateful to M. Bruce, S. Bellworthy and M. Jeffrey for access to pre-publication data on infectivity, and to L. Hoinville for access to pre-publication data on sheep genotype frequencies.
APPENDIX
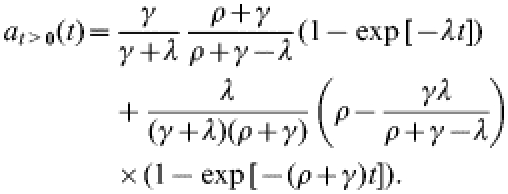
We derive the result in eqn (2) from the model equations in eqn (1). First, the explicit solution for at>0 is:
 |
(A1) |
In the limit of an infinite case rate on affected farms, ρ→∞, we recover the approximation used in [11]:
Since λ≪ρ, the full result (A1) above is in very good approximation equal to:
 |
(A2) |
For the time intervals that we are interested in, λt≪1, so that we may approximate 1−exp(−λt)≈λt, and obtain:
 |
(A3) |
In order to express the rate γ in terms of other quantities we approximate exp(−γt)≈γt in (A2) and obtain a quadratic equation for γ, whose solution is given by eqn (2) in the main text.
We note that a more detailed between-flock transmission model that incorporates high- and low-risk flocks will give very similar results for γ: Assuming that only part of all farms is susceptible to a home-bred epidemic amounts to a simultaneous rescaling of λ and at>0(t=1) in eqn (3), having only a minor effect on γ. For the same reason the inclusion of an assumed under-recognition of outbreaks in the postal survey has only a minor effect on the estimated mean outbreak duration.
DECLARATION OF INTEREST
None.
REFERENCES
- 1.Hoinville LJ. A review of the epidemiology of scrapie in sheep. Rev Sci Tech Off Int Epiz. 1996;15:827–852. doi: 10.20506/rst.15.3.959. [DOI] [PubMed] [Google Scholar]
- 2.Foster JD, Hope J, Fraser H. Transmission of bovine spongiform encephalopathy to sheep and goats. Vet Rec. 1993;133:339–341. doi: 10.1136/vr.133.14.339. [DOI] [PubMed] [Google Scholar]
- 3.Ferguson NM, Ghani AC, Donnelly CA, Hagenaars TJ, Anderson RM. Estimating the human health risk from possible BSE infection of the British sheep flock. Nature. 2002;415:420–424. doi: 10.1038/nature709. [DOI] [PubMed] [Google Scholar]
- 4.Kao RR, Gravenor MB, Baylis M et al. The potential size and duration of an epidemic of bovine spongiform encephalopathy in British sheep. Science. 2002;295:332–335. doi: 10.1126/science.1067475. [DOI] [PubMed] [Google Scholar]
- 5.Frankish H. Samples blunder renders sheep-BSE study useless. Lancet. 2001;358:1436–1436. doi: 10.1016/S0140-6736(01)06544-8. [DOI] [PubMed] [Google Scholar]
- 6.Hunter N. PrP genetics in sheep and the implications for scrapie and BSE. Trends Microbiol. 1997;5:331–334. doi: 10.1016/s0966-842x(97)01081-0. [DOI] [PubMed] [Google Scholar]
- 7.Hunter N. Scrapie. Mol Biotechnol. 1998;9:225–234. doi: 10.1007/BF02915795. [DOI] [PubMed] [Google Scholar]
- 8.Kao RR, Gravenor MB, McLean AR. Modelling the national scrapie eradication programme in the UK. Math Biosci. 2001;174:61–76. doi: 10.1016/s0025-5564(01)00082-7. [DOI] [PubMed] [Google Scholar]
- 9.Defra. www.defra.gov.uk. www.defra.gov.uk Department for Environment, Food and Rural Affairs. ). Accessed 25 July 2005.
- 10.Anon.Commission Regulation (EC) No 1874/2003 of 24 October 2003 approving the national scrapie control programmes of certain Member States, and defining additional guarantees, and granting derogations concerning breeding programmes for TSE resistance in sheep pursuant to Decision 2003/100/EC Off J Eur Union 200327512 [Google Scholar]
- 11.Gravenor MB, Cox DR, Hoinville LJ, Hoek A, McLean AR. The flock-to-flock force of infection for scrapie in Britain. Proc R Soc Lond B. 2001;268:587–592. doi: 10.1098/rspb.2000.1462. [DOI] [PMC free article] [PubMed] [Google Scholar]
- 12.Arnold M, Meek C, Webb CR, Hoinville LJ. Assessing the efficacy of a ram-genotyping programme to reduce susceptibility to scrapie in Great Britain. Prev Vet Med. 2002;56:227–249. doi: 10.1016/s0167-5877(02)00159-9. [DOI] [PubMed] [Google Scholar]
- 13.Baylis M, Goldmann W, Houston F et al. Scrapie epidemic in a fully PrP-genotyped sheep flock. J Gen Virol. 2002;83:2907–2914. doi: 10.1099/0022-1317-83-11-2907. [DOI] [PubMed] [Google Scholar]
- 14.Hagenaars TJ, Donnelly CA, Ferguson NM, Anderson RM. The transmission dynamics of the aetiological agent of scrapie in a sheep flock. Math Biosci. 2000;168:117–135. doi: 10.1016/s0025-5564(00)00048-1. [DOI] [PubMed] [Google Scholar]
- 15.Hagenaars TJ, Ferguson NM, Donnelly CA, Anderson RM. Persistence patterns of scrapie in a sheep flock. Epidemiol Infect. 2001;127:157–167. doi: 10.1017/s0950268801005738. [DOI] [PMC free article] [PubMed] [Google Scholar]
- 16.McLean AR, Hoek A, Hoinville LJ, Gravenor MB. Scrapie transmission in Britain: a recipe for a mathematical model. Proc R Soc Lond B. 1999;266:2531–2538. doi: 10.1098/rspb.1999.0956. [DOI] [PMC free article] [PubMed] [Google Scholar]
- 17.Hoinville LJ, Hoek A, Gravenor MB, McLean AR. Descriptive epidemiology of scrapie in Great Britain: results of a postal survey. Vet Rec. 2000;146:455–461. doi: 10.1136/vr.146.16.455. [DOI] [PubMed] [Google Scholar]
- 18.Woolhouse MEJ, Stringer SM, Matthews L, Hunter N, Anderson RM. Epidemiology and control of scrapie within a sheep flock. Proc R Soc Lond B. 1998;265:1205–1210. doi: 10.1098/rspb.1998.0421. [DOI] [PMC free article] [PubMed] [Google Scholar]


