

SUMMARY
The prevalence of Neisseria meningitidis carriage is highest in teenagers and lowest in young children. In contrast, invasive meningococcal disease is most common in young children with a smaller secondary peak in teenagers. Data on carriage and disease were analysed to quantify the risks of infection and disease by age and serogroup. The forces of infection for serogroups B, C, other meningococci and Neisseria lactamica were modelled together with the risk of disease given infection for serogroups B and C, using maximum likelihood to fit the models to the available data. The risk of meningococcal disease given infection declines steeply through childhood and is higher for serogroup C than for serogroup B. The secondary peak in disease in teenagers appears to be explained mostly by increased transmission although there is a suggestion that other factors may also contribute. These analyses provide important insights and may be used to guide further data collection and modelling studies.
INTRODUCTION
Invasive meningococcal disease is a rare consequence of infection with Neisseria meningitidis. The incidence of meningococcal disease is highest in young children and declines through childhood, with a smaller secondary peak in disease in teenagers. In contrast, asymptomatic nasopharyngeal carriage of N. meningitidis is common, with a population prevalence of around 10% [1]. Carriage prevalence varies with age, being highest in teenagers and lowest in young children. Although cases of meningococcal disease are the most important outcome in terms of public health, they represent the tip of the iceberg in terms of transmission, most of which occurs silently through asymptomatic carriage. Thus, an understanding of the transmission dynamics of the meningococcus at a population level is crucial. N. meningitidis carriage strains are diverse and only a subset of these (known as hyperinvasive lineages) cause disease. Asymptomatic infection with pathogenic and non-pathogenic strains, including the closely related Neisseria lactamica, which is carried frequently in children, may help contribute to the development of protection against meningococcal disease [2, 3]. However, large-scale carriage studies are expensive and difficult to conduct, limiting the availability of these data.
Understanding the epidemiology of meningococcal carriage and disease and the relationship between the two is clearly important for designing effective disease control measures. Here we examine the available carriage and disease data by age and serogroup to quantify past trends in the risk of infection, identify the relationship between carriage and disease and estimate the risks of infection and disease.
METHODS
Data sources
Carriage
A large carriage survey was conducted in Stonehouse, Gloucestershire, England following a community outbreak of serogroup B disease in 1986 [1]. Over 5500 individuals were swabbed in this study (n=5652) and these data, stratified by age and serogroup form the basis of the carriage dataset for the following analyses. Because few young children were sampled in Stonehouse (three children <1 year old, 282 children aged 1–4 years), carriage data from <5-year-olds from a study by Gold et al. [3], conducted in Danbury, Connecticut in 1972 (n=3787) was used to supplement the dataset (Table 1, Fig. 1). This is the same data as used by Coen et al. [4] in their earlier models of N. meningitidis, although data used here were broadly grouped, into serogroup C, serogroup B, other serogroups (including non-groupable strains) and N. lactamica.
Table 1.
Age-specific carriage prevalence for N. meningitidis (serogroups B, C and other) and N. lactamica, using combined data from studies in Stonehouse, Gloucestershire and Danbury, Connecticut and cases of laboratory-confirmed meningococcal disease reported in England and Wales from two time periods
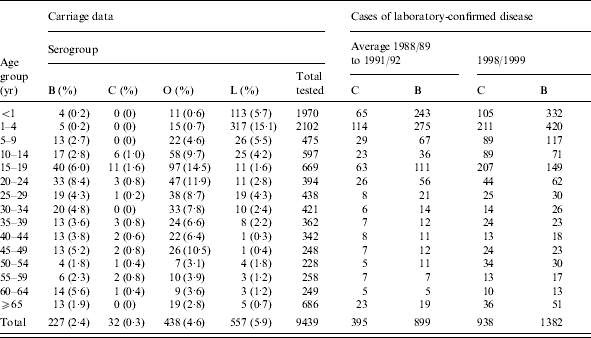
Fig. 1.

Comparison of age-specific prevalence of (a) N. meningitidis and (b) N. lactamica carriage in Stonehouse (▪) and Danbury (▴). The upper and lower 95% confidence intervals are shown.
Published data from the UK Meningococcal Carriage Study in 1999 provided information on the number of carriers by serogroup, serotype and serosubtype in a large sample (∼14 000) of 15- to 17-year-olds [5].
Disease
Laboratory reports provide the only information on the serogroup causing meningococcal disease in England and Wales. Isolates and clinical specimens from cases are sent to the Meningococcal Reference Unit (MRU) for confirmation of the diagnosis and characterization. Prior to vaccination against serogroup C disease, most disease in the United Kingdom was caused by serogroups B and C, while other serogroups caused disease only occasionally.
Notable changes in the epidemiology of meningococcal disease occurred during the 1990s, particularly the increase in serogroup C disease. Two datasets of laboratory-confirmed cases were, therefore, generated. The first was from the late 1980s/early 1990s, which is the closest in time to the Stonehouse carriage study as possible, and before the ‘hyperendemic’ period of serogroup C disease. Laboratory data from 1986, the year of the Stonehouse study, were not available in the age groupings required. Analysis of the available MRU data from 1988/1989 to 1991/1992 (epidemiological years, July to June) shows that the patterns of disease are fairly stable, so the average incidence of disease was estimated for this period (Table 1). The second dataset was from 1998/1999, the time period immediately prior to the introduction of serogroup C conjugate (MCC) vaccination in the United Kingdom (Table 1). The difficulty here is that, although the changes in disease incidence between the early and late 1990s could clearly be observed, we do not have information on the corresponding changes in carriage prevalences across all ages. The carriage rate of serogroup C meningococci in the late 1990s as estimated in the UK teenage carriage study was low, at 0·45% (95% CI 0·37–0·60). For comparison, in Stonehouse, the serogroup C carrier rate in 15- to 19-year-olds was 1·6% (95% CI 0·8–2·9), although the confidence intervals around this estimate are much wider because of the considerably smaller sample size (669 individuals aged 15–19 years swabbed in Stonehouse compared to over 14 000 aged 15–17 years in the teenage carriage study). The overall prevalence of carriage in teenagers for all serogroups was higher in Stonehouse (22·1%, 95% CI 19·0–25·5) [1] than reported by Maiden et al. (16·7%, 95% CI 16·1–17·3) [5]. In effect, we have assumed that carriage prevalences remain the same between the late 1980s and the late 1990s, even though disease incidence increases.
Population data for England and Wales were obtained from the Office for National Statistics (ONS).
Data analysis
Episodes of carriage
The average number of episodes of carriage (by serogroup) an individual is likely to experience in a lifetime (assumed to be 75 years) was estimated from the carriage prevalence data. In this analysis, the incidence of carriage at each year of age (Ii) was estimated from the relationship,
 |
(1) |
where Pi is the prevalence of carriage at age i and d is the average duration of carriage. The cumulative incidence of carriage by age and serogroup were then estimated. We assumed there was no immunity to carriage and that individuals carried only one strain at a time. The duration of carriage was assumed to be 9 months [6] for meningococcal carriage and 4 months [3] for N. lactamica carriage, according to the published literature. The sensitivity of the results to changes in the duration of carriage was tested, including a shorter duration of carriage with serogroup C than other meningococcal serogroups.
Risk of disease given infection
Age effects
To explore the effect of age further we examined the ratio of disease incidence to carriage incidence by age group using the Stonehouse/Danbury carriage data and the disease dataset from the late 1980s/early 1990s, as described above. The yearly incidence of carriage by age and serogroup was estimated from the prevalence data using equation (1), assuming carriage duration of 9 months. The average annual age-specific incidence of laboratory- confirmed disease between 1988/1989 and 1991/1992 was then divided by the age-specific incidence of carriage to generate a case:carrier ratio, which is effectively the risk of disease given infection. The 95% confidence intervals for the proportion of individuals acquiring carriage in one year were estimated and used as the basis for calculating the 95% confidence intervals for the risk of disease given infection. This approach assumes that the case data are complete and not based upon a population sample.
Serogroup effects
The ability of meningococcal strains to cause invasive disease and their subsequent virulence are variable. In recent years serogroup C strains (of the sequence type 11 clonal complex) have demonstrated ‘hypervirulence’, associated with a higher risk of death [7]. Whether these serogroup C strains are also ‘hyperinvasive’ can be investigated by comparing the risk of disease given infection for different serogroups. Recent carriage data is only available for teenagers [5] so the serogroup-specific risks of disease given infection were estimated for this age group (15–19 years) over two time periods (late 1980s/early 1990s and late 1990s).
Age at first infection
The proportion of infections occurring in individuals who had not been previously infected (i.e. first infections) was calculated by year of age by taking the negative exponential of the cumulative incidence of carriage as estimated above, i.e.
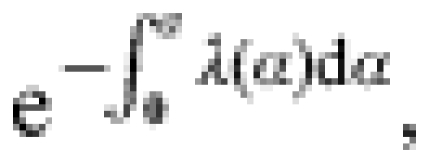 |
(2) |
Estimating the forces of infection and risk of disease given infection
Models were created to formally describe the risks of infection and disease. The force of infection is defined as the per capita rate at which susceptibles acquire infection [8], where, in this case, infection may result in carriage or disease. A SIS (susceptible–infected– susceptible) model was constructed to estimate the forces of infection for meningococcal serogroups (C, B and other) and N. lactamica and the risk of disease given infection with serogroups B and C. It was assumed that simultaneous carriage of more than one serogroup did not occur. Individuals were assumed to be at risk of meningococcal disease at the point of infection and not throughout the entire episode of carriage. This is consistent with observations that most cases occur within a few days of meningococcal acquisition [9, 10], although there are documented exceptions to this [11].
A suitable function was derived to describe the age- and serogroup-specific forces of infection (Appendix 1). Each ‘infection’ (C, B, O meningococci and N. lactamica) was described using five parameters (20 in total). The recovery rate was fixed to minimize the number of parameters to be estimated and was assumed to be the inverse of the average duration of carriage (9 months for meningococci [6], 4 months for N. lactamica [3]). A function was also derived to describe the risk of disease given infection by age for serogroups B and C (Appendix 1), resulting in six further parameters to estimate. Because disease caused by serogroups other than B and C is rare, for simplicity only serogroups B and C disease were modelled here. The model parameters were fitted to the Stonehouse and Danbury carriage data simultaneously using maximum-likelihood techniques [12] (Appendix 2).
Models were created for two time points. The first was fitted to disease data from the late 1980s/early 1990s (the average number of cases between 1988/1989 and 1991/1992) and the Stonehouse/Danbury carriage dataset described above, the second was fitted to the same carriage dataset and disease incidence data from the late 1990s. The force of infection was allowed to vary in the two models, but since the models were fitted to the same data on carriage prevalence (because of a lack of modern carriage data), the increase in disease incidence from the early to late 1990s will be mostly explained by an increased risk of disease given infection. Although not ideal, this is at least consistent with the evidence that serogroup C strains in the 1990s were hyperinvasive.
RESULTS
Episodes of carriage
A typical individual might expect to experience around four episodes of serogroup B meningococcal carriage, seven episodes of other meningococci, six episodes of N. lactamica carriage and 0·5 episodes of serogroup C carriage over their lifetime (Fig. 2). Given that, on average, an individual will experience 10 carriage episodes in the first 30 years of life, if there is any immunity against carriage it is likely to be short lived. These results are sensitive to changes in the duration of carriage. For example, if the duration of meningococcal carriage is doubled (to 18 months) then the average number of meningococcal infections in a lifetime will halve to around five. Similarly, if the duration of carriage is halved to 4·5 months, then the average number of carriage episodes will double. If the duration of serogroup C carriage is assumed to be 3 months, then the average number of episodes experienced per lifetime is 1·5.
Fig. 2.

Estimated average cumulative episodes of carriage by age.
Risk of disease given infection
Figure 3 shows the age-specific risk of disease given infection, using the Stonehouse/Danbury carriage data and disease data from both the late 1980s/early 1990s (Fig. 3 a) and the later 1990s (Fig. 3 b). The ratio of cases:carriers is highest in infants and declines throughout childhood and it appears that individuals become less susceptible to disease as they grow older. There is no major change in the risk of disease given infection for 15- to 19-year-olds implying that the increase in disease incidence in this age group can be reasonably explained by increased exposure due to higher rates of carriage. In older adults the ratio appears to be fairly stable except for a slight increase in other serogroups. The risk of disease for all serogroups is higher in the late 1990s compared to the late 1980s/early 1990s (Fig. 3) but this analysis does not allow for possible changes in carriage. For younger adults (aged 15–19 years) it is possible to compare the risk of disease given infection in the late 1980s/early 1990s with the late 1990s using two sources of carriage data appropriate to the time period of disease (Table 2). The risk of disease given infection is higher for serogroup C than for serogroup B at both time points although the difference is more marked when modern data are used. Other serogroups rarely cause disease and are carried frequently, so the risk of disease given infection is much lower than serogroups B or C. There is no information on how the duration of carriage might vary between different strains and between the different time points.
Fig. 3.

Risk of disease given infection by age and serogroup (a) using disease incidence data from the late 1980s/early 1990s (Table 1) and the Stonehouse/Danbury carriage dataset. (b) Using disease incidence data from the late 1990s (Table 1) and the Stonehouse/Danbury carriage dataset.
Table 2.
Risk of disease given infection, by meningococcal serogroup in 15- to 19-year-olds in two time periods

Carriage incidence per year estimated from reported carriage prevalence and an average duration of carriage (9 months).
First infections
One reason for the apparent decline in the risk of disease by age could be a higher risk of disease on first exposure to a meningococcus. Individuals who have never been a carrier (naive individuals) will not have the benefit of immunity (to disease) acquired through previous episodes of carriage [13]. Conversely, individuals who have previously been a carrier, while still susceptible to carriage may have developed some protection against disease. In children, N. lactamica infection is most common and 90% of individuals have been infected by age 6 years. By age 18 years, we estimate that 90% of individuals have also been infected with non-C meningococci, although fewer than 50% of people will ever be infected with serogroup C meningococci in their lifetime. Using serogroup B as an example (Fig. 4), we can see that the ratio of cases to carriers appears to decline more quickly than the proportion of individuals who have not previously experienced an episode of serogroup B carriage. If we assume that immunity generated through previous episodes of carriage is the main factor in reducing the risk of disease given infection then episodes of carriage of other meningococcal serogroups and N. lactamica must be important, i.e. there must be some cross-protection against disease.
Fig. 4.

Comparison of the risk of disease given infection and the proportion of individuals not previously infected.
Forces of infection and risk of disease given infection
The best-fitting force-of-infection parameters for the SIS model structure were estimated and the resulting carriage prevalence curves are compared to the observed data in Figure 5. The model appears to fit well, although the prevalence of carriage for serogroup B and other serogroups (O) may be underestimated in older teenagers. Significant variability, not explained by the model, remains. A more complex function may require even more parameters, which may offset any future gains from obtaining a ‘better fit’, especially when the variability in the data may be due to small numbers of observations in each data point.
Fig. 5.

Carriage prevalence estimated by SIS model (best-fit force of infection parameters) compared to observed data (see Appendix 1 for more details on the functions and parameters used).
The age-specific risk of disease given infection was estimated using the disease data from the early 1990s and 1998/1999 using the function described in Appendix 1. The resulting deviance for the early 1990s model was 290, on 178 d.f. In comparison, the late 1990s disease incidence model had a deviance of 323 on 178 d.f. For both time points, the risk of disease given infection was higher for serogroup C than serogroup B and, as shown earlier in Table 2, serogroup C strains were more invasive in the late 1990s compared to the early 1990s. The parameter estimates for the late 1990s model are reported in Appendix 1.
The incidence of meningococcal disease in the first 3 months of life is much lower than the incidence of disease in those aged 3–11 months (7·3/100 000 compared to 20·6/100 000), probably because of maternal immunity [14]. This distinction may be important when estimating the impact of routine vaccination schedules, which currently start at 2 months of age. The risk of disease given infection was re-estimated for <1-year-olds (assuming the force of infection is similar throughout the first year), stratifying by those aged ⩽3 months and 3–11 months.
The risk of disease given infection in children aged ⩽3 months was approximately one third of that in infants aged 3–11 months (0·036 vs. 0·11).
DISCUSSION
Individuals are likely to experience many episodes of carriage with N. meningitidis and N. lactamica through their lifetimes, which is probably important in developing and maintaining immunity to meningococcal disease [2, 15]. The force of infection is clearly variable by age and serogroup, with meningococcal carriage being most common in teenagers and carriage of N. lactamica most common in young children. The risk of meningococcal disease given infection declines steeply through childhood, as both innate and specific immunity against N. meningitidis develops [15]. The risk of disease given infection is higher for serogroup C than for serogroup B. This difference was particularly marked in the late 1990s, with serogroup C estimated to be over 12 times more invasive than serogroup B, at least in teenagers. The risk of disease given infection in the late 1990s was higher for all serogroups, due to both a higher incidence of disease and a lower prevalence of carriage compared to the late 1980s/early 1990s. The higher incidence of disease in the late 1990s may be in part due to improved surveillance [16], but for serogroup C disease the increase was accompanied by a shift in the age distribution and a change in the most prevalent serotype (2a), indicating a real change in the epidemiology [16]. The lower overall carriage prevalence observed in teenagers in 1999 compared to 1986 may be because the Stonehouse study was conducted in a single community experiencing an outbreak of disease, whereas the later carriage study took samples from many sites around the country. The detection of carriage also varies according to the skill of the swabber and the microbiological techniques used, therefore, we cannot be certain that there was a true decline in carriage over the decade.
Although the risk of disease given infection generally declines with age (Fig. 3), there appears to be a slight increase in risk for teenagers. This implies that while most of the secondary peak in disease in young adults can be accounted for by increased transmission, there may also be other factors, independent of transmission, which increase susceptibility to disease in this age group. These may include passive smoking, to which exposure seems likely to increase during teenage and is associated with an increased risk of meningococcal disease [17]. It would be helpful to identify these secondary factors, but it may also be desirable to investigate the potential for control measures aimed at reducing transmission and exposure to meningococci in teenagers (although an improved understanding of the way episodes of carriage contribute to protection from disease would be important).
Two major problems with the carriage dataset used in this work are that two different datasets were amalgamated and that the carriage studies are not recent. As previously discussed [4], the amalgamation of two studies conducted in different countries in different decades is far from ideal, but it was essential to increase the number of young children in the dataset. Both studies used similar microbiological techniques, and were conducted in countries that have similar meningococcal disease epidemiology. Although carriage of N. lactamica is similar in the two datasets, there are differences in the prevalence of meningococcal carriage, which appears to be higher in the Stonehouse dataset. However, for these preliminary investigations we felt it would be more misleading to ignore carriage in young children (in particular carriage of N. lactamica which is common in this age group), in whom the burden of meningococcal disease is high. We cannot be sure that there have not been major changes in the populations of circulating meningococci since the time of the carriage studies, or indeed that they were representative of the UK population at that time. There are, however, no suitable modern data across all ages available for analysis and we rely heavily on the assumption that the age-specific patterns of carriage remain similar; thus, the circulating strains were more invasive and not more transmissible than in the late 1980s. The low prevalence of serogroup C carriage in teenagers in the 1999 study [5] suggests that this may not be an unreasonable assumption. Recent cross-sectional carriage prevalence data would be very valuable, but unfortunately the carriage study that was conducted in 1999 [5] focused on a narrow age range (15- to 17-year-olds only), rather than across the population to facilitate the collection of the largest possible number of strains. Large-scale carriage studies are expensive and logistically difficult, so it is unlikely that another cross-sectional carriage study across all ages will be conducted in the near future in the United Kingdom. Alternative approaches to estimating the incidence of carriage could be considered. For example, Auranen estimated the incidence of subclinical Haemophilus influenzae type b (Hib) infection using back-calculation techniques applied to serological data [18].
Coen et al. [4] suggested that a model in which carriage of N. lactamica conferred temporary immunity against carriage with N. meningitidis was more appropriate than a simple SIS model of carriage. We favoured the SIS approach here for several reasons. First, if there is immunity against carriage then given the large number of carriage episodes experienced (an average of 10 carriage episodes by age 30), immunity is likely to be short lived. Second, protection within and between meningococcal serogroups is likely to be important as well as cross-protection from N. lactamica. Information on the degree of cross-protection is scarce and model structures accounting for cross-protection quickly become very complex. The SIS model is a much simpler starting point from which these relationships can be investigated further. Third, there is clear evidence from immunological studies that carriage episodes are important in generating immunity against disease [2] but not necessarily against infection resulting in carriage. This immunity can be accounted for implicitly in the risk of disease given infection in the current model structures.
This work provides the basis for further studies and highlights areas worthy of further investigation. A major area of work is to develop, parameterize and apply mathematical models of meningococcal carriage and disease. In 1999, the United Kingdom introduced meningococcal serogroup C conjugate (MCC) vaccine into the infant immunization schedule and targeted all children aged <18 years in a catch-up campaign [19]. The vaccine campaign reduced the prevalence of serogroup C carriage [5], leading to large herd immunity effects [20]. To model the impact of vaccination, transmission dynamic models, which are able to capture the indirect effects of vaccination, should be used (static models of MCC vaccination such as developed by Tuckwell et al. [21] are not able to capture herd immunity). This work provides the foundations for structuring and parameterizing such transmission dynamic models, which may be useful, for example, to predict the duration of herd immunity or the effects of future changes to the MCC vaccination schedule. Although the same caveats regarding the carriage data apply to the force-of-infection estimates, it should be noted that these models were fitted to, and are consistent with, disease data in addition to the amalgamated carriage dataset. We assumed that the duration of meningococcal carriage was 9 months on average, but it has been postulated that the C2a strains that were prevalent in the late 1990s are more transmissible, but also have a shorter duration of carriage to maintain their low prevalence. These assumptions could be tested in a transmission dynamic model by comparing model predictions to observed data of disease incidence.
The potential for additional data collection and modelling studies to look at the age-specific risk of disease and the role of carriage in the development of immunity against disease is also highlighted. The decline in the risk of disease given infection appears similar to that of the depletion of naive individuals who have not been previously exposed to meningococci and N. lactamica, at least in children (Fig. 4). Of course this relationship may just be an artefact of age, but since carriage has been shown experimentally to be an immunizing event [2, 3] it may be due to immunity built up from exposure to carriage, in which case, cross-protection from N. lactamica and other serogroups is likely to be important. An understanding of these mechanisms may be essential when considering vaccines against strains more commonly carried than serogroup C or vaccines based on N. lactamica outer membrane vesicles that are currently being developed [22]. In these cases, vaccination may disrupt the generation of natural immunity and boosting, with potentially deleterious effects. If the degree of cross-protection between meningococcal serogroups and between N. meningitidis and N. lactamica can be quantified, mathematical models could be developed to explore the possible consequences of such a vaccine strategy.
ACKNOWLEDGEMENTS
We thank Dr Mary Ramsay and Professor Norman Noah for many useful discussions and Dr Emilia Vynnycky for helpful comments on the manuscript. We are grateful to Dr Ed Kaczmarski and the Health Protection Agency Meningococcal Reference Unit for providing data on laboratory confirmed cases and Dr James Stuart for providing data from the Stonehouse Carriage Study.
APPENDIX 1
A function to model the force of infection
The prevalence of carriage by serogroup and age group are shown in Table 1. Since the duration of carriage is assumed to be constant this approximates the shape of the curves for the forces of infection, therefore, a function of an appropriate shape to model these curves is needed. Coen et al. [4] used a variation of the functional form suggested by Farrington [23]. We preferred to use a smoother function, and derived the following function, which is a combination of two curves.
![\lambda \lpar a\rpar \equals \left[ {b \plus {{\lpar c \minus b\rpar } \over {1 \plus {\rm e}^{ \minus \lpar a \minus T\rpar \sol w} }}} \right]\left[ {1 \plus {{\lpar d \minus 1\rpar } \over {1 \plus {\rm e}^{ \minus \lpar a \minus T\rpar \sol w} }}} \right]\comma \hfill](https://cdn.ncbi.nlm.nih.gov/pmc/blobs/c088/2870423/06c2b796888a/S0950268805005339_eqnU1.jpg) |
where a=age, T=age at peak of carriage, w=width of carriage peak and b, c and d are constants. If a is small (young age) then the force of infection tends towards the value of b, if a is large (old age) then the force of infection tends towards cd.
A function to model the risk of disease given infection
The preliminary analysis suggested that a suitable function for describing the risk of disease given infection (denoted here as θi, where i=age) would be one that declined steeply in younger ages, plateauing at older ages (Fig. 5). The following functional form was used:
 |
The best-fitting model parameters are shown in Table 3.
Table 3.
Force of infection (λi) parameters for C, B, O and L, and parameters for the risk of disease given infection (θi) for serogroups C and B. Estimated using disease incidence data from 1998 to 1999, assuming a duration of carriage of 9 months for N. meningitidis and 4 months for N. lactamica
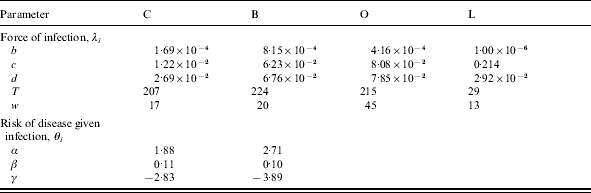
Total model deviance=367.
APPENDIX 2
Maximum-likelihood techniques [12, 24] were used to simultaneously fit the force-of-infection parameters and the risk of disease given infection parameters to the carriage and disease data.
A multinomial model was used to fit the parameters to the carriage dataset. The log likelihood (log  ) of this model is:
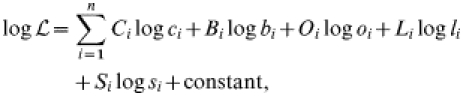 |
where i=age group, C=observed number of C carriers, c=predicted prevalence of C carriers, B=observed number of B carriers, b=predicted prevalence of B carriers, L=observed number of L carriers, l=predicted prevalence of L carriers, S=observed prevalence of susceptibles, s=predicted prevalence of susceptibles.
A Poisson model was used to fit the parameters to the disease data. The log likelihood of the model was calculated as follows:
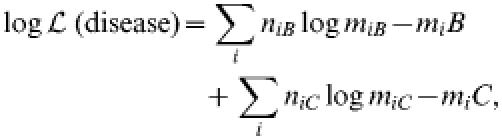 |
where niB=the number of observed serogroup B cases and miB=the number of serogroup B cases predicted by the model, niC=the number of observed serogroup C cases and miC=the number of serogroup C cases predicted by the model and i=age.
The saturated log likelihood (i.e. the log likelihood that would be expected if the model predicted the observed data perfectly) was derived and the deviance was calculated as twice the difference between the model log likelihood (log ) and the saturated log likelihood (log  ): deviance=2(log – log ). The deviance of the model was minimized by simultaneously altering the force-of-infection and risk of disease given infection parameters using the Solver tool within Microsoft Excel (which utilizes the downhill simplex method). There were 209 d.f. for the carriage and disease model, comprising 34×4–20=116 for carriage and 34×3–9=93 for disease.
DECLARATION OF INTEREST
None.
REFERENCES
- 1.Cartwright KA, Stuart JM, Jones DM, Noah ND. The Stonehouse survey: nasopharyngeal carriage of meningococci and Neisseria lactamica. Epidemiol Infect. 1987;99:591–601. doi: 10.1017/s0950268800066449. [DOI] [PMC free article] [PubMed] [Google Scholar]
- 2.Goldschneider I, Gotschlich EC, Artenstein MS. Human Immunity to the meningococcus: II. Development of natural immunity. J Exp Med. 1969;129:1327–1348. doi: 10.1084/jem.129.6.1327. [DOI] [PMC free article] [PubMed] [Google Scholar]
- 3.Gold R, Goldschneider I, Lepow ML, Draper TF, Randolph M. Carriage of Neisseria meningitidis and Neisseria lactamica in infants and children. J Infect Dis. 1978;137:112–121. doi: 10.1093/infdis/137.2.112. [DOI] [PubMed] [Google Scholar]
- 4.Coen PG, Cartwright K, Stuart J. Mathematical modelling of infection and disease due to Neisseria meningitidis and Neisseria lactamica. Int J Epidemiol. 2000;29:180–188. doi: 10.1093/ije/29.1.180. [DOI] [PubMed] [Google Scholar]
- 5.Maiden MCJ, Stuart JM on behalf of the UK Meningococcal Carriage Group. Carriage of serogroup C meningococci one year after meningococcal C conjugate polysaccharide vaccination. Lancet. 2002;359:1829–1830. doi: 10.1016/S0140-6736(02)08679-8. [DOI] [PubMed] [Google Scholar]
- 6.De Wals P, Bouckaert A. Methods for estimating the duration of bacterial carriage. Int J Epidemiol. 1985;14:628–634. doi: 10.1093/ije/14.4.628. [DOI] [PubMed] [Google Scholar]
- 7.Trotter CL, Fox AJ, Ramsay ME et al. Fatal outcome from meningococcal disease – an association with meningococcal phenotype but not with reduced susceptibility to benzylpenicillin. J Med Microbiol. 2002;51:855–860. doi: 10.1099/0022-1317-51-10-855. [DOI] [PubMed] [Google Scholar]
- 8.Anderson RM, May RM. Infectious diseases of humans: dynamics and control. Oxford: Oxford University Press; 1991. [Google Scholar]
- 9.Edwards EA, Devine LF, Sengbusch CH, Ward HW. Immunological investigations of meningococcal disease III. Brevity of group C acquisition prior to disease occurrence. Scand J Infect Dis. 1977;9:105–110. doi: 10.3109/inf.1977.9.issue-2.09. [DOI] [PubMed] [Google Scholar]
- 10.Gilmore A, Jones G, Barker M, Soltanpoor N, Stuart JM. Meningococcal disease at the University of Southampton: outbreak investigation. Epidemiol Infect. 1999;123:185–192. doi: 10.1017/s0950268899002794. [DOI] [PMC free article] [PubMed] [Google Scholar]
- 11.Neal KR, Nguyen-Van-Tam JS, Slack MP, Kaczmarksi EB, White A, Ala’Aldeen AA. Seven-week interval between acquisition of a meningococcus and the onset of invasive disease. A case report. Epidemiol Infect. 1999;123:507–509. doi: 10.1017/s0950268899003192. [DOI] [PMC free article] [PubMed] [Google Scholar]
- 12.Rice JA. Mathematical statistics and data analysis. Belmont, CA: Duxberry Press; 1995. Estimation of parameters and fitting of probability distributions; pp. 239–298. [Google Scholar]
- 13.Goldschneider I, Gotschlich EC, Artenstein MS. Human immunity to the meningococcus: I. The role of humoral antibodies. J Exp Med. 1969;129:1307–1326. doi: 10.1084/jem.129.6.1307. [DOI] [PMC free article] [PubMed] [Google Scholar]
- 14.Trotter CL, Borrow R, Andrews NJ, Miller E. Seroprevalence of serum bactericidal antibodies to serogroup C meningococci in England and Wales in the pre-vaccine era. Vaccine. 2003;21:1094–1098. doi: 10.1016/s0264-410x(02)00630-8. [DOI] [PubMed] [Google Scholar]
- 15.Pollard AJ, Frasch C. Development of natural immunity to Neisseria meningitidis. Vaccine. 2001;19:1327–1346. doi: 10.1016/s0264-410x(00)00333-9. [DOI] [PubMed] [Google Scholar]
- 16.Ramsay M, Kaczmarski E, Rush M, Mallard R, Farrington P, White J. Changing patterns of case ascertainment and trends in meningococcal disease in England and Wales. Commun Dis Rep. 1997;7:R49–R54. [PubMed] [Google Scholar]
- 17.Stanwell-Smith RE, Stuart JM, Hughes AO, Robinson P, Griffin MB, Cartwright K. Smoking, the environment and meningococcal disease: a case control study. Epidemiol Infect. 1994;112:315–328. doi: 10.1017/s0950268800057733. [DOI] [PMC free article] [PubMed] [Google Scholar]
- 18.Auranen K. Back-calculating the age-specific incidence of recurrent subclinical Haemophilus influenzae type b infection. Stat Med. 2000;19:281–296. doi: 10.1002/(sici)1097-0258(20000215)19:3<281::aid-sim344>3.0.co;2-d. [DOI] [PubMed] [Google Scholar]
- 19.Miller E, Salisbury DM, Ramsay ME. Planning, registration, and implementation of an immunisation campaign against meningococcal serogroup C disease in the UK: a success story. Vaccine. 2001;20:S58–S67. doi: 10.1016/s0264-410x(01)00299-7. [DOI] [PubMed] [Google Scholar]
- 20.Ramsay ME, Andrews NJ, Trotter CL, Kaczmarski EB, Miller E. Herd immunity from meningococcal serogroup C conjugate vaccination in England. BMJ. 2003;326:365–366. doi: 10.1136/bmj.326.7385.365. [DOI] [PMC free article] [PubMed] [Google Scholar]
- 21.Tuckwell HC, Hanslik T, Valleron AJ, Flahault A. A mathematical model for evaluating the impact of vaccination schedules: application to Neisseria meningitidis. Epidemiol Infect. 2003;130:419–429. [PMC free article] [PubMed] [Google Scholar]
- 22.Gorringe A, Halliwell D, Matheson M, Reddin K, Finney M, Hudson M. The development of a meningococcal disease vaccine based on Neisseria lactamica outer membrane vesicles. Vaccine. 2005;23:2210–2213. doi: 10.1016/j.vaccine.2005.01.055. [DOI] [PubMed] [Google Scholar]
- 23.Farrington CP. Modelling forces of infection for measles, mumps and rubella. Stat Med. 1990;9:953–967. doi: 10.1002/sim.4780090811. [DOI] [PubMed] [Google Scholar]
- 24.Williams BG, Dye C. Maximum likelihood for parasitologists. Parasitol Today. 1994;10:489–493. doi: 10.1016/0169-4758(94)90163-5. [DOI] [PubMed] [Google Scholar]