

SUMMARY
We evaluated three established statistical models for automated ‘early warnings’ of disease outbreaks; counted data Poisson CuSums (used in New Zealand), the England and Wales model (used in England and Wales) and SPOTv2 (used in Australia). In the evaluation we used national Swedish notification data from 1992 to 2003 on campylobacteriosis, hepatitis A and tularemia. The average sensitivity and positive predictive value for CuSums were 71 and 53%, for the England and Wales model 87 and 82% and for SPOTv2 95 and 49% respectively. The England and Wales model and the SPOTv2 model were superior to CuSums in our setting. Although, it was more difficult to rank the former two, we recommend the SPOTv2 model over the England and Wales model, mainly because of a better sensitivity. However, the impact of previous outbreaks on baseline levels was less in the England and Wales model. The CuSums model did not adjust for previous outbreaks.
INTRODUCTION
With recent developments in world politics, monitoring infectious diseases statistically has increased in importance. Bioterrorism and biological warfare have sparked the development of computer systems for automatically detecting sudden changes in public health. Both the United States and the European Union invest large amounts of money for protection against these threats [1, 2]. This adds to more traditional reasons for surveillance of communicable disease, e.g. outbreak detection, monitoring trends of infectious diseases, and evaluating public health interventions [3].
In the detection of outbreaks of communicable diseases, it is desirable to minimize the time period between the actual start of the outbreak and the time the system provides a warning. Different statistical models have been developed for this purpose, but we have been unable to find a systematic comparison between the different systems. In preparation, before the introduction of an automated system for outbreak detection of communicable diseases in Sweden, we evaluated three commonly used models designed to identify outbreaks sufficiently early to allow time for interventions. In order to evaluate the models, we used retrospective epidemiological data from the national Swedish surveillance system of communicable diseases.
METHODS
Data
The Swedish Institute for Infectious Disease Control (SMI) is a governmental expert agency, with the task of protecting the Swedish population from communicable diseases. An important part of national communicable disease control is surveillance based on statutory notifications of 58 infectious diseases regulated by the Communicable Disease Act. A double notification system is used for each case of such disease. The two reports emanate from the clinician treating the patient and from the laboratory having diagnosed the causative agent. Reports for the same patient are linked using a personal identification number issued to all Swedish residents, and used in all contacts with the Swedish health care system. This double reporting system considerably increases the sensitivity of the surveillance system [4]. Whenever a laboratory performs microbiological typing, e.g. serotyping and phage typing for salmonellosis, such data are included in the laboratory report and used in the detection and investigation of outbreaks.
All analyses were based on the date of registration at the national database at the SMI. The flow of information and timeliness in the surveillance system has previously been studied in detail, and the median delay between diagnosis and registration of the report was previously (1998–2002) 1–2 weeks [5]. Since 2004, a new electronic surveillance system has been in use with automatic reporting from the laboratories, allowing the detection of events in real time.
For the evaluation of the three statistical models we used retrospective epidemiological data for three diagnoses with different outbreak patterns compiled by the SMI between 1992 and 2004; i.e. campylobacteriosis, hepatitis A and tularemia. Campylobacteriosis is the most commonly reported bacterial intestinal infection reported in Sweden with several previous large and small outbreaks; hepatitis A has previously given rise to many small outbreaks both secondary for returning travellers and in intravenous drug users, and tularemia typically produces outbreaks when the rodent host population of the causative agent Francisella tularensis is increasing. The number of cases per week was studied. Thus, it was assumed that the population was constant during the study period. A baseline of 5 years starting with data between 1992 and 1997 was the base for estimating the expected number of cases for the following week.
Models investigated
We chose to evaluate and analyse three statistical models. A detailed description of the models evaluated can be found in a thesis by Rolfhamre [6].
CuSums (CuSums charts)
Developed in the early 1950s, the CUmulative Sum is a method for highlighting changes from a production average level [7]. It is a sequential hypothesis test, adding together the differences between the expected and the observed. A warning is produced if the sum significantly differs from a calculated threshold. CuSums is used to automatically detect possible outbreaks in New Zealand [8], and has been frequently used for prospective analysis.
England and Wales model
The England and Wales model is used for surveillance of weekly reports of infectious diseases (4000–5000 infectious agents) to the Communicable Disease Surveillance Centre (CDSC) in England and Wales [9, 10]. It uses data from the previous 5 years for baseline calculations, weighted to minimize the contribution of previous outbreaks. A regression model is used to calculate the threshold.
SPOTv2
The SPOTv2 model [11, 12] is used for salmonellosis surveillance on a national level in Australia (National Enteric Pathogens Surveillance Scheme). It uses data from the previous 5 years for baseline calculations, weighted to minimize the contribution of previous outbreaks. All retrospective epidemiological information intended as a base for the evaluation is listed as cases per week.
Evaluation of the systems
We calculated sensitivity and positive predictive value (PPV) as defined in ‘Guidelines for evaluating surveillance systems’ from the Centers for Disease Control and Prevention (CDC) [13]. As the basis of these evaluations we introduced two variables: ‘relevant events’ and ‘warnings’. A warning triggered by a model may or may not detect a relevant event, e.g. an outbreak. In terms of warnings and relevant events sensitivity and PPV were defined as (gold standard is 100%):
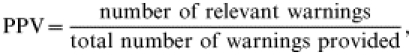 |
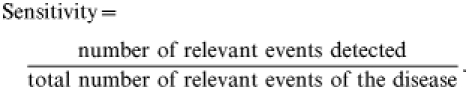 |
Definition of ‘relevant events’
Relevant events are unexpected increases in incidence, i.e. suspected outbreaks that we aimed to detect using the evaluated models (long-term trends and known seasonal variation excluded). To retrospectively define a relevant event of epidemiological importance we used two combined approaches:
Epidemiologists at the SMI routinely follow each disease under study, and events of interests (mainly outbreaks) are recorded. At the end of the year these epidemiologists report the main events of interest for all notifiable diseases in an annual report, based mainly on their public health impact [14]. We retrospectively used the annual reports, complemented by personal communications with the responsible epidemiologists, to pinpoint relevant events during the study period.
By ‘eye-balling’ the graphs illustrating the number of reported cases to the SMI (Fig. 1) for the three diseases evaluated, we identified some unexpected peaks in incidence. These were reviewed with the epidemiologist in charge, and if those cases could be linked to a known outbreak they were also included as relevant events.
Fig. 1.

Plot showing the number of cases of (a) campylobacteriosis, (b) hepatitis A and (c) tularemia reported to the SMI during 1992–2003.
Definition of ‘warning’
Each week the models discriminated between two states; the in-control state (0) and the out-of-control state (1). During an outbreak, the models may trigger a warning during several consecutive weeks, but the first warning would be the most important for the timely detection of an outbreak. We, therefore, defined a warning as the transition from the in-control state to the out-of-control state, i.e. the 0/1 transition. In order to best formally evaluate the sensitivity and PPV of the systems, all other warnings were filtered to reduce redundancy.
RESULTS
The retrospective data are summarized in Table 1 and Figure 1, and the results of sensitivity and PPV calculations in Table 2.
Table 1.
The number of cases reported each year to the SMI (1 January 1992 to 21 September 2003) and the number of ‘relevant events’ for campylobacteriosis, hepatitis A and tularemia per year (1992–1996 was only used for baseline calculations)
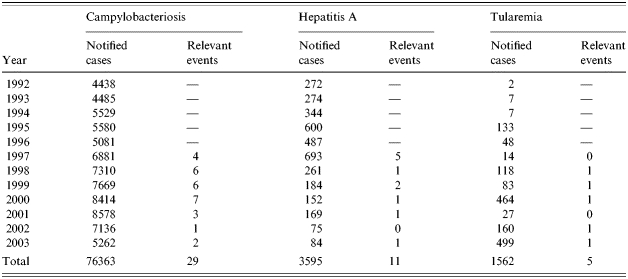
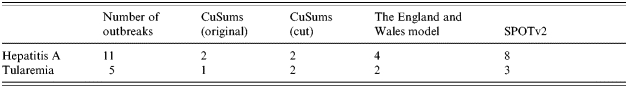
Table 2.
Detection of relevant events (outbreaks) of campylobacteriosis (29 relevant events), hepatitis A (11 relevant events) and tularemia (5 relevant events)

In the CuSums column: [Original CuSums]/[Cut CuSums (St>20 St=0)].
PPV, Positive predictive value.
See the Discussion section for an explanation.
Counted data Poisson CuSums
After performing the evaluation for the CuSums model, it could be seen by the evaluation plot (Fig. 2) that the model was not very accurate. We, therefore, modified the model and evaluated this second CuSums model as well, which was done by resetting all CuSum values exceeding 20. Thus, the evaluation of the CuSums model was, in principle, two different evaluations. The sensitivity varied between 43 and 100% for both the originally calculated CuSums and the modified CuSums version (average 67 and 71% respectively). The PPV varied between 4 and 60% for the originally calculated CuSums (average 18%) and varied between 36 and 100% for the modified version (average 53%).
Fig. 2.

Illustration of the outbreak detection of retrospective campylobacteriosis data (1992–2003) using CuSums. The impact of the increasing trend in 1997 was so strong that the CuSums did not recover until 2004, implying that all outbreaks between 1997 and 2004 would be missed.
The England and Wales model
The model used a weighting process based on deviations from the model, to reduce previous outbreaks in the baseline. It is difficult to illustrate the result of the reduction, but in the evaluation previous extremes were reduced to ∼85% (58–100%) of the original level, in the evaluation data. The sensitivity varied between 74 and 100% (average 87%) and the PPV varied between 45 and 100% (average 82%).
The SPOTv2 model
The model used a mix of Hanning moving averages and moving medians to reduce previous outbreaks in the baseline. Previous extremes were reduced to ∼80% (76–90%) of the original level. The sensitivity varied between 86 and 100% (average 95%) and the PPV varied between 31 and 100% (average 49%).
Swiftness comparison
It was not obvious how to calculate the time period between when an outbreak actually started and when our models provided a warning. We could, however, compare the models in order to see which model first detected an outbreak. Taking into account that it was much more difficult to decide when an outbreak started for campylobacteriosis, than for the other two model diseases, we concentrated on the other two (Table 3). It was quite even between the models as to which detected an outbreak first, but the SPOTv2 model was first to detect the outbreaks more frequently than the others. This is by no means evidence of which model was the ‘fastest’, but the table does provide an indicator.
Table 3.
Summary of number of first discovered outbreaks for hepatitis A and tularemia (note that more than one model can be first to detect an outbreak)
DISCUSSION
Model diseases
In this evaluation of statistical models for automatic outbreak detection we chose three model diseases with different epidemiology, modes of transmission and outbreak potentials. For campylobacteriosis, the true number of outbreaks during the period was probably much higher than the figures presented. However, since the same set of retrospective data was used for all three models, we disregarded this phenomenon when comparing the models [15, 16].
In the mid-1990s, a hepatitis A epidemic due to contaminated amphetamine infected some 100 intravenous drug users in the Malmö region of Southern Sweden. Subsequently, the epidemic spread to Göteborg on the west coast of Sweden, and in 1997 to the capital Stockholm on the east coast [16].
Tularemia is a disease with low incidence, with cases infected mainly in the northern part of Sweden. Large outbreaks had occurred in 1970, 1981, 2000, and 2003 [16].
Choice of models to test
In order to find which statistical models to evaluate, we reviewed the literature. A number of different statistical models have been developed and evaluated [9–12, 17–21]. We planned to compare the sensitivity and PPV from previous studies in the evaluation of the different models, but not all papers provided these data, and due to the lack of a ‘gold standard’, the data provided were not comparable.
Counted data Poisson CuSums
Brown et al. tried to detect clusters of nosocomial infection in data from 1995 to 2000. They compared CuSums and a moving average and concluded CuSums to be the superior. Further, they concluded the PPV to be 83–96%. No sensitivity was presented [17]. Hutwagner et al., in the United States, used information from the years 1992 to 1997 to calculate the baseline, and then to analyse retrospective data of Salmonella serotypes over the next 5 years for each state reporting. They concluded the sensitivity by state in which the outbreak was reported to be from 0 to 100% and the PPV from 64 to 100% [18]. O’Brien & Christie analysed retrospective data from 1985 to 1996 of Mycoplasma pneumonia, using a 13-week moving average to calculate the predicted value. They concluded: ‘at national level, however, where data are further aggregated, CuSums could quickly detect both focal and non-focal increases in low prevalence conditions, facilitating investigations in order to establish the reason for the increase’ [19].
One great disadvantage of the CuSums model is the lack of control for previous outbreaks, resulting in decreased sensitivity in a disease like hepatitis A, with a major outbreak occurring during a number of years in the mid-1990s (Fig. 3). The lack of reduction does not only decrease the sensitivity of the model, but also the ability to monitor trends in diseases. To improve the model, one could use the reduction process of either the England and Wales model or the SPOTv2 model. It is not clear, however, what impact this would have. All CuSums depend by definition on the previous, i.e. a possible outbreak last week will have an impact on this week, causing a higher CuSums than normally. Due to this, the magnitude of a possible outbreak affects the time for the CuSums to recover. An example of this can be seen in Figure 3, where the evaluation graph of hepatitis A is presented. At the start of 1997, a small (though greater than by chance) increase in the retrospective data triggered a warning (max St≈5). Compare this with the major outbreak detected immediately after, in the middle of 1997, when max St>50. The recovery times of the CuSums was ∼10 weeks and 1 year respectively for the two warnings. During that year no outbreaks could be detected. This was the main reason for introducing the ‘cut CuSums’, where all CuSums exceeding St=20 were cut off. This allowed the CuSums to recover in <10 weeks, compared to 1 year in the latter of the above outbreaks. Since we cut the CuSums when it exceeded St=20, there was no guarantee that the detected outbreak had ended, triggering another warning directly. Thus, we might get an increase in the number of warnings per outbreak, but this can be considered as being better than no warning at all.
Fig. 3.

Illustration of the outbreak detection of retrospective hepatitis A data (1992–2003) using CuSums.
The England and Wales model
The study of Farrington et al. in 1996, using real epidemiological data, showed that ∼40% of all warnings corresponded to outbreaks or other events of public health interest. About 30% corresponded to increases of questionable epidemiological interest, and the remaining 30% corresponded to faults in the reporting, such as batching of reports by one laboratory [10]. Carlsund compared the England and Wales model with a time-series analysis model and concluded that the England and Wales model was superior for high-incidence diseases [20].
In comparison to the CuSums model, the recovery time of the system was instantaneous when a warning was produced. The weighting process to reduce previous outbreaks seemed to work properly. It was not obvious how to verify the process, since it was included in the model. In order to get an indication of the correctness of the weighting process, we observed the evaluation graph of hepatitis A (Fig. 4). During the years 1994 and 1998, there were major outbreaks in Sweden, causing the number of cases each week to double. When using these data in the baseline, without any reduction of previous outbreaks, the sensitivity of detecting new outbreaks was decreased. This is exemplified when using CuSums (Fig. 3), where there was no detection activity at all between mid-1998 and mid-2003. By observing the detection of the England and Wales model we saw an even flow of detection activity during the same time period (the same phenomenon could be observed when using the SPOTv2 model).
Fig. 4.

Illustration of the outbreak detection of retrospective hepatitis A data (1992–2003) using the England and Wales model.
Even though the England and Wales model proved to have high sensitivity and PPV when detecting campylobacteriosis, it produced a larger number of irrelevant warnings (more than 1·6 warnings per detected relevant event). Although it was easy to manually filter them out, the number was too high. Due to this, the PPV of the other two models was affected, i.e. the PPV for campylobacteriosis using the England and Wales model was in reality lower and the corresponding PPV for the CuSums and the SPOTv2 model was in reality higher. The reason for this is the difficulty in deciding the time period of an actual outbreak, especially for high-incidence diseases like campylobacteriosis. Since the England and Wales model provided a large number of warnings, we had, in equal numbers, many decisions to make with regard to whether one week belonged to this outbreak, another outbreak or perhaps no outbreak at all. Since we used the same set of time periods for all three model evaluations, this had an impact on the PPV of the other two models.
The SPOTv2 model
Stern & Lightfoot evaluated the model with epidemiological information (salmonellosis and shigellosis) over 3 years with >90% sensitivity and >50% PPV [21].
Compared to the England and Wales model, there was a better balance between the number of warnings and the number of detected outbreaks. One warning per actual outbreak is sufficient to detect the disease and any further warnings are unnecessary.
The SPOTv2 model may experience problems when detecting diseases like tularemia. An example of this is illustrated in the evaluation graph of tularemia (Fig. 5). When evaluating the years 1997–2000, we used the years 1992–1999 as baseline. Note that the standard deviation (s.d.), illustrated as the distance between the predicted value and the threshold, when we started detecting in 2001 and the outbreak year of 2000 was included in the baseline. The s.d. was doubled, which implies a decreased sensitivity. The high s.d. was kept during all years for which 2000 was included in the baseline. Looking to the future, we might notice that when predicting the years following 2003, the other major outbreak this year will also be included in the baseline, implying an even higher s.d. (although not as big increase as in 2001). Ideally, the reduction of the previous outbreaks would filter out the major outbreaks of 2000 and 2003.
Fig. 5.

Illustration of the outbreak detection of retrospective tularemia data (1992–2003) using the SPOTv2 model.
The reduction of previous outbreaks encountered more problems when evaluating hepatitis A. Since the reduction was designed to smooth the edges of a long period of extremes rather than reduce the outbreak itself, the major outbreak in the mid-1990s was not really reduced, but smoothed. This is obviously better than no reduction at all, but there is a great potential in the model to improve the PPV. In fact, any outbreak lasting longer than 10 weeks may experience the same problem.
SPOTv2 proved to be the best choice for detecting trends in the data. This is an advantage when detecting diseases like Chlamydia infections, where trends are interesting, but a disadvantage when detecting campylobacteriosis, which may experience some trends during early years, but return towards a base value in a long-term perspective. An example of this is illustrated in the evaluation graph of campylobacteriosis (Fig. 6). The predicted value (as well as the threshold) showed a clear trend over time, due to an increasing trend over the years 1996–2001.
Fig. 6.

Illustration of the outbreak detection of retrospective campylobacteriosis data (1992–2003) using the SPOTv2 model.
Conclusions
In this analysis, the CuSums could not compete in sensitivity and PPV with the England and Wales model and SPOTv2. The main reason being that the CuSums does not adjust for previous outbreaks in the baseline. It was more difficult to rank the other two models. However, we would recommend SPOTv2 over the England and Wales model for the following reasons. First, SPOTv2 produced fewer warnings than the England and Wales model, without losing PPV. Less warnings implies better sensitivity than the England and Wales model, which for our purposes is the most important argument in selecting SPOTv2 over the England and Wales model. Second, SPOTv2 was easier to implement and ran faster than the England and Wales model. Third, although it was difficult to compare the swiftness of the models, as they were all fast, SPOTv2 seemed to outperform the England and Wales model.
The main advantage of the England and Wales model over SPOTv2 was in the reduction of previous outbreaks. The England and Wales model produced better results than the SPOTv2 model. However, SPOTv2 was by no means bad at reduction and this argument was not sufficient to change our opinion.
One factor that we did not consider in this formal evaluation focusing on sensitivity and PPV was the added value of repeated warnings. In sustained outbreaks, repeated warnings could further motivate outbreak investigations. In a country like Sweden with few outbreaks and good resources to investigate any suspected outbreak, this is of less importance, while in countries with many outbreaks and scarce resources for public health investigations the ability of an alert system to give repeat warnings could be imperative.
We based our opinions on the evaluation of campylobacteriosis, hepatitis A and tularemia data. Our conclusions only consider these three diseases, although we believe them to be representative of many other communicable diseases as well.
ACKNOWLEDGEMENTS
We express our deepest gratitude to Patricia Geli, M.Sc. (Stockholm University and the Swedish Institute for Infectious Disease Control) for professional statistical input.
DECLARATION OF INTEREST
None.
REFERENCES
- 1.Commission of the European Countries. Communication from the commission to the council and the European Parliament – On cooperation in the European Union on preparedness and response to biological and chemical agent attacks (Health Security), Commission of the European Countries, COM(2003) 320 final, 2003.
- 2.The White House. http://www.whitehouse.gov/news/releases/2003/02/20030228-1.html. http://www.whitehouse.gov/news/releases/2003/02/20030228-1.html Today’s Presidential Action, Factsheet, The White House – President George W. Bush, News 20030228, 2003. ). Accessed 1 December 2004.
- 3.Teutsch SM, Churchill RE. Principles and Practice of Public Health Surveillance. 2nd edn. Oxford: Oxford University Press; 2000. [Google Scholar]
- 4.Jansson A et al. Sensitivity of case reporting in the Swedish statutory surveillance of communicable diseases 1998–2002. Epidemiology and Infection. 2005;133:401–407. doi: 10.1017/s0950268804003632. [DOI] [PMC free article] [PubMed] [Google Scholar]
- 5.Jansson A et al. Timeliness of case reporting in the Swedish statutory surveillance of communicable diseases 1998–2002. Scandinavian Journal of Infectious Diseases. 2004;36:865–872. doi: 10.1080/00365540410025348. [DOI] [PubMed] [Google Scholar]
- 6.Rolfhamre P. http://www.nada.kth.se/utbildning/grukth/exjobb/rapportlistor/2003/rapporter03/rolfhamre_per_03130.pdf. http://www.nada.kth.se/utbildning/grukth/exjobb/rapportlistor/2003/rapporter03/rolfhamre_per_03130.pdf Outbreak detection of communicable diseases – design, analysis and evaluation of three models for statistically detecting outbreaks in epidemiological data of communicable diseases [Master’s thesis]. Stockholm: Department of Numerical Analysis and Computer Science, Stockholm University, 2003. ). Accessed 1 December 2004.
- 7.Lucas JM. Counted Data CUSUM’s. Technometrics. 1985;27:129–144. [Google Scholar]
- 8.Public Health Early Warning (PHEW!) System. http://www.phew.govt.nz. http://www.phew.govt.nz ). Accessed 1 December 2004.
- 9.Farrington CP, Beale AD. Computer-aided detection of temporal clusters of organisms reported to the Communicable Disease Surveillance Center. CDR Review. 1993;3:R78–R82. [PubMed] [Google Scholar]
- 10.Farrington CP et al. A statistical algorithm for the early detection of outbreaks of infectious Disease. Journal of the Royal Statistical Society, Series A. 1996;159:547–563. [Google Scholar]
- 11.Stern L. Melbourne: Department of Computer Science, University of Melbourne; Australia: 1993. A practical algorithm for the detection of clusters in sparse epidemiological data [Technical Report] [Google Scholar]
- 12.Stern L Singapore: World Scientific; 1996. pp. 1395–1404. Automated detection of Salmonella outbreaks. . Proceedings of the first World Congress on Computational Medicine, Public Health and Biotechnology. ; Part III, : pp. [Google Scholar]
- 13.Klaucke DN et al. Guidelines for evaluating surveillance systems. Morbidity and Mortality Weekly Report. 1988;37:1–18. (Suppl 5): [Google Scholar]
- 14.Ekdahl K. http://www.smittskyddsinstitutet.se/upload/Publikationer/Report2001.pdf. http://www.smittskyddsinstitutet.se/upload/Publikationer/Report2001.pdf Communicable diseases in Sweden 2001. The annual report of the Department of Epidemiology. Solna: Swedish Institute for Infectious Disease Control (SMI), 2002. ). Accessed 1 December 2004.
- 15.Lindbäck J, Svensson Å. Stockholm: Department of Mathematical Statistics, Stockholm University; 2001. Campylobacter infections in Sweden – A statistical analysis of temporal and spatial distributions of notified sporadic campylobacter infections [Research report] [Google Scholar]
- 16.Swedish Institute for Infectious Disease Control (SMI). http://www.smittskyddsinstitutet.se. http://www.smittskyddsinstitutet.se Surveillance Statistics. ). Accessed 1 December 2004.
- 17.Brown SM et al. Binary cumulative sums and moving averages in nosocomial infection cluster detection. Emerging Infectious Diseases. 2002;8:1426–1432. doi: 10.3201/eid0812.010514. [DOI] [PMC free article] [PubMed] [Google Scholar]
- 18.Hutwagner LC et al. Using laboratory-based surveillance data for prevention: an algorithm for detecting Salmonella outbreaks. Emerging Infectious Diseases. 1997;3:395–400. doi: 10.3201/eid0303.970322. [DOI] [PMC free article] [PubMed] [Google Scholar]
- 19.O’Brien SJ, Christie P. Do CuSums have a role in routine communicable disease surveillance. Public Health. 1997;111:255–258. doi: 10.1016/s0033-3506(97)00044-9. [DOI] [PubMed] [Google Scholar]
- 20.Carlsund A. Stockholm: Institute for Insurance Mathematics and Mathematical Statistics, Stockholm University; 1997. Alert system for communicable diseases [Master’s thesis] [Google Scholar]
- 21.Stern L, Lightfoot D. Automated outbreak detection: a quantitative retrospective analysis. Epidemiology and Infection. 1999;122:103–110. doi: 10.1017/s0950268898001939. [DOI] [PMC free article] [PubMed] [Google Scholar]