

SUMMARY
Co-circulation of respiratory syncytial virus (RSV) and influenza has made the partitioning of morbidity and mortality from each virus difficult. Given the interaction between chronic obstructive lung disease (COPD) and pneumonia, often one can be mistaken for the other. Multivariate time-series methodology was applied to examine the impact of RSV and influenza on hospital admissions for bronchiolitis, pneumonia, and COPD. The Granger Causality Test, used to determine the causal relationship among series, showed that COPD and pneumonia are not influenced by RSV (P=0·2999 and 0·7725), but RSV does influence bronchiolitis (P=0·0001). Influenza was found to influence COPD, pneumonia, and bronchiolitis (P<0·0001). The use of multivariate time series and Granger causality applied to epidemiological data clearly illustrates the significant contribution of influenza and RSV to morbidity in the population.
INTRODUCTION
Respiratory syncytial virus (RSV) and influenza virus are known to be two of the most common causes of substantial respiratory morbidity and mortality in the population. RSV infections historically have been associated primarily with childhood respiratory infections and morbidity amongst the very young, specifically in the form of bronchiolitis and, to a lesser degree, pneumonia [1]. Influenza has a well-documented and well-established relationship with pneumonia morbidity and mortality as well as with worsening chronic obstructive lung disease (COPD) [2]. However, an unresolved issue is the extent to which RSV contributes to pneumonia morbidity, particularly amongst older patients [3, 4]. Recent studies, clinical and epidemiological, have indicated that RSV plays a significant role in respiratory morbidity and mortality in the elderly [5, 6].
There is strong evidence that RSV and influenza co-circulate, making the partitioning of morbidity and mortality attributable to these illnesses difficult [7]. Viral co-circulation confounds the estimation of the influence of influenza vaccination programmes on the reduction of respiratory morbidity and mortality in the population. Quite simply, if a population is well vaccinated against a well-matched influenza strain, but RSV co-circulates at the same time as influenza, considerable respiratory morbidity and mortality may still be present in the population, giving rise to the impression that influenza vaccination is ineffective.
In this paper, multivariate time-series methodologies are employed to examine the impact of RSV and influenza virus circulation on hospital admissions for bronchiolitis, pneumonia, and COPD. Further, using the Granger causality criterion we test the independent effects that each viral pathogen has on these hospital admissions.
METHODS
Data sources
The Canadian Institutes of Health Information Discharge Abstract Database was used to obtain weekly hospitalization data for COPD, pneumonia and influenza, and bronchiolitis beginning on the first week of January 1997 to the last week of March 2002 (n=274). This database records discharges from all in-patient hospital stays in Ontario acute care hospitals, documenting a scrambled patient identifier, date of admission and discharge, up to 16 diagnoses as coded by the International Classification of Diseases, Ninth Revision, Clinical Modification (ICD-9-CM), and up to 10 procedures. All records with a principal discharge diagnosis of COPD (ICD-9 code: 490–492), pneumonia and influenza (ICD-9 code: 480–487) and bronchiolitis (ICD-9 code: 466) were selected.
Researchers using this database have found that diagnoses are coded with a high degree of accuracy [8]. There is very little missing information in the Ontario database; other province-level studies have similarly found that <1% of the basic information on patients is missing [9]. The reliability of the coding of data collected by the Canadian Institute for Health Information is 74–96% for the ICD-9 diagnosis.
The total number of admissions was calculated for each week by diagnosis code. Denominators are derived from annual census data for residents of Ontario, provided by Statistics Canada. Weekly population estimates were derived through linear interpolation. Using this data, weekly hospitalization rates per 100 000 population were calculated. All transfers from within one acute care hospital to another within this study group were excluded from the analysis.
Weekly isolates of viral subtypes (RSV and influenza) covering the study period were obtained from Health Canada.
Statistical methods
The hospitalization and viral isolate rates were log transformed in order to stabilize the variance. Since the peak weeks were different from year to year, we decided to use the calendar month for estimating seasonal factors of each series. The seasonality components for each series were then calculated using 11 dummy (indicator) variables in a regression model. Our data is weekly. The assigned date to our weekly data is the date of the sixth day of the week (Saturday). We assigned corresponding month to each observation based on the date of observation which is the date of the sixth day of the week. Now each observation is assigned its corresponding month. We have 12 months therefore we need 11 dummy variables in our regression model. If we call those dummy variables d1–d11 then d1=1 if the month is January;=0 otherwise; d2=1 if the month is February;=0 otherwise; and so on until d11=1 if the month is November;=0 otherwise.
The estimated seasonality was subtracted from the original series to seasonally adjust the data. The autocorrelation functions of the seasonally adjusted series were inspected for stationarity.
In practice, much of time-series data consists of measuring several variables simultaneously over time, which best can be considered as components of a vector-valued (multivariate) time series When the components of a vector-valued time series are related to each other, then the interdependence between series must be taken into account in the analysis. The extension of univariate time-series models to multivariate models allows researchers to analyse interdependent time-series data properly. The main diagonal elements of the estimated coefficient matrices of the multivariate autoregressive model show the temporal contribution of the past values on the present value. The off-diagonal elements show the contribution of the past values of a series on the present value of that series. When there is no feedback relationship, the off-diagonal elements of the coefficient matrices are statistically zero [10]. The multivariate time-series model is fitted to data using the varmax procedure of the SAS 9.1 statistical package (SAS Institute Inc., Cary, NC, USA).
Multivariate models
Let the vector (btctptrtft)t represent the standardized seasonal adjusted log-transformed rates of bronchiolitis, COPD, pneumonia, RSV, and influenza per 100 000 respectively, at time t. In calculating the rate for each series, the numerator consisted of the number of diseases and viral isolates for each week, and the denominators were constructed from annual census data provided by Statistics Canada for the residents of the province of Ontario. Weekly population estimates were derived through linear interpolation. From this data, weekly admission and viral isolate rates per 100 000 population were calculated for each disease. Viral isolate rates are derived from the percentage of positive isolates converted to a rate per 100 000 population. Visual inspection of the time plots of the rates of diseases did not reveal any trend in the series. All five rates are first log-transformed and then a regression model with the month as the only predictor was used to estimate the seasonal components for each series. After removing seasonality means and standard deviations, of the deseasonalized series are calculated. The series are standardized (centred) by subtracting the mean and then dividing by the standard deviation to make the estimated parameters comparable. We fitted a vector autoregressive model of order 2 and inspected all elements of the estimated coefficients matrices. The estimated parameters which were not statistically significant were forced to be zero. The non-zero parameters of the final model were statistically significant at the level of 5%. The estimated model is as follows:
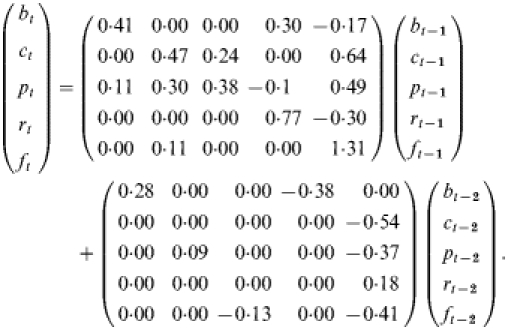 |
If we expand the above model we would have five univariate equations which represent the functional relationships between each series and the others. For example, bt=0·41bt−1+0·30rt−1−0·17ft−1+0·28bt−2−0·38rt−2 shows that the log-transformed rate of bronchiolitis at time t is a function of the log-transformed rate of bronchiolitis, RSV and influenza 1 week previous, and bronchiolitis and RSV 2 weeks previous. For example, the magnitude of the estimated coefficient of RSV at time t−1 in the above equation shows the contribution of that series in determining the value of bronchiolitis at time t.
Granger causality
In econometrics, the Granger Causality Test [11, 12] has been used extensively for determining the Granger causal relationship among series. If we observe two series {xt} and {yt} we are interested to know whether movements in {xt} precede movements in {yt} or is it the opposite, or are the movements contemporaneous? In other words, the variable xt is causing yt if we can predict yt better by using all available information, and xt than if all the information apart from xt had been used.
RESULTS
The Figure shows the time-series data for the study period. There are consistent elevations in hospital admissions accompanied by the presence of RSV and influenza virus isolates.
Fig.

Rates of respiratory disease hospitalization and viral isolations per 100 000 by week in Ontario (1 January 1997 to 30 March 2002). ·······, Bronchiolitis; - - - - - -, chronic obstructive lung disease; ·-·-·-·, pneumonia; ––––, influenza; ––––, respiratory syncytial virus.
The estimated coefficients of the 1 week previous and 2 weeks previous of the multivariate model are presented in the Table. For predicting bronchiolitis, we see that its major determinants are its log-transformed rates over the past 2 weeks. It also shows that RSV and influenza log-transformed rates are affecting the log-transformed rates of bronchiolitis, while COPD and pneumonia are not. For predicting COPD, influenza log-transformed rates followed by log-transformed rates of COPD and then pneumonia, in the previous week, are the main determinants. Bronchiolitis and RSV have no affect on COPD hospitalizations. Similarly for pneumonia hospitalizations, influenza is the main determinant. However, bronchiolitis, RSV and pneumonia in the previous week also are determinants of pneumonia hospitalizations. For forecasting RSV, the major determinant is the log-transformed rate of RSV in the previous week while influenza in the previous week appears to have a negative effect on RSV log-transformed rates. Finally, for predicting influenza, influenza in the previous week is the main determinant. The diagonal elements of the Table are all significant in week 1 which shows that the temporal pattern is one of the major determinants of each of the respective health outcomes. The significant negative coefficients in week 1 and in week 2 of the multivariate model (see the fitted model in the Methods section and Table) are limited primarily to the RSV and influenza outcomes which are derived from isolate data.
Table.
Estimated coefficients of the multivariate model
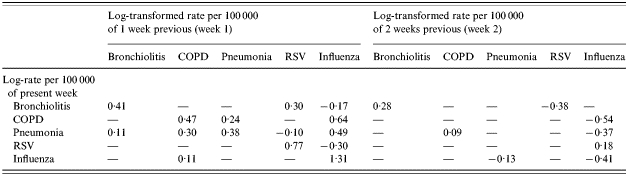
COPD, Chronic obstructive lung disease; RSV, respiratory syncytial virus.
—, Indicates zero coefficients.
We applied the Granger Causality Test to determine whether RSV and influenza are Granger causal of COPD, pneumonia and bronchiolitis. The results of the test are as follows: COPD and pneumonia are not influenced by RSV (P=0·2999 and 0·7725 respectively), however bronchiolitis is influenced by RSV (P=0·0001). COPD, pneumonia, and bronchiolitis are all influenced by influenza (all three P values are <0·0001).
DISCUSSION
The results of this study show that RSV is the primary influence for bronchiolitis admissions, and influenza is the primary influence for pneumonia and COPD admissions. There is substantial interaction between COPD and pneumonia, probably reflecting the difficulty of separating these clinical conditions, and hence one can often masquerade as the other. RSV on its own did not substantially influence pneumonia admissions using Granger causality criteria, however, it did influence bronchiolitis. COPD, pneumonia, and bronchiolitis are all influenced by influenza.
Recent research has highlighted the importance of RSV in both paediatric and vulnerable older populations. Falsey et al. [5], in a prospective cohort study, showed that the public health impact of RSV on older adults was substantial, particularly among adults with cardio-respiratory diseases. Therefore, the question arises as to why RSV did not strongly influence pneumonia hospitalizations in this study? One explanation comes from the fact that this analysis considered all ages in aggregate. A future analysis looking at the independent effects of RSV and influenza on age-specific cohorts for pneumonia is therefore recommended.
This study has certain limitations. The viral isolate data are likely to be underestimates of the true prevalence of viral circulation. There may be a lag in the collection of respiratory isolates in the early part of the time series as they were collected on an ad hoc basis. However, in the later part of the time series, respiratory isolates were collected by a surveillance protocol. The analysis is ecological. There is no linkage between viral isolates and hospital admissions. The strengths of the study lie in the use of a large population base, and a long study period which is heterogeneous in terms of exposure and outcome.
This study illustrates the utility of multivariate time series and Granger causality test for application to epidemiological data. Influenza and RSV contribute significantly to morbidity in the population. Better linkage of viral isolate data and hospitalization records could provide a more robust epidemiological perspective allowing the possibility of predictive modelling.
ACKNOWLEDGEMENTS
This study was funded by operating grant no. MOP-57928 from the Canadian Institutes of Health Research. Dr Upshur is supported by a New Investigator Award from the Canadian Institutes of Health Research and a Research Scholar Award from the Department of Family and Community Medicine, University of Toronto. The authors extend sincere gratitude to Alan Leong and Shari Gruman for their expert assistance with the manuscript.
DECLARATION OF INTEREST
None.
REFERENCES
- 1.Nicholson KG. Impact of influenza and respiratory syncytial virus on mortality in England and Wales from January 1975 to December 1990. Epidemiology and Infection. 1996;116:51–63. doi: 10.1017/s0950268800058957. [DOI] [PMC free article] [PubMed] [Google Scholar]
- 2.Thompson WW et al. Influenza associated hospitalizations in the United States. Journal of the American Medical Association. 2004;292:1333–1340. doi: 10.1001/jama.292.11.1333. [DOI] [PubMed] [Google Scholar]
- 3.Fleming DM, Cross KW. Respiratory syncytial virus or influenza? Lancet. 1993;342:1507–1510. doi: 10.1016/s0140-6736(05)80082-0. [DOI] [PubMed] [Google Scholar]
- 4.Drinka PJ et al. Non-influenza respiratory viruses may overlap and obscure influenza activity. Journal of the American Geriatrics Society. 1999;47:1087–1093. doi: 10.1111/j.1532-5415.1999.tb05232.x. [DOI] [PMC free article] [PubMed] [Google Scholar]
- 5.Falsey AR et al. Respiratory syncytial virus infection in elderly and high-risk adults. New England Journal of Medicine. 2005;352:1749–1759. doi: 10.1056/NEJMoa043951. [DOI] [PubMed] [Google Scholar]
- 6.Thompson WW et al. Mortality associated with influenza and respiratory syncytial virus in the United States. Journal of the American Medical Association. 2003;289:179–186. doi: 10.1001/jama.289.2.179. [DOI] [PubMed] [Google Scholar]
- 7.Health Canada Flu Watch. http://www.phac-aspc.gc.ca/fluwatch/ http://www.phac-aspc.gc.ca/fluwatch/ ). Accessed March 2006.
- 8.Williams J, Young W., Goel V. Patterns of Healthcare in Ontario. The ICES Practice Atlas. 2nd. Ottawa: Canadian Medical Association; 1996. Appendix I: A summary of studies on the quality of health care administrative databases in Canada. [Google Scholar]
- 9.Rawson N, Malcolm E. Validity of the recording of cholecystectomy and hysterectomy in the Saskatchewan health care datafiles. Saskatoon: Pharmacoepidemiology Research Consortium; 1995. [Google Scholar]
- 10.Maddala GS. Introduction to Econometrics. New York: Macmillan Publishing Company; 1988. [Google Scholar]
- 11.Granger CWG. Investigating causal relations by econometric methods and cross-spectral methods. Econometrica. 1969;34:424–438. [Google Scholar]
- 12.Sims C. Money, income and causality. American Economic Review. 1972;62:540–552. [Google Scholar]