SUMMARY
A mixture modelling technique is applied to age-specific frequency distributions of quantitative results from serological surveys for measles, mumps and rubella using samples collected across the age range in England and Wales in 2000. In accordance with previous studies the analysis suggests that the antibody response to natural infection is stronger than that produced by vaccination, that vaccine-induced antibody levels wane with time and that levels of vaccine-induced antibody response vary for each virus infection being strongest for rubella and weakest for mumps. The current mumps epidemic in the United Kingdom is focused in cohorts born during 1982–1987 who were too old to have received routine MMR vaccination. In the cohort born in 1981–1985 the model estimates that 7·5% have no evidence of mumps specific IgG and 24·9% have the lowest level of detectable antibody. The similar proportions of mumps antibody in these categories among cohorts with opportunity for 1 or 2 doses of vaccine is a concern, as the degree to which these individuals are protected is unclear. Investigations into the efficacy of two doses of a mumps containing vaccine should be a priority during the current epidemic.
INTRODUCTION
Serological surveillance is a core component of the integrated surveillance system used to monitor the impact of the measles, mumps and rubella vaccination programme in England and Wales. Before vaccines became available, immunity to measles, mumps and rubella was obtained through acquisition of the wild-type virus. In 1968, a monovalent measles vaccine was introduced for infants in England and Wales, and it was followed in 1970 by rubella vaccine for schoolgirls and susceptible women. The combined measles-mumps-rubella (MMR) vaccine replaced these in 1988, with the aim of eliminating all three diseases. In 1994, a combined measles-rubella (MR) vaccine was offered to all schoolchildren aged 5–16 years in a national campaign lasting 6 weeks. Since 1996, a two-dose schedule of MMR vaccine has been routinely offered to all children aged 12 months and 4 years [1].
Serological surveillance was introduced in 1988 and provides information needed to make informed decisions on whether national policy should be adjusted [1]. Serum samples are regularly collected from appropriate age groups and screened for measles, mumps and rubella-specific IgG. These data provide an estimate of the proportion of the population (stratified by age group and gender) who have been exposed to the disease or who have been successfully vaccinated, and more importantly, estimates the proportion remaining susceptible. It can, therefore, be used to complement other sources of surveillance information for measles, mumps and rubella, including vaccine coverage data, clinical notifications and laboratory confirmations, to provide a more complete understanding of the epidemiology of these infections and guide national policy [1].
Enzyme-linked immunosorbent assay (ELISA) is commonly used to determine the presence of specific IgG in serum samples [1–3]. Data provided by ELISA is quantitative and continuous with a low signal (or reactivity) suggesting no evidence of specific IgG and a high(er) signal (or reactivity) suggesting specific IgG is present, in a concentration that is related to the size of the signal obtained. Samples containing no specific IgG will be reactive to an extent and generate small signals. It can, therefore, be difficult to interpret data qualitatively on the basis of such quantitative results to accurately discriminate between that proportion of the population who have been exposed to disease or vaccination and those who have not. Traditionally fixed cut-offs are used, and whilst these are appropriate in the clinical setting for individual patient management, they have significant limitations for interpreting the results of population prevalence studies. Additionally, previous studies have shown that the antibody response to natural infection is stronger than that produced by vaccination, that vaccine-induced antibody levels wane with time and that levels of vaccine-induced antibody response vary for each virus infection, being strongest for rubella and weakest for mumps [4–6]. This makes setting an appropriate fixed cut-off even more difficult, if not impossible. An alternative approach in population-based studies is to use mixture models to describe and interpret the age-stratified distribution of quantitative results [3, 7, 8]. This exploits the differences in the distribution of quantitative results in samples from previously infected, previously vaccinated and previously unexposed individuals as the basis for the analysis.
In this study we describe the seroepidemiology of measles, mumps and rubella in England and Wales using the latest quantitative serological data representing the complete age range from a convenience collection of serum samples obtained in 2000 that reflects the general population [2, 9]. For the first time, a mixture-modelling technique is applied to these data to try and provide a more comprehensive seroepidemiological understanding of these infections.
METHODS
Samples
A total of 3445 serum samples (collected in 2000) across the age range from persons aged 1–69 years were used. Of these, 1681 (49%) were from females and 1764 (51%) from males. All were anonymized residues of specimens submitted for microbiological or biochemical testing to eight laboratories in England and Wales that were then part of the Public Health Laboratory Service (PHLS) and contributing to the PHLS Serological Surveillance Programme (now the HPA Seroepidemiology Programme) [2].
Laboratory methods
All serological tests were performed at Preston Public Health Laboratory (now Lancashire Teaching Hospitals NHS Trust) using commercial ELISA assays according to the manufacturer's instructions. Behring Enzygnost (Dade Behring, Milton Keynes, UK) was used to detect measles and mumps-specific IgG, and Mercia Rubella-G (Microgen Bioproducts Ltd, Camberley, UK) was used to detect rubella-specific IgG. Measles and mumps results were expressed quantitatively as an antibody concentration (units/ml), derived from the optical density (OD) according to the manufacturers' instructions. Rubella-specific IgG results were expressed quantitatively as a test to negative control ratio (T/N), also based on the OD.
Data
Prior to analysis data were aggregated into a number of reactivity categories. This was achieved using the logarithm (base 10) of each quantitative result and subdividing the resulting dynamic range into a number of equal width bands, enabling the proportion of data falling into each to be identified.
Measles and mumps
Individual quantitative results were aggregated into seven age groups (1–4, 5–9, 10–14, 15–19, 20–24, 25–44 and ⩾45 years) by 36 reactivity categories (equal width bands based on the logarithm of the OD).
Rubella (females)
Individual quantitative results were similarly aggregated into seven age groups by 25 reactivity categories (equal width bands based on the logarithm of the T/N ratio).
Rubella (males)
Since a selective approach to rubella immunization was used in the United Kingdom between 1970 and 1988 targeting only females aged 11–13 years [1], additional age groupings for those aged 25–44 years were applied to data from males to investigate any susceptibility in this cohort. Individual quantitative results were therefore aggregated into 10 age groups (5-year age groups for those aged 1–44 years, and a single group for those aged ⩾45 years) by 25 reactivity categories (equal width bands based on the logarithm of the T/N ratio).
Mixture models
Serological data were modelled as previously described [3, 7, 8], fitting models with 3–6 components to the observed distributions of antibody concentration in each age group. For a given component (reactivity level) the distribution of results in the assay was assumed to be independent of age, and to follow a Normal distribution. Age-related changes in reactivity are reflected in the model by changes in the proportions attributed to each of the component distributions.
The models were applied to the data for each virus infection with age groupings as previously described. A maximum-likelihood technique was used to estimate the parameters. Two parameters (i.e. a mean and a standard deviation) are used to describe each of ‘n’ component distributions used in the model and subsequent ‘n – 1’ parameters are included to describe the proportions in each component distribution for each age group used. The deviance of each more complex nested model was compared to that of its immediate simpler predecessor enabling the simplest model with the number of component distributions that best described the data to be determined. Comparing the deviance to degrees of freedom used enables the overall fit of the final models used to their respective data to be assessed.
Model and deviance
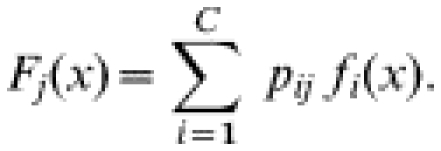
In a model with C components, let fi(x) denote the distribution for the ith component and let pij denote the proportion of samples from the ith component in age group j. Then the overall density of results at age j, Fj, is a mixture of the component densities,
 |
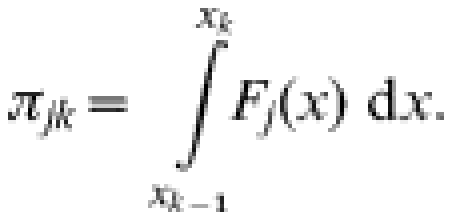
Let njk denote the number of results from persons in age group j falling in the kth reactivity category (k=1, …, K) and Nj denote the number of individuals of age j, so that Nj=∑knjk. Then (nj1, …, njK) is multinomial with index Nj and probabilities πjk where
 |
Maximum-likelihood estimates for the parameters were obtained by minimizing the deviance D
 |
Likelihood-based 95% confidence intervals for the age-specific prevalence of samples estimated in the lowest reactivity level by the models for each infection were obtained by finding the maximum and minimum values for which the deviance, minimized with respect to the other parameters, was within 3·84 of the minimum [8].
RESULTS
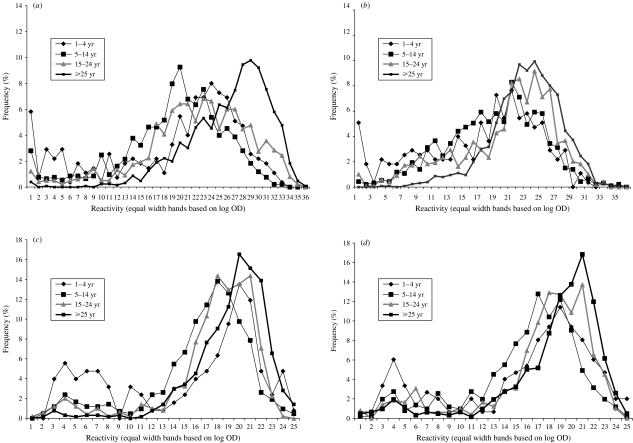
Frequency distributions of age-stratified quantitative serological data obtained for each virus are shown in Figure 1(a–d). These are different for each infection, with least differentiation between those samples with low reactivity and those with higher reactivity observed for mumps, and most for rubella.
Fig. 1.
Frequency distribution of serological data stratified by age group for (a) measles; (b) mumps; (c) rubella (females); (d) rubella (males).
The results of fitting mixture models with from three to six component distributions to each dataset are shown in Table 1. A χ2 distribution test comparing the deviance of nested models showed that mixture models using five component distributions to represent each level of reactivity best describe the frequency distributions of quantitative data for rubella (both males and females) and measles, and a mixture model using four component distributions best describes the mumps quantitative data. Characteristics of the final models used are summarized in Table 2. Component distribution ‘1’ represents those samples showing least reactivity. Each subsequent component represents an increased level of reactivity with component distribution ‘5’ (measles and rubella) and ‘4’ (mumps) representing those samples showing highest reactivity.
Table 1.
Characteristics of the various nested mixture models employed
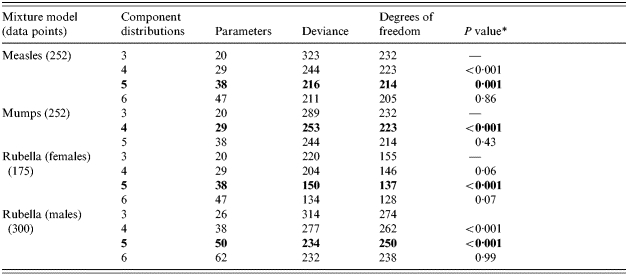
The rows in bold type represent the final models chosen.
χ2 distribution test comparing nested model deviance to that of the immediate predecessor.
Table 2.
The means and standard deviations (s.d.) of each of the Normal component distributions used in the final mixture models

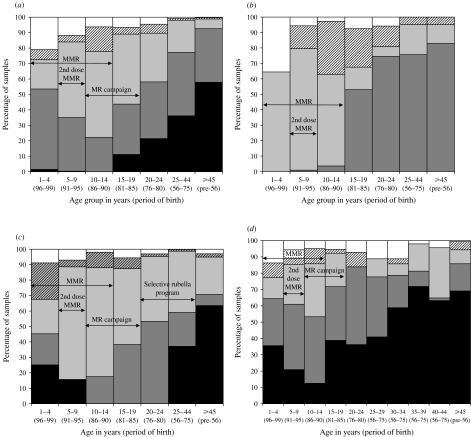
The proportions of samples attributed by these mixture models to each component distribution by age group for each infection are shown in Figure 2(a–d). For each infection the final mixture model used provided a good fit to the data, which is reflected by a comparison of the observed deviance to degrees of freedom used (Table 1).
Fig. 2.
Model estimates of antibody prevalence by age group, period of birth and opportunity for vaccination to (a) measles; (b) mumps; (c) rubella (females); (d) rubella (males). Key for all panels: □, reactivity level 1;
 , reactivity level 2;
 , reactivity level 3;
 , reactivity level 4; ■, reactivity level 5.
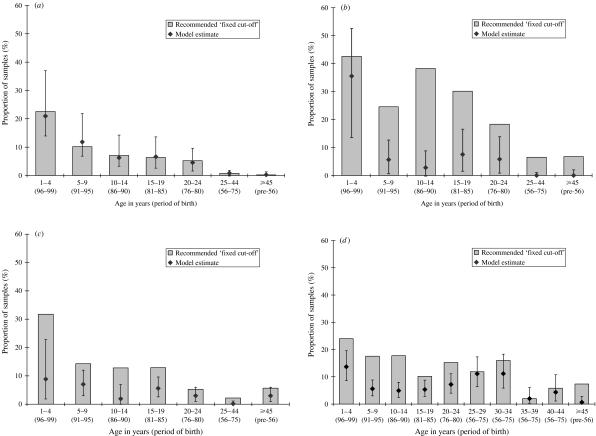
The age-stratified serological data for each infection are also shown categorized as antibody negative according to the fixed cut-offs as recommended by the ELISA kit manufacturer (Fig. 3 a–d), and compared with the estimated proportion in the component distribution in each model representing the lowest reactivity group (reactivity level 1). Whilst there is good agreement for measles, considerably higher proportions are classed as antibody negative for mumps and rubella by the fixed cut-offs.
Fig. 3.
(a) Proportion of samples negative for (a) measles antibody, (b) mumps antibody, (c) rubella (females) antibody, (d) rubella (males) antibody (manufacturer's fixed cut-off) and those estimated in reactivity group 1 by the model (95% CI).
DISCUSSION
This study illustrates the problem with categorizing and interpreting the results of population immunity surveys, particularly when results do not aggregate into clearly distinguishable distributions. This is especially apparent for mumps (and to a lesser degree for measles), where samples showing low reactivity cannot be obviously visually distinguished from those with higher levels of reactivity. However, even when data do aggregate into clearly discernible distributions, as is seen for rubella in this instance, the manufacturer's recommended fixed cut-off still may not be the most appropriate in epidemiological prevalence studies. This is because the recommended fixed cut-offs for such assays are usually selected to err on the side of specificity at the expense of sensitivity, since the assay will primarily be used in situations where the result may be used for individual patient management [3]. Such an approach will provide a high positive predictive value and is entirely appropriate in a diagnostic setting. The manufacturer's fixed cut-off is, therefore, likely to underestimate prevalence when applied to population data, and is a probable explanation for the relatively high proportion of samples classified as antibody negative when applying the fixed cut-off to these data, particularly for mumps and rubella. Therefore, deciding which samples show evidence of the marker of interest and which do not can become a complex issue from an epidemiological perspective and a mixture-modelling approach to interpreting the data is an option that needs to be considered [8].
When constructing a mixture model, deciding upon an appropriate number of component distributions that best reflects the different levels of reactivity produced by the assay used to screen the population may not be obvious. In this study it would be natural to choose three component distributions to represent the naturally infected, vaccinated and unexposed populations. However, we introduced additional components to enable the model to describe any possible decay in antibody titres of vaccinated individuals [8] identified by previous studies [4–6]. The number of component distributions (reactivity levels) in the final model was determined by a statistical approach that compared the deviance of a sequence of nested models of increasing complexity. This approach suggested five-component models for measles and rubella and a four-component model for mumps to be most appropriate. Since we assumed that the mean and standard deviation of each component distribution was independent of age, the only way that the mixture model could describe any antibody decay was to attribute several component distributions to the vaccinated population. Further methodology to explicitly model the decay in antibody titres in vaccinated populations is currently being explored.
The ability of mixture models to categorize serological survey data on a quantitative basis into an optimal number of distributions that best reflect the different levels of reactivity observed within the population screened represents a key advantage of this technique over more traditional approaches. Considering the proportions of samples attributed by the mixture model to each component distribution by age group (or period of birth) for each infection in relation to specific vaccination strategies used at various times within the population [1] also helps the interpretation of the different levels of modelled reactivity. If the population screened represents a mixture of exposed, vaccinated and susceptible individuals it seems reasonable to assume that the distribution (reactivity level) identified with the lowest mean quantitative result should represent those susceptible. Those not belonging to this distribution (i.e. reactivity levels ⩾2) show a higher level of reactivity and therefore represent samples containing some level of specific antibody. However, not all those with evidence of specific antibody will have acquired it in the same way, which may be manifest in the size of the signal produced by the assay. Those too old to have been offered vaccine are most likely to have experienced natural infection and mainly fall into those model categories reflecting the strongest antibody response. Antibody levels produced in response to vaccination may be lower than antibody levels in response to natural infection [4–6]. As expected, lower antibody levels are seen in cohorts with little exposure to natural infection, in whom antibody responses are largely vaccine induced.
The majority of those estimated by the models to fall into the lowest reactivity level (‘1’) for each infection are found in the youngest age group (1–4 years, born 1996–1999), an exception being an additional sizable proportion also found in this reactivity level for rubella for those males aged 20–34 years (born 1966–1980). These observations are consistent with reactivity level 1 representing that proportion of the population genuinely susceptible who have not been vaccinated and have not acquired natural infection. The higher proportion of older males estimated in this lowest reactivity level for rubella is consistent with previous serosurveys. Their ages indicate they were children whilst the selective rubella immunization programme (targeting girls only) was in place and so would not have been vaccinated. They are also unlikely to have subsequently been offered vaccine, being too old either to receive MMR vaccine when it was introduced in 1988 or to be included in the MR campaign of 1994. The continued higher susceptibility to rubella in this male cohort is also consistent with the last sizable rubella outbreak in the United Kingdom, which occurred in 1996 and mainly affected young adult males at universities and in the military [1].
The other reactivity levels (⩾2) are therefore likely to represent evidence of specific antibody to each infection in increasing amounts. Estimates belonging to the highest reactivity level for each are predominantly found in those older age groups, in proportions that increase with age, reflecting those most likely to have grown up when regular epidemics of measles, mumps and rubella occurred in the absence of any vaccination programme [1]. Additionally, for rubella (both males and females), a small proportion that decreases with age is estimated in the highest reactivity level (‘5’), but only in those younger age groups (born 1991–1995, aged 1–9 years in 2000) who have had opportunity for vaccination [1]. These trends suggest that strongest antibody responses to measles, mumps and rubella result mainly from natural infection, but may also be produced by recent vaccination against rubella.
The highest proportions of the other reactivity levels representing lesser amounts of specific antibody are mainly found in those age groups most likely to be vaccinated [1], with a tendency to shift from a higher to lower reactivity level with increasing age. This suggests that in comparison to antibody responses to natural infection, vaccine-induced antibody levels are lower and may wane with time, supporting previous findings [4–6].
Currently, in the United Kingdom, outbreaks of mumps are running at their highest level since the introduction of MMR vaccine in 1988 and are mainly affecting young adults attending tertiary-level educational institutions [10]. This was not unexpected, having been predicted by previous mathematical modelling work using earlier serological surveillance data [11, 12]. However, this study represents an opportunity to investigate in more detail antibody responses to mumps, particularly those that are likely to be vaccine induced. A key issue is the level of protection conferred by reactivity level 2, the modelled distribution considered to represent the lowest level of specific antibody. The highest incidence of confirmed cases is in those born during 1981–1985 (aged 15–19 years in 2000) who were too old to have received routine vaccination with MMR but may have received MMR vaccine through catch-up in the early years of the programme. The model estimates that 7·5% of these cohorts are in reactivity level 1, and a further 24·9% in level 2. This raises the issue of whether the low level of mumps- specific antibody identified with this level, which is most likely to be vaccine induced, is fully protective, particularly since mumps outbreaks in a highly vaccinated population have previously been reported [13]. The first cohort to have the opportunity for routine vaccination against mumps (as part of MMR) (born 1986–1990, aged 15–19 years in 2000) [10, 14, 15], have contrasting antibody levels, with very few estimated in the highest reactivity level (‘4’) that is indicative of natural infection. Whilst only a small proportion (2·8%) of this cohort is estimated as being susceptible (reactivity level 1), another 34·2% are estimated to have low antibody levels (reactivity level 2). A smaller proportion (14·8%) is estimated in reactivity level 2 in those born 1991–1995 (aged 5–9 years in 2000) who will have had the opportunity for a second dose of MMR vaccine, but it is likely that in this cohort this proportion will increase over time due to waning of vaccine-induced antibody levels [4–6]. Thus the degree of protection of those estimated with reactivity level 2 will be critical in determining the future epidemiology of mumps in the vaccination era [13]. A recent study estimated the effectiveness of the mumps component of the MMR vaccine to be only 69% (95% CI 41–84) [16]. Previous outbreak studies have suggested similar or higher values, but little data exist on the efficacy of two doses of vaccine. Investigations into the efficacy of receiving two doses of a mumps-containing vaccine should be a priority during the current mumps outbreaks.
The mixture models employed in this study are useful for investigating the different levels of antibody response to vaccination or natural infection within the population when considering each virus infection individually. However, they highlight that whilst there are general trends, there is evidence that the strength of the IgG response to each infection differs, particularly for vaccination. More mechanistic models are, therefore, needed to investigate and understand collectively the different levels of antibody response to each antigen. This is particularly important since a variety of different immunization strategies have been employed at various times against each infection in England and Wales [1], that the recommended vaccines often incorporate more than one antigen component (i.e. MMR and MR) [1] and that the long-term effect of receiving more than one dose of vaccine needs to be studied.
This study also suggests that it will be especially important to monitor those born during 1996–1999 where large proportions were estimated to have no evidence of specific antibody to measles, mumps or rubella using the data collected in 2000. However, these individuals will by now have had the opportunity of receiving a second dose of MMR vaccine. Finally, the most comprehensive assessment of the current epidemiology of measles, mumps and rubella in England and Wales will be best obtained by reviewing these serology data in conjunction with other sources of surveillance data available.
DECLARATION OF INTEREST
None.
REFERENCES
- 1.Vyse A et al. Evolution of surveillance of measles, mumps and rubella in England and Wales: providing the platform for evidence-based vaccination policy. Epidemiologic Reviews. 2002;24:125–136. doi: 10.1093/epirev/mxf002. [DOI] [PubMed] [Google Scholar]
- 2.Osborne K et al. Ten years of serological surveillance in England and Wales: methods, results, implications and action. International Journal of Epidemiology. 2000;29:362–368. doi: 10.1093/ije/29.2.362. [DOI] [PubMed] [Google Scholar]
- 3.Vyse A et al. Seroprevalence of antibody to varicella zoster virus in England and Wales in children and young adults. Epidemiology and Infection. 2004;132:1129–1134. doi: 10.1017/s0950268804003140. [DOI] [PMC free article] [PubMed] [Google Scholar]
- 4.Davidkin I, Valle M. Vaccine-induced measles antibodies after two doses of combined measles, mumps and rubella vaccine: a 12-year follow-up in two cohorts. Vaccine. 1998;16:2052–2057. doi: 10.1016/s0264-410x(98)00081-4. [DOI] [PubMed] [Google Scholar]
- 5.Mossong J et al. Modeling the impact of subclinical measles transmission in vaccinated populations with waning immunity. American Journal of Epidemiology. 1999;150:1238–1249. doi: 10.1093/oxfordjournals.aje.a009951. [DOI] [PubMed] [Google Scholar]
- 6.Paunio M et al. Secondary measles vaccine failures identified by measurement of IgG avidity: high occurrence among teenagers vaccinated at a young age. Epidemiology and Infection. 2000;124:263–271. doi: 10.1017/s0950268899003222. [DOI] [PMC free article] [PubMed] [Google Scholar]
- 7.Gay N. Analysis of serological surveys using mixture models: application to a survey of parvovirus B19. Statistics in Medicine. 1996;15:1567–1573. doi: 10.1002/(SICI)1097-0258(19960730)15:14<1567::AID-SIM289>3.0.CO;2-G. [DOI] [PubMed] [Google Scholar]
- 8.Gay N et al. Improving sensitivity of oral fluid testing in IgG prevalence studies: application of mixture models to a rubella antibody survey. Epidemiology and Infection. 2003;130:285–291. doi: 10.1017/s0950268802008051. [DOI] [PMC free article] [PubMed] [Google Scholar]
- 9.Kelly H et al. A random cluster survey and a convenience sample give comparable estimates of immunity to vaccine preventable diseases in children of school age in Victoria, Australia. Vaccine. 2002;20:3130–3136. doi: 10.1016/s0264-410x(02)00255-4. [DOI] [PubMed] [Google Scholar]
- 10.Savage E et al. Mumps outbreaks across England and Wales in 2004: observational study. British Medical Journal. 2005;330:1119–1120. doi: 10.1136/bmj.330.7500.1119. [DOI] [PMC free article] [PubMed] [Google Scholar]
- 11.Farrington C, Whitaker H. Estimation of effective reproduction numbers for infectious diseases using serological survey data. Biostatistics. 2003;4:621–632. doi: 10.1093/biostatistics/4.4.621. [DOI] [PubMed] [Google Scholar]
- 12.Gay N et al. Mumps surveillance in England and Wales supports introduction of two dose vaccination schedule. Communicable Disease Report. CDR Weekly. 1997;7:21–26. [PubMed] [Google Scholar]
- 13.Hersh B et al. Mumps outbreak in a highly vaccinated population. Journal of Pediatrics. 1991;119:187–193. doi: 10.1016/s0022-3476(05)80726-7. [DOI] [PubMed] [Google Scholar]
- 14.Gupta R, Best J, MacMahon E. Mumps and the UK epidemic 2005. British Medical Journal. 2005;330:1132–1135. doi: 10.1136/bmj.330.7500.1132. [DOI] [PMC free article] [PubMed] [Google Scholar]
- 15.Savage E, Ramsay M, Crowcroft N. Increases in mumps cases in England and Wales in 2004. Eurosurveillance Weekly. 2004;8:3–4. [Google Scholar]
- 16.Harling R et al. The effectiveness of the mumps component of the MMR vaccine: a case control study. Vaccine. 2005;23:4070–4074. doi: 10.1016/j.vaccine.2004.10.020. [DOI] [PubMed] [Google Scholar]


