

SUMMARY
Estimates of hepatitis C virus (HCV) clearance following acute infection range from 14 to 46%. This wide range is likely to be due to the characteristics of the populations studied and analysis methods. This paper examines how differing definitions of clearance parameters affect estimates of viral clearance in a cohort of 85 injecting drug users with newly acquired HCV infection. Kaplan–Meier estimates of time to HCV clearance were determined using varying definitions of eligible cohort, viral clearance, date of infection and date of clearance. Based on which combinations of definitions were used, the number of subjects eligible for analysis ranged from 27 to 75, clearance rate ranged from 14 to 68% and time to achieving 25% clearance ranged from approximately 5 months to 14 months. Standardized definitions and methodologies are required to enable valid comparisons of rates of clearance across newly acquired HCV infection natural history studies.
INTRODUCTION
The natural history of hepatitis C virus (HCV) infection is heterogeneous and incorporates a range of prognostic determinants. The first determinant of prognosis, whether a person with HCV clears infection or progresses to chronic infection, is poorly understood. Estimates of rates and predictors of HCV clearance are crucial for newly infected individuals, their clinicians, and to determine population estimates of disease burden.
Reviews of HCV natural history have reported clearance ranges of 14–46% and more recently of 0–57% [1, 2]. The reported estimate of time to clearance has ranged from 1 to 2 weeks up to 1–3 years [3–7]. Discrepancies in these estimates have been attributed to a number of factors. First, the asymptomatic nature of early infection means that detection of acute infection is uncommon [1]. Second, there are currently no diagnostic tests to differentiate between acute and chronic infection. Third, the majority of HCV infections occur in marginalized populations, such as injecting drug users (IDUs) who may be difficult to recruit into studies and maintain in follow-up [8, 9]. Last, the statistical methods and definitions used to determine clearance estimates vary between studies.
The impact of the first three factors on HCV clearance estimates is difficult to quantify. However, the extent to which differing methods affect clearance estimates is quantifiable. In HIV/AIDS seroconverter cohorts, the effects of differing definitions of estimated date of infection and other disease progression parameters have been shown to result in bias in Kaplan–Meier estimates of time to event (in HIV the event being AIDS or death) [10]. In this paper, we present analyses from an IDU seroconverter cohort, in which we examine the impact of differing definitions of HCV infection and clearance on estimated rates of clearance.
METHODS
Study population
Details of the methods and results from the Kirketon Road Centre (KRC) HCV seroconverters cohort have been published elsewhere [11]. In brief, KRC is a government-funded primary health-care facility in Kings Cross, Sydney which has been operating since 1987. A retrospective cohort study design was used to identify all IDUs from the KRC clinic database who had evidence of newly acquired HCV infection and had attended KRC from January 1992 to May 2002. Newly acquired HCV infection was defined on the basis of documented HCV antibody seroconversion (transition from HCV antibody negative to HCV antibody positive) within a 2-year interval. Those with a negative to indeterminate HCV antibody result were included where a subsequent positive HCV antibody was documented. Data about HCV RNA were not used for case selection, however, were needed for and used in analyses.
Statistical analysis
Non-parametric estimates of time from HCV infection to HCV RNA plasma clearance were determined by Kaplan–Meier methods. Estimates were calculated using combinations of definitions of the parameters: cohort for inclusion (defined by seroconversion window, baseline viraemia and follow-up data requirements), estimated date of infection, clearance and estimated date of clearance (Table 1, Fig. 1). The rationale for assessing aspects of these parameters, described in Table 1, is as follows. The definition of newly acquired infection has previously been based on detection of HCV RNA, in acute clinical and post-transfusion HCV studies, and on seroconversion window, in sero-incident studies [7, 12, 13]. The exact time of infection is often unknown and could range from the last negative HCV antibody date to the first positive HCV RNA. In some studies the mid-point of the seroconversion window has been used as the estimated date of infection [13]. Viral clearance could be defined on just a single negative HCV RNA, however due to fluctuations in levels of viraemia during HCV chronic infection, a more conservative definition of clearance is to require two consecutive negative HCV RNA results [7, 14]. The exact time of viral clearance cannot be known but can be estimated at the earliest as the last positive HCV RNA, at the latest as the first negative HCV RNA, or as the mid-point of these dates.
Table 1.
Matrix of definitions used for calculating HVC RNA clearance estimates

HCV RNA clearance will be defined either as:
A single negative HCV RNA result following estimated date of infection.
Two consecutive negative HCV RNA results following estimated date of infection (in this scenario the date of the first of two consecutive negative HCV RNA results will be used to determine the estimated date of clearance).
Fig. 1.

Example of how a subject's antibody and HCV RNA test results would be used to determine estimated date of infection and estimated date of clearance according to the matrix of definitions (Table 1). * Mid-point from clearance to estimated date of infection (rather than last positive HCV RNA) will be used in there is no positive HCV RNA result.
The impact of choice of parameter was assessed by combining them in a number of analysis strategies (Table 2). While it would be possible to combine parameters into a vast array of strategies, here we present strategies used in previous studies and those that would be applicable to data generally collected in IDU cohorts, and those that provide the widest range of estimates of clearance. Strategy A, which was used in the initial study of this cohort, will be used as the reference strategy. All other strategies are based on the definitions in strategy A but with changes to particular parameters while holding other parameters constant. Strategy A is defined as: a cohort with a seroconversion window of ⩽2 years; clearance defined as two consecutive negative HCV RNA results; estimated date of infection as the mid-point from last negative HCV antibody to first sign of infection (either HCV RNA or positive HCV antibody); estimated date of clearance as the mid-point from last positive HCV RNA (or estimated date of infection if no previous positive HCV RNA result) to first of two consecutive negative HCV RNA results. Strategy B restricted the cohort to those with baseline viraemia (HCV RNA positive within 1 year of the estimated date of infection). Strategy C examined the effect of narrowing the seroconversion window to a maximum of 1 year. In strategy C clearance was defined as a single negative HCV RNA. The estimated date of clearance was the date of the first negative HCV RNA in strategy D and the date of the last positive HCV RNA in strategy E Clearance was defined by a single negative HCV RNA result in strategy F. The estimated date of infection was the mid-point of the seroconversion window in strategy G. In strategy H the cohort was restricted to those viraemic at baseline and used the last positive HCV RNA date as the date of clearance.
Table 2.
Rates of clearance determined using different definitions of infection and clearance parameters
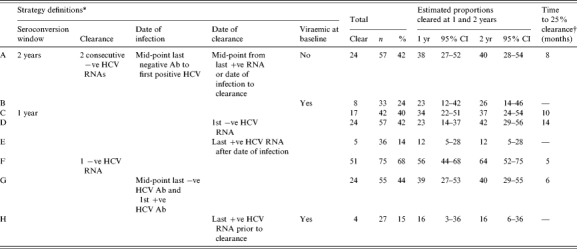
−ve, negative test result; Ab, antibody; CI, confidence interval; HCV, hepatitis C virus.
All strategies defined as per strategy A with listed variation, see Methods section for details.
Obtained by Kaplan–Meier analysis (see Fig. 2 for Kaplan–Meier plots).
In all strategies subjects who did not clear HCV RNA were censored at the date of the last HCV RNA test. For each strategy in which clearance was defined as two consecutive negative HCV RNA results, the cohort for analysis was restricted to subjects with at least two HCV RNA results following the estimated date of infection. Similarly for clearance defined by a single negative HCV RNA result, that result had to be after the estimated date of infection.
RESULTS
A total of 99 IDUs were identified with evidence of newly acquired infection from the KRC clinic database. The median time from last negative HCV antibody to first positive HCV antibody (seroconversion window) was 9·3 months (range 0·6–23·4 months). Eighty-five subjects had a HCV RNA result following their last negative HCV antibody. For these subjects there were a median of three (range 1–14) HCV RNA results following their last negative HCV antibody; with a median time between HCV RNA results of 6 months (IQR 3–13 months).
The Kaplan–Meier plots for time to HCV RNA clearance by strategy showed marked differences (Fig. 2). The most rapid and greatest viral clearance occurred when only one negative HCV RNA defined clearance (strategy F). The slowest and lowest viral clearance occurred when date of clearance was determined by date of last positive HCV RNA (strategy E), viraemia at baseline (strategy B) or a combination of these (strategy H). Time-to-clearance plots for strategies A, C, D, G were similar regardless of: (i) restricting the cohort to those with a seroconversion window of 1 year (strategy C), rather than 2 years; (ii) estimating the date of clearance as the first date of two consecutive negative HCV RNA results (strategy D), rather than the mid-point between this date and the last known/estimated positive date; (iii) basing the estimated date of infection solely on antibody results (strategy G), rather than also using positive HCV RNA data.
Fig. 2.

Kaplan–Meier plots of the effect of differing definitions (combined into strategies) on estimates of HCV RNA clearance.
The number of subjects in each analysis strategy varied from 27 to 75 (Table 2) depending on the combination of parameters used from the definition matrix (Table 1). Sample size was small when clearance was defined as having two consecutive negative HCV RNA results and subjects were required to be viraemic at baseline (strategy B, n=33) or clearance time was defined by the last positive HCV RNA prior to clearance (strategy E, n=36), and smallest when all three parameter definitions were used (strategy H, n=27). Sample size was greatest when clearance only required one negative HCV RNA result, and therefore only one HCV RNA test was required subsequent to the estimated date of infection (strategy F, n=75). Sample sizes for the other strategies (A, C, D, G) were similar, ranging from 42 to 57.
Viral clearance estimates were lowest for viraemia-related strategies B, E and H (14–24%) and highest for strategy F (68%) (Table 2). Clearance estimates at 1 year by strategy clustered into four groups: E and H (12 and 16% respectively); B and D (both 23%); A, C and G (34–39%); and F (56%). Clearance estimates at 2 years also clustered into four different groups: E and H (12 and 16% respectively); B (26%); A, C, D, G (37–42%); and F (65%). Clearance levels >25% were observed for five strategies (A, C, D, F, G). The time to reach a clearance of 25% ranged from 5 to 14 months.
DISCUSSION
HCV clearance estimates varied from 14 to 68% and time to 25% clearance varied from 5 to 14 months depending on the definitions used for determining date of infection and date of clearance. The clearance rate was considerably higher with clearance defined as a single negative HCV RNA result (68%) compared to two negative HCV RNA results (42%). Clearance estimates were lowest when the survival algorithm included a requirement for viraemia either at baseline, prior to clearance or both.
Narrowing the seroconversion window and differing definitions of estimated date of infection had little impact on clearance estimates. Differing estimates of seroconversion time have also been shown to have little impact on analysis of progression in HIV studies [15]. The definitions which most altered estimates were whether clearance was defined as two negative HCV RNA results (strategies A, C, D, E, G) vs. one negative HCV RNA result (strategy F) and whether the cohort was restricted to those who were viraemic at baseline (strategies B, and H). In choosing the strategy that best describes clearance we first chose the strategies from the above three groups which maximized sample size (strategies A and D, F, B). Of these strategies strategy F which requires only one negative HCV RNA was excluded as the clearance rate from this strategy is likely to be inflated. During chronic infection HCV RNA has been known to temporarily dip below detectable levels [14]. Moreover, this study used sera stored at −20°C. HCV RNA degradation is known to occur if samples are stored at temperatures above −70°C [16]. Strategy B which requires viraemia at baseline is excessively restrictive and would exclude subjects with rapid clearance. Strategy D which estimates date of clearance as the date of negative HCV RNA is overly conservative and contradicts the usual approach of time to event used for chronic diseases [17]. We, therefore, recommend that strategy A be used in determining clearance and that strategy B is also presented as a sensitivity analysis.
Clearance estimates in longitudinal studies have been reported in the range of 0–57% [1, 2]. These studies are heterogeneous in terms of their study populations and the majority are clinic-based acute hepatitis C case-series using descriptive methodologies. Findings from sero-incident cohort studies have been more consistent in their findings, reporting clearance rates of between 14 and 20% [7, 13, 18]. However, the accuracy of these results is subject to debate as sample sizes in these studies ranged from 5 to 34 with the number of subjects with viral clearance ranging from 1 to 6. None of the studies used a Kaplan–Meier methodology to estimate time to and proportion of viral clearance
The sample size of this study, while large in comparison to other studies, was insufficient to obtain precise estimates under some of our strategies. Strategies which required some evidence of viraemia, B, E and H, had the lowest sample sizes and the widest confidence intervals. However the clearance rate in theses viraemic groups (14–24%) is similar to the 14% reported in a Baltimore IUD viraemic sero-incident study that required baseline viraemia [7].
Due to the retrospective nature of our study the time-course of clearance may have been over-estimated. All sera tested were collected in a clinical context and thus the time period between samples varied considerably and the date of infection had to be estimated. These constraints may have lead to an overestimation of time to clearance. Viral clearance often occurs within 2–3 months after well documented acute HCV infection [12]. This is shorter than the 6-month median time between samples in this study. Shorter testing intervals would produce a tighter estimate of time to clearance and would probably reduce differences in estimates arising from differing definitions.
Standardizing definitions of clearance parameters is required to allow easier comparison between studies of acute hepatitis and viral clearance. Our analyses indicate that the analytical method employed could vary estimated clearance rates from 14% to 68%, a range as wide as the range of clearance estimates reported across studies [1, 2]. In view of recent studies on treatment of acute HCV, consensus on clearance estimates is also important [19]. The efficacy of treatment can only be judged in view of spontaneous clearance rates. The best estimates of spontaneous clearance will come from appropriate prospective studies.
DECLARATION OF INTEREST
None.
REFERENCES
- 1.Seeff LB. Natural history of chronic hepatitis C. Hepatology. 2002;36:S35. doi: 10.1053/jhep.2002.36806. [DOI] [PubMed] [Google Scholar]
- 2.Micallef JK, Kaldor JM, Dore GJ. 15th Annual Conference of the Australasian Society for HIV Medicine, 2003. Cairns, Australia: 2003. Estimation of progression to chronic hepatitis C: a systematic review of longitudinal studies. [Google Scholar]
- 3.Eyster ME, Sanders J, Goedert JJ. Viral clearance occurs very early during the natural resolution of hepatitis C virus infection in persons with haemophilia. Haemophilia. 2004;10:75–80. doi: 10.1046/j.1351-8216.2003.00836.x. [DOI] [PubMed] [Google Scholar]
- 4.Farci P et al. A long-term study of hepatitis C virus replication in non-A, non-B hepatitis. New England Journal of Medicine. 1991;325:98–104. doi: 10.1056/NEJM199107113250205. [DOI] [PubMed] [Google Scholar]
- 5.Alter MJ et al. Risk factors for acute non-A, non-B hepatitis in the United States and association with hepatitis C virus infection. Journal of the American Medical Association. 1990;264:2231–2235. [PubMed] [Google Scholar]
- 6.Larghi A et al. Outcome of an outbreak of acute hepatitis C among healthy volunteers participating in pharmacokinetics studies. Hepatology. 2002;36:993–1000. doi: 10.1053/jhep.2002.36129. [DOI] [PubMed] [Google Scholar]
- 7.Villano SA et al. Persistence of viremia and the importance of long-term follow-up after acute hepatitis C infection. Hepatology. 1999;29:908–914. doi: 10.1002/hep.510290311. [DOI] [PubMed] [Google Scholar]
- 8.Alter MJ et al. The prevalence of hepatitis C virus infection in the United States, 1988 through 1994. N Engl J Med. 1999;341:556–562. doi: 10.1056/NEJM199908193410802. [DOI] [PubMed] [Google Scholar]
- 9.Law MG et al. Modelling hepatitis C virus incidence, prevalence and long-term sequelae in Australia, 2001. International Journal of Epidemiology. 2003;32:717–724. doi: 10.1093/ije/dyg101. [DOI] [PubMed] [Google Scholar]
- 10.Porter K et al. The practical significance of potential biases in estimates of the AIDS incubation period distribution in the UK register of HIV seroconverters. AIDS. 1999;13:1943–1951. doi: 10.1097/00002030-199910010-00018. [DOI] [PubMed] [Google Scholar]
- 11.Jauncey MG et al. Viral clearance in newly acquired hepatitis C infection among a cohort of injecting drug users. Journal of Infectious Diseases. 2004;190:1270–1274. doi: 10.1086/423943. [DOI] [PubMed] [Google Scholar]
- 12.Hofer H et al. Spontaneous viral clearance in patients with acute hepatitis C can be predicted by repeated measurements of serum viral load. Hepatology. 2003;37:60–64. doi: 10.1053/jhep.2003.50019. [DOI] [PubMed] [Google Scholar]
- 13.Okayama A et al. Incident hepatitis C virus infection in a community-based population in Japan. Journal of Viral Hepatology. 2002;9:43–51. doi: 10.1046/j.1365-2893.2002.00331.x. [DOI] [PubMed] [Google Scholar]
- 14.Hashimoto M et al. Fluctuations of hepatitis C virus load are not related to amino acid substitutions in hypervariable region 1 and interferon sensitivity determining region. Journal of Medical Virology. 1999;58:247–255. doi: 10.1002/(sici)1096-9071(199907)58:3<247::aid-jmv10>3.0.co;2-3. [DOI] [PubMed] [Google Scholar]
- 15.Chiarotti F et al. Effects of different parametric estimates of seroconversion time on analysis of progression to AIDS among Italian HIV-positive haemophiliacs. Statistics in Medicine. 1992;11:591–601. doi: 10.1002/sim.4780110504. [DOI] [PubMed] [Google Scholar]
- 16.Schmid P et al. Analysis of the viability of freezer stored serum samples for hepatitis C virus RNA analysis by the SUPERQUANT method: results of a 16 year retrospective study. Journal of Virological Methods. 1999;82:201–206. doi: 10.1016/s0166-0934(99)00094-4. [DOI] [PubMed] [Google Scholar]
- 17.Fattovich G et al. Effect of hepatitis B and C virus infections on the natural history of compensated cirrhosis: a cohort study of 297 patients. American Journal of Gastroenterology. 2002;97:2886–2895. doi: 10.1111/j.1572-0241.2002.07057.x. [DOI] [PubMed] [Google Scholar]
- 18.Prati D et al. The incidence and risk factors of community-acquired hepatitis C in a cohort of Italian blood donors. Hepatology. 1997;25:702–704. doi: 10.1002/hep.510250335. [DOI] [PubMed] [Google Scholar]
- 19.Jaeckel E et al. Treatment of acute hepatitis C with interferon alfa-2b. New England Journal of Medicine. 2001;345:1452–1457. doi: 10.1056/NEJMoa011232. [DOI] [PubMed] [Google Scholar]