SUMMARY
Diagnosis and treatment of endemic infectious disease is crucial for productivity of cattle in rural sub-Saharan Africa, but shortages of trained veterinary professionals necessitate support for less well-trained cadres of animal health worker. A Delphi survey of veterinary experts provided quantitative information on key clinical signs associated with eight endemic bovine diseases, then heuristics and dendrogram analysis identified a reduced sign set to be incorporated in a diagnostic decision support tool implemented as a simple colour-banded card. One hundred and seventy disease-sign questionnaire returns were obtained from 32 veterinary research scientists and 14 veterinary practitioners. Preliminary validation of the decision support tool for 16 prototypical cases resulted in ‘correct’ diagnosis over 90% of the time. The card potentially serves as a training aid and aide-mémoire, and could improve the diagnostic competence of animal healthcare providers.
INTRODUCTION
Anaplasmosis, babesiosis, cowdriosis, fasciolosis, parasitic gastroenteritis, schistosomosis, theileriosis, and trypanosomosis are major endemic parasitic diseases affecting cattle health and productivity in the mixed crop–livestock production systems of sub-Saharan Africa [1–6]. Effective control of these diseases requires appropriate diagnosis and treatment of individual cases in the field. Many of the existing parasitological and molecular diagnostic tests for these diseases detect specific organisms or agents in animals that may or may not exhibit evidence of clinical disease. Moreover, these tests are often unavailable to groups such as farmers, extension workers and agro-veterinary traders who frequently make diagnosis and treatment decisions in Africa [7, 8] given the reduction in state funding for veterinary services and under-utilization of veterinary diagnostic laboratories by fee-paying farmers [9].
Diagnosis can be facilitated by the use of a combination of clinical examination, simple diagnostic tests and decision support tools. Decision support tools are applied to disease diagnosis where they may incorporate sets of rules for solving problems, details of clinical signs, laboratory results and opinions of experts [10]. In developing countries, especially in Africa, there exists a shortage of qualified veterinarians, and thus animal health auxiliaries are used in the recognition, treatment and control of animal disease [11]. It has been suggested that decision support tools may be particularly useful when employed by non-experts [12]. The development of practical diagnostic decision support tools requires access to comprehensive datasets [13, 14] or to expert opinion [15–18]. In this paper, we describe the entire process undertaken from the collection of initial quantitative information from veterinary experts to the development and preliminary validation of a decision support tool, implemented as a simple colour-banded card. Such field validation is vital before the card can be introduced as a useful diagnostic aid to a broader set of users.
MATERIALS AND METHODS
Delphi survey
A questionnaire, based on a review of the literature, was developed for the eight diseases under consideration and included a list of 34 clinical signs and risk factors reported to be associated with these conditions. The questionnaire was self-administered according to the Delphi method [19]. This method involves participants being required to answer a series of questionnaires, in this case transmitted by mail. Once the answers from all or a reasonable number of participants have been received, a summary of the collective results is sent back to each participant with a revised questionnaire. The participants then have the opportunity to modify their previous responses in light of the general opinion as represented by the summary data. The second or subsequent ‘rounds’ of Delphi exercises are often conducted through group workshops, unfortunately this was not possible due to project finance limitations and the fact that the experts were distributed across the globe.
A number of potential participants were identified based on their publication activity in the literature while others were selected from professional contacts. Expertise was defined as extensive diagnostic or research experience with one or more of the target diseases preferably gained in sub-Saharan Africa. A total of 128 experts, from Africa (111), Europe (9), Australia (5), and America (3) were identified and asked to participate in the Delphi survey, concentrating on the diseases of their specialization. These participants represented a balanced profile of 64 international scientists with research experience on the selected diseases and the same number of veterinary practitioners with extensive experience in clinical diagnosis and treatment of the selected diseases. Of the 128 participants 76, 75, 75, 81, 82, 81, 75 and 93 had expertise on anaplasmosis, babesiosis, cowdriosis, fasciolosis, parasitic gastroenteritis, schistosomosis, theileriosis and trypanosomosis, respectively.
An explanatory covering letter and copies of the relevant disease questionnaires were mailed to each expert. In the first round, veterinary research scientists were sent questionnaires on diseases of their specialization, while veterinary practitioners were sent questionnaires for all eight diseases. Participants were asked to select between five and 10 of the clinical signs or risk factors listed which they considered the most useful in the clinical diagnosis of each disease. They were then asked to score the relative usefulness of the selected clinical signs or risk factors using a scale of 1–5, where 5 indicated highest importance and 1 the lowest. Participants were encouraged to base their scores on experience rather than textbook knowledge.
In accordance with the Delphi approach, once the initial set of responses had been received these were compiled into a summary response sheet. A second-round questionnaire was then mailed to each respondent together with this summary information. Participants received a modified version of the form with clinical signs and risk factors, together with their individual and the consensus responses from the first round. In this version of the form the explanation of scoring criteria was rephrased to make it clearer and to avoid some confusion that had led a few participants to reverse their scores during the first round. Consensus results consisted of a list of clinical signs and risk factors chosen by all participants specializing on a given disease with the mean scores arranged in descending order. Individual results consisted of a list of clinical signs and risk factors chosen by each individual for the various diseases of his or her interest with scores arranged in the same manner.
After the completed questionnaires from the second round were received, the final mean scores for the chosen clinical signs and risk factors for each of the diseases were calculated. In cases where participants did not return the second-round questionnaires, their first-round responses were used. This is not unusual within Delphi studies where a natural reduction in completed responses is often observed [19] and is generally assumed to indicate no strong deviation on the part of non-respondents from the consensus view.
Incorporation of expert data into a decision support tool
The overall scores obtained for the clinical signs as they related to each of the targeted diseases were then incorporated into a decision support tool, which was designed based on a combination of the pattern-matching and colour-banding techniques [20, 21]. The process of creating the decision support card involved a number of heuristic steps based as much on judgement and prior experience as any prescribed or formal method [18]. First, the ‘diagnostic implication’ score associated with each disease had to be equitably scaled across all diseases for direct comparison. Second, the number of signs had to be reduced to a parsimonious number for incorporation on the card. This was done by excluding signs which accounted for <1% of the total diagnostic impact across all diseases. In addition a dendrogram was used to evaluate the level of clustering of signs in disease space to see whether certain sign sets could be identified. The statistical package statistica version 5.5 (StatSoft Inc., Tulsa, OK, USA) was used to create the dendrogram using Euclidean distance as the similarity measure and complete linkage as the amalgamation rule [22]. Finally, given this reduced set, the weights of all remaining signs had to be recalibrated for each disease and a banding decided upon which gave meaningful and balanced results.
Initial validation of the decision support card
An initial validation exercise was carried out using cases of known aetiological and clinical diagnosis, where the diagnosis made by experts and the card were compared. The realistic testing of such systems is a well-accepted problem, especially in the absence of any gold standard [23]. The initial test involved 15 pairs of experts who were asked to make a judgement on the diagnostic outcomes associated with 16 prototypical cases (for which an independent, putative diagnosis was already known). These cases were also evaluated using the decision support card and the performances compared. (See Magona et al. [24] for more detail on the case presentations for this initial validation.)
RESULTS
Delphi survey results
Forty-six of the 128 experts asked to participate in the study returned the first-round questionnaires. In total 170 disease-sign questionnaire returns were obtained from 32 veterinary research scientists and 14 veterinary practitioners. Of these 23, 20, 23, 22, 23, 12, 21 and 26 answered questions regarding anaplasmosis, babesiosis, cowdriosis, fasciolosis, parasitic gastroenteritis, schistosomosis, theileriosis and trypanosomosis, respectively. Twenty-seven of the 46 first-round respondents also returned second-round questionnaires. These included 15 research scientists and 12 practitioners, with a total of 119 questionnaire sheets in broadly similar proportions across the disease spectrum as was the case for the first round. The response rate during the first round was acceptable (36%) particularly given the wide geographical range of experts targeted. The response level in the second round was higher, particularly in the case of veterinary practitioners where 12 of a potential 14 experts replied, while the level of response from research scientists was around 50%. The interval between the first and second-round questionnaires was ∼6 months.
After the two rounds of the Delphi survey, the responses from the 27 full participants as well as the 19 who only responded to the first round were used to develop a decision support card. These responses consisted of scores for clinical signs relating to each of the diseases summarized across all experts who provided scoring data. The clinical signs with the ten highest scores for each target disease, arranged in descending order of importance based on the responses given by the experts, are shown in Table 1.
Table 1.
Clinical signs with the 10 highest scores for each disease as indicated by the combined assessment of the 46 veterinary experts who took part in the Delphi survey
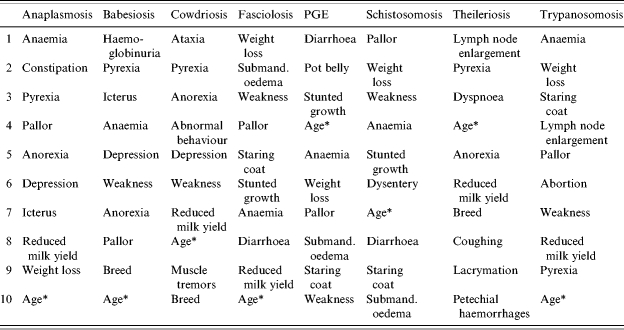
PGE, Parasitic gastroenteritis.
Strictly ‘Age’ is a risk factor rather than a clinical sign.
Because the raw scores were based on different numbers of experts in each disease category and experts were allowed to allocate any value from 1 to 5 for up to 10 signs the total scores given varied substantially. Their combined value had thus to be scaled to ensure equal representation for all diseases and this normalization was carried out by ensuring that the sum for all clinical signs in each disease category was 30 (equivalent to an average ‘diagnostic implication’ score of 3 over 10 signs). After normalization, clinical signs were then sorted in descending order based on their total ‘importance’ value across all disease categories to aid in the identification of the most useful clinical signs or risk factors to be included in the final decision support card (Table 2). The shaded cells within this table represent the most important signs for each disease. The basic rule of thumb was to select those cells with an individual ‘diagnostic implication’ score of >1·0. In cases where the total score for a disease based on these selected cells did not exceed 25, a slightly lowered threshold for inclusion was adopted. Obviously a key goal of the sign selection process was to ensure as many of these remained within the final decision support card as possible.
Table 2.
Scores for clinical signs and risk factors standardized and sorted in descending order of total diagnostic value
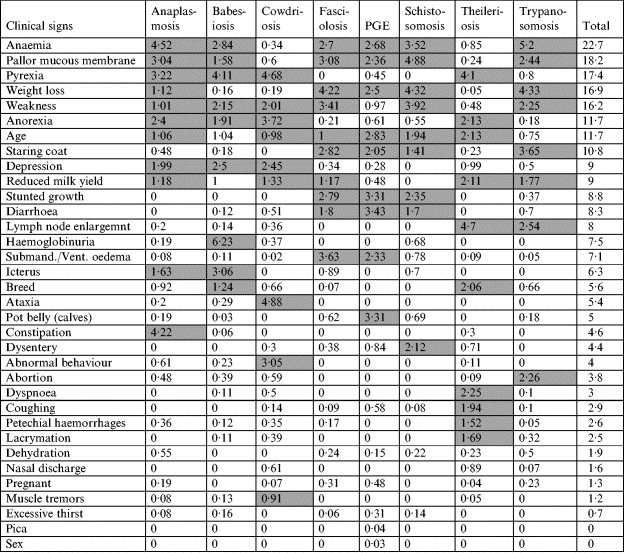
PGE, Parasitic gastroenteritis.
Shaded boxes indicate the most important clinical signs for diagnosis of individual diseases.
Selection of clinical signs according to their diagnostic value
There were a number of signs which although useful would be of limited value as they applied only to a (sometimes small) proportion of animals. Thus ‘reduced milk yield’ was removed from the sign list as it only applies to lactating cows, and ‘abortion’ was removed using a similar argument. While ‘breed’ was noted as important it was felt that almost all cattle in the study area would be zebu and so this sign was removed. Finally as all signs were of a ‘binary’ nature (present or absent) it was not possible to use the sign denoted as ‘age’ which had been reported as based on continuous values. There were a number of signs which had a combined diagnostic value of <2·4 (i.e. 1% of the total ‘importance’ score). Two signs, lacrymation and petechial haemorrhages, which scored just above this threshold value but were of high significance for only one disease, theileriosis, were also removed.
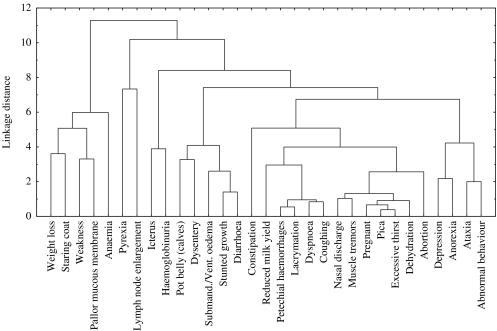
To further aid the selection and rationalization of key clinical signs a dendrogram representing how signs were clustered in ‘disease space’ (Fig. 1) was created. This dendrogram illustrated the relative differential diagnostic impact of each clinical sign as it related to the others available for diagnosis of the target diseases. The dendrogram was critically assessed by experienced veterinary clinicians to identify potential sets of signs which could be grouped together for the purpose of diagnostic use. Sign sets included signs suggestive of a common pathophysiological basis, or affecting related body systems. Such sign sets were exclusively ‘sign-pairs’ and were: ataxia or abnormal behaviour (abnormal central nervous system function), anaemia or pallor of mucous membranes (anaemic), anorexia or depression (depressed behaviour), dyspnoea or coughing (respiratory abnormality), and stunted growth or pot belly (poor nutrition in calf-hood). These combinations together with the removal of signs based on low diagnostic potential or limited applicability led to a reduction in the number of clinical signs from 34 to 16 signs (or sign-pairs), which was manageable in the context of the proposed decision support card.
Fig. 1.
A dendrogram showing the full set of clinical signs as they are hierarchically clustered in ‘disease space’ based on Euclidean distances and using complete linkage.
Prototype decision support card
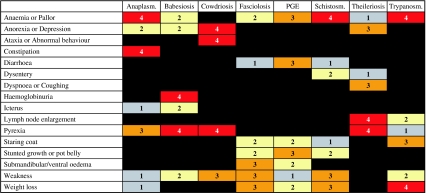
The final set of values used to build the decision support card was obtained by normalizing the importance scores for all remaining clinical signs or sign-pairs within each disease as shown in Table 3. The data were transformed into the format of a prototype decision support card (Fig. 2) using the following scoring and colour-coded bandings: 0–4 (with associated colours), in which 0, 1, 2, 3 and 4 were set according to the following scoring thresholds: 0% (black); >0% (grey); >9% (yellow); >14% (orange) and >21% (red).
Table 3.
Final set of scores for clinical signs and sign-pairs included in the decision support card
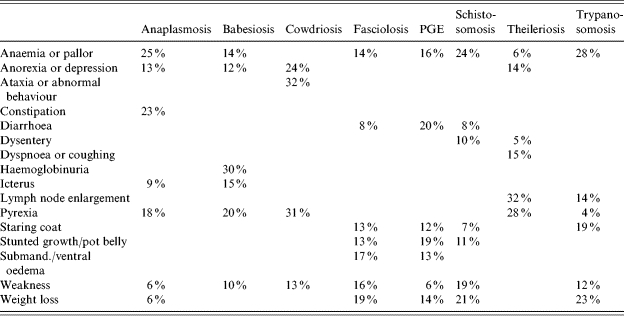
PGE, Parasitic gastroenteritis.
Column totals may not appear to sum to 100% due to rounding.
Fig. 2.
A prototype decision support card for differential diagnosis of endemic bovine diseases in sub-Saharan Africa. [Boxes in red (score of 4) indicate a high level of diagnostic implication between the given sign and disease. This decreases to the solid black boxes (score of 0) indicating no increased diagnostic likelihood of a disease given that sign.]
As can be seen in Figure 2, the prototype decision support card is composed of a grid along the top of which are listed the diseases included for diagnosis. The clinical signs potentially associated with these diseases are listed in the left-hand column. The colour band and score reflect the weight of a sign in the event that a disease is present. The basis of this card is the comparison of clinical signs observed against various disease profiles. A list of differential diagnoses may be constructed ranked in the order of which disease profiles best match the clinical signs observed. Scores associated with each sign observed are added up for each disease, with totals indicating the relative ranking of the possible outcomes. The disease with the highest total is considered the leading differential diagnosis. A tie for the top rank may be considered to signify a case of concurrent disease or may simply indicate the need to elicit further diagnostic information relating to the case.
The use of the card is perhaps best illustrated by looking at a simple case. Consider an animal presented with the following signs: pallor of mucous membranes, enlarged lymph nodes, staring coat, and weakness. Looking down the second column of the card these signs would give a total score of 5 (4+0+0+1) for anaplasmosis. In a similar manner the scores for the successive six diseases would be [4, 3, 7, 6, 8, 5] and finally trypanosomosis with a score of 11 (4+2+3+2). As trypanosomosis is clearly the highest scoring disease for this sign combination we would suggest that it is the most likely diagnosis.
Evaluation of the decision support card
An evaluation of the card using the 16 prototypical cases resulted in the card supporting the ‘correct’ diagnosis just over 90% of the time, compared to the experts who were in general agreement on this diagnosis in just over 75% of the cases. It was, however, expected that the card would perform well for such prototypical cases and a more realistic set of field cases with mixed infection and limited diagnostic signs together with actual clinical diagnoses will be required to evaluate the card more rigorously.
DISCUSSION
The Delphi method was employed to explore the available wealth of veterinary expertise on the clinical diagnosis of eight endemic bovine diseases. Its objective was to elicit quantitative measures of the most important clinical signs and risk factors for these diseases to enable a decision support tool to be designed. Responses were elicited from 46 experts covering anaplasmosis, babesiosis, cowdriosis, fasciolosis, parasitic gastroenteritis, schistosomosis, theileriosis and trypanosomosis. The expert response rates were considered to be reasonably good and more than sufficient to warrant further exploration, given that even minimal expertise can have a significant impact on the accuracy of forecasts [25]. The fact that 19 of these responses were based on the first round of feedback is not of undue concern as there is known to be a natural ‘attrition’ in successive rounds of any Delphi process [19] particularly among participants who feel that their previous responses appear to be broadly in line with consensus thinking.
Using the quantitative information on clinical signs and risk factors gathered from the Delphi survey, a decision support card was developed. It was intended that this decision support card be used by people involved in field diagnosis of endemic bovine diseases in rural areas of Africa. Unlike CaDDiS, an expert system that utilizes Bayesian probabilistic reasoning to tackle concurrent occurrence of disease signs in the same animal [17], the decision support card is a low technology decision support tool that utilizes pattern-matching and a scoring system to aid differential diagnosis. It was designed to conform to conditions in much of rural Africa where there is limited access to electricity and where ease of mobility is critical.
The use of low-technology, manually operated devices to aid medical diagnosis is by no means novel. In the early 1950s a mechanical device resembling a slide rule was devised to perform manipulations using groups of prefabricated datasets to solve classificatory tasks in medicine [26]. A variety of feature and edge-punched cards were later devised which provided similar functions to this slide-rule approach and were used to aid differential diagnosis using a combination of signs and symptoms [10]. Another non-computer-type of decision support involves the use of decision trees or cards where the diagnostic algorithm is represented in the form of a tree with branches at decision nodes identified with a series of clinical observations. Such a system has been devised for the domain of tropical human medicine [27]. In addition to the implementation of ranking or branching algorithms colour-coded cards have also been used as diagnostic aids.
The system described here uses both a scoring algorithm to assess relative likelihood of a disease and colour coding to aid rapid identification of key disease-sign linkages (and increase awareness and diagnostic skill levels in the users of the cards). In terms of computer-independent decision support tools applied to veterinary medicine a similar approach is that of Cockcroft [12, 20] who also adopted a pattern-matching approach. One of the features of Cockcroft's approach which was not felt to be useful was the use of logical exclusion, i.e. where a disease was excluded if a sign existed which had never been associated with the disease. This was seen as making the differential diagnosis too ‘brittle’ and also excludes the possibility of adequately dealing with situations of mixed infection. Cockcroft's recognition that any decision support system should be simple and credible to the eventual end users is important. However, it is also true of the approach adopted here that, ‘the pattern matching model does not generate a probability of a disease explaining the observations but identifies the disease with the best profile relative to the clinical observations’ [12].
If more than one disease obtains a similarly high score within the system outlined here then this may signify a case of concurrent disease. Consider for example the case of an animal which has the following presenting signs: pallor of mucous membranes, anorexia, icterus, and pyrexia. This combination leads to a score of 10 for both anaplasmosis and babesiosis, and of 8 for cowdriosis and theileriosis (the other four diseases scoring ⩽5). These results would suggest that it is not possible to make a clear differential diagnosis based simply on the given signs but the card does suggest which of the diseases is most likely and this may aid the search for further evidence to confirm or exclude specific likely diagnoses. It may also be that a future card, or supplements to it, may find a way to incorporate ‘discarded’ signs which while of low overall diagnostic value are useful in precisely these types of situation.
The decision support tool has a number of potential advantages in the diagnosis of endemic bovine diseases in mixed crop–livestock farming systems in East Africa. In the management of these cases, diagnosis and treatment are frequently conducted by individuals with little or no clinical training [8]; clinical examination is often cursory or omitted. Use of the tool on bovine cases promotes thorough clinical examination in order to establish the presence or absence of individual clinical signs, and hence dissemination of the card would be likely to increase the rate of examination of bovine cases. Moreover, indicating the relative importance of clinical signs for each disease on the card by colour coding as well as numbering strengthens the visual impact of associations between individual signs and diseases. Hence the card potentially also serves as a training aid and aide-mémoire, and could improve the diagnostic competence of animal healthcare providers at various levels of education. Finally, once validated for use on bovine clinical cases in the field, the card would be expected to improve the probability of the correct diagnosis being made. Hence the decision support tool described here could improve the rate of correct diagnosis of endemic bovine diseases in the target production system, not only by directly supporting diagnosis of individual clinical cases, but also indirectly by improving the overall competence of animal healthcare providers.
To ensure durability and inexpensive production of the decision support card, it will preferably be made of a lightweight plastic or laminated cardboard, which would make it possible to re-use by writing on it with a wipe-clean marker or pencil. The implementation of the decision support card described here is an example of a variety of possible low-technology implementations that could be envisaged using the underlying knowledge base. This particular implementation has the advantages that it is simple and inexpensive to produce and disseminate to end users. It may be distributed as a small (∼50 kb) pdf file over the Internet, and requires only a PC and colour printer to instantiate numerous copies. The limitations of the initial evaluation were outlined above and a full field-based validation of the decision support card by a group of veterinarians is currently underway in eastern Uganda. This two-phase, 6-month study involves three veterinarians with varying levels of training and experience in each of five districts. It is hoped that this will allow an assessment to be made of the card's suitability to a range of user types and geographical locations. After assessing the card's diagnostic performance (if adequate) it should be possible to release it for more general and routine use in Uganda and also move on to validate it for other settings within sub-Saharan Africa.
ACKNOWLEDGEMENTS
We thank scientists and field veterinarians that participated in the Delphi survey. We are grateful to the Department for International Development (DFID) that provided financial support for this work. This work was conducted through collaboration between University of Glasgow Veterinary School and the University of Strathclyde, UK and the Livestock Health Research Institute, Uganda.
DECLARATION OF INTEREST
None.
REFERENCES
- 1.Urquhart GM Veterinary Parasitology. Oxford: Blackwell Sciences Ltd; 1996. p. 320. , p. [Google Scholar]
- 2.de Castro JJ. Sustainable tick and tick-borne disease control in livestock improvement in developing countries. Veterinary Parasitology. 1997;71:77–97. doi: 10.1016/s0304-4017(97)00033-2. [DOI] [PubMed] [Google Scholar]
- 3.de Bont J, Vercruysse J. Schistosomiasis in cattle. Advances in Parasitology. 1998;41:285–364. doi: 10.1016/s0065-308x(08)60426-1. [DOI] [PubMed] [Google Scholar]
- 4.Pandey GS, Ahmadu B. Prevalence, seasonal variation and economic importance of bovine fascioliasis in Western Province of Zambia. Zimbabwe Veterinary Journal. 1998;29:63–69. [Google Scholar]
- 5.Kristjanson PM et al. Measuring the cost of African animal trypanosomosis, the potential benefits of control and returns to research. Agricultural Systems. 1999;59:79–98. [Google Scholar]
- 6.Ganaba R, Bengaly Z, Ouattara L. Calf morbidity, mortality and parasite prevalences in the cotton zone of Burkina Faso. Preventive Veterinary Medicine. 2002;55:209–216. doi: 10.1016/s0167-5877(01)00287-2. [DOI] [PubMed] [Google Scholar]
- 7.Bossche van den, Doran M, Connor RJ. Analysis of trypanocidal drug use in the Eastern Province of Zambia. Acta Tropica. 2000;75:247–258. doi: 10.1016/s0001-706x(00)00059-0. [DOI] [PubMed] [Google Scholar]
- 8.Machila N et al. Cattle owners' perception of African bovine trypanosomiasis and its control in Busia and Kwale Districts of Kenya. Acta Tropica. 2003;86:25–34. doi: 10.1016/s0001-706x(02)00288-7. [DOI] [PubMed] [Google Scholar]
- 9.Kenyon SJ, Nour A, Majok AA, Schwabe CW. Development among Africa's Migratory Pastoralists. Westport, CT and London: Bergin and Garvey; 1996. Animal disease diagnosis laboratories. [Google Scholar]
- 10.Thrusfield M. Veterinary Epidemiology. 2nd edn. Oxford: Blackwell Sciences Ltd; 1995. p. 498. , p. [Google Scholar]
- 11.FAO Animal Health Yearbook. Rome: 1992. Food and Agriculture Organisation: [Google Scholar]
- 12.Cockcroft PD. An intermediate-technology pattern-matching model of veterinary diagnosis. Tropical Animal Health and Production. 1999;31:127–134. doi: 10.1023/a:1005144628361. [DOI] [PubMed] [Google Scholar]
- 13.Blood DC, Brightling P, Larcombe MT. Diseases of Cattle: a manual for diagnosis. London: Bailliere Tindall; 1990. p. 396. , p. [Google Scholar]
- 14.Knox KMG et al. Objective interpretation of bovine clinical biochemistry data: application of Bayes law to a database model. Preventive Veterinary Medicine. 1998;33:147–158. doi: 10.1016/s0167-5877(97)00040-8. [DOI] [PubMed] [Google Scholar]
- 15.Dewey CE et al. A Delphi exercise used to identify potential causes of variation in litter size of Ontario swine. Canadian Veterinary Journal. 1992;33:40–45. [PMC free article] [PubMed] [Google Scholar]
- 16.Revie CW et al. EqWise and the development of diagnostic aids in equine coughing. International Journal of Applied Expert Systems. 1994;2:175–190. [Google Scholar]
- 17.McKendrick IJ et al. Using a Bayesian belief network to aid differential diagnosis of tropical bovine diseases. Preventive Veterinary Medicine. 2000;47:141–156. doi: 10.1016/s0167-5877(00)00172-0. [DOI] [PubMed] [Google Scholar]
- 18.Seidel M et al. Comparing diagnoses from expert systems and human experts. Agricultural Systems. 2003;76:527–538. [Google Scholar]
- 19.Linstone HA, Turoff M, Linstone HA, Turoff M. The Delphi Method: technique and applications. Reading, Massachusetts: Addison-Wesley; 1975. General application; pp. 73–226. , pp. [Google Scholar]
- 20.Cockcroft PD. Pattern-matching models for the differential diagnosis of bovine spongiform encephalopathy. Veterinary Record. 1999;22:607–610. doi: 10.1136/vr.144.22.607. [DOI] [PubMed] [Google Scholar]
- 21.Middleton K. Low cost, low technology approaches to the delivery of decision support systems [M.Sc. dissertationGlasgow, UK: University of Strathclyde, 2001127. pp. [Google Scholar]
- 22.StatSoft The Electronic Statistics Textbook . StatSoft Inc., Tulsa, OK, USA: 2004http://www.statsoft.com/textbook/stcluan.html). Accessed 10 June 2005. [Google Scholar]
- 23.Berner ES, Jackson JR, Algina J. Relationships among performance scores of four diagnostic decision support systems. Journal of the American Medical Informatics Association. 1996;3:208–215. doi: 10.1136/jamia.1996.96310634. [DOI] [PMC free article] [PubMed] [Google Scholar]
- 24.Magona JWet al. Diagnosis of endemic diseases in village cattle herds in southeast Uganda: a low technology decision support system. ICPTV Newsletter, Issue 8, 2003 (http://www.icptv.org/Newsletters/Newsletter8/Page43–46.pdf). Accessed 10 June 2005.
- 25.Kirigia JM. Economic evaluation in schistosomiasis: using the Delphi technique to assess effectiveness. Acta Tropica. 1997;64:175–190. doi: 10.1016/s0001-706x(96)00630-4. [DOI] [PubMed] [Google Scholar]
- 26.Nash FA. Differential diagnosis: an apparatus to assist the logical faculties. Lancet. 1954;266:874–875. doi: 10.1016/s0140-6736(54)91437-3. [DOI] [PubMed] [Google Scholar]
- 27.Essex BJ. Diagnostic Pathways in Clinical Medicine. London: Churchill Livingstone; 1977. p. 173. , p. [Google Scholar]


