SUMMARY
Official statistics routinely underestimate mortality from specific microorganisms and deaths are assigned to non-specific syndromes. Here we estimate mortality attributed to specific pathogens by modelling non-specific infant deaths from laboratory reports and codes on death certificates for these pathogens, 1993–2000 in England and Wales using a generalized linear model. In total, 22·4–59·8% of non-specific deaths in infants (25–66 deaths a year) are attributable to specific pathogens. Yearly deaths from Bordetella pertussis in neonates are 6·8 [95% confidence interval (CI) 1·5–11·9]. In post-neonates 9·4 (95% CI 2·3–16·6) deaths a year are attributable to Neisseria meningitidis, 7·3 (95% CI 2·4–12·3) to Streptococcus pneumoniae, from 2·8 (95% CI 0·8–4·9) to 15·1 (95% CI 9·4–20·9) to respiratory syncytial virus (RSV) and 3 (95% CI 0·3–5·9) to parainfluenza type 2. Our results suggest there is substantial hidden mortality for a number of pathogens in infants. A considerable proportion of deaths classified to infectious syndromes are non-infectious, suggesting low specificity of death certification. Laboratory reports were the more reliable source, reinforcing the asset of strong surveillance systems.
INTRODUCTION
Decisions to introduce or modify vaccination programmes are to a large degree based on the estimates of the morbidity and mortality burden from a disease [1, 2]. In many cases mortality statistics are used for that purpose. Modelling has shown that mortality rate and degree of underreporting of specific pathogens are critical parameters in estimating potential benefit of different vaccine schedules [1]. At the same time the burden of many pathogenic microorganisms is routinely underestimated [3–6] and this occurs because laboratory investigations for specific organisms are not carried out or because the tests have sensitivity and specificity of <100%. Mueller-Pebody et al. [5] found for instance that 74·8% of unspecified bronchiolitis hospital admissions were probably caused by respiratory syncytial virus (RSV). Pertussis is underdiagnosed because culture is insensitive, but the diagnosis may not appear on the death certificate even for children from whom cultures are positive [4, 6]. Typically the cause of such disease episodes or deaths is ascribed to a clinical syndrome such as pneumonia, bronchiolitis, meningitis and septicaemia, forming categories of infectious disease mortality for which the precise causative agents are unknown. More accurate estimates of the unrecognized burden of specific infectious diseases contained in this composite group are necessary. Thus, we aimed to estimate the burden of mortality from non-specific infectious disease or infection-like syndromes which is attributable to one or more of a number of specific pathogens.
METHODS
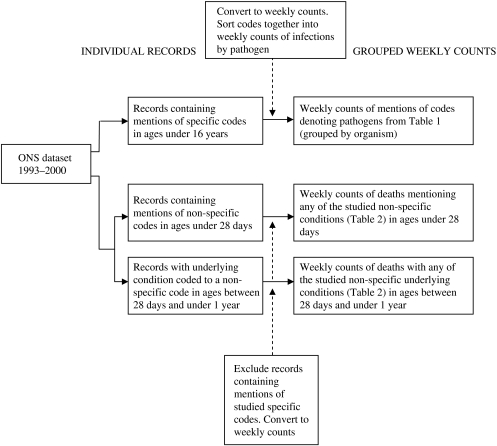
We extracted weekly counts of deaths, containing two categories of codes according to the 9th revision of the International Classification of Diseases (ICD-9) from the Office of National Statistics (ONS) dataset for England and Wales for a period from 1 January 1993 to 31 December 2000 (see Fig. 1). The first category consists of codes of conditions caused by 13 infectious microorganisms of interest in individuals aged <16 years (Table 1). We retrieved from the dataset and used in the study records mentioning any of these codes. The second category of codes represents illnesses of infectious aetiology, with no causative agent specified. These are conditions of the respiratory or central nervous systems, systemic or generalized infections, infections of unspecified site or some more general syndromes, suggesting an infectious cause. Deaths in this group were in individuals up to 1 year of age and were termed ‘non-specific deaths’. We retrieved and included in the study records of deaths of infants in the post-neonatal period (age 28 days to 1 year old) where the final underlying cause of death on the medical certificate of cause of death (MCCD) was any of the listed conditions (Table 2). For neonatal deaths (at age <28 days) we included deaths with mention of the codes anywhere on the MCCD because the ONS does not report a final underlying cause of death for that age group. In the age group between 28 days and 1 year, 20 records contained a non-specific code as the underlying cause and also mentioned specific codes. We only included these in the specific codes group. For ages <28 days we found 38 records mentioning both the listed specific and non-specific codes and we included these only in the specific group of codes for the analysis. To avoid duplication, we included records of neonatal deaths with mentions of more than one non-specific code only once (73 records).
Fig. 1.
Data transformation procedures for the Office of National Statistics (ONS) model dataset.
Table 1.
Conditions caused by the organisms studied and their corresponding ICD-9 codes
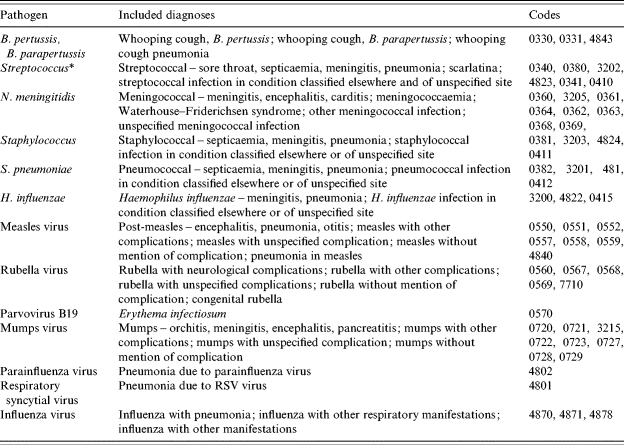
Except Streptococcus pneumoniae.
Table 2.
Non-specific infectious syndromes included in the study
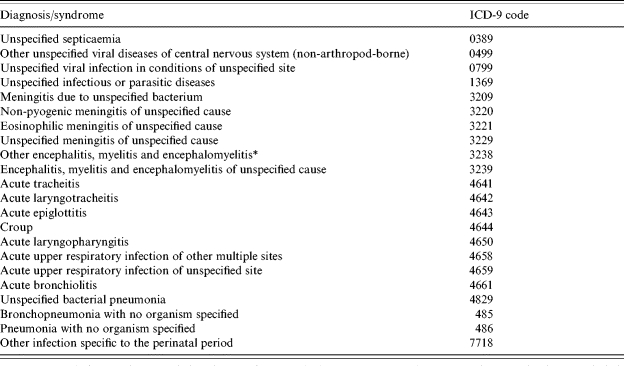
Different code from ‘other encephalitis due to infection’ which contains specific diagnoses and is accordingly not included.
We obtained weekly laboratory reports of the organisms of interest for ages <16 years from the Health Protection Agency Communicable Disease Surveillance Centre (CDSC) database for the period between 1993 and 2000. For rubella laboratory reports were used until 1997 inclusive, after which saliva-confirmed reports were used. Week 53 was not included in the analysis.
We used weekly counts of occurrences of specific codes in the ONS database and weekly counts of laboratory reports for the explanatory variables in the two parts of the analysis. The outcome variable was weekly counts of deaths containing non-specific codes.
Statistical model
The number of non-specific deaths in a week (for 416 weeks in the period) was modelled first, by the number of laboratory reports for specific organisms reported in the same week, and second, by the number of mentions of specific codes on death certificates in the same week. We assumed that the number of laboratory reports and mentions of codes for a specific pathogen in a given week were proportional to the number of deaths due to that pathogen in the same week. Models were of a type of generalized linear model and assumed that non-specific deaths followed a Poisson distribution. The use of an identity link function allowed for the estimated contribution from each covariate to be additive. A constant term was always included to allow for a contribution that could not be attributed to any of the covariates. The two age groups of infants studied were modelled independently of each other.
Modelling was restricted to just the inclusion of covariates that were estimated to make a ‘positive’ contribution to non-specific deaths. Those covariates that were estimated with a negative coefficient were excluded from the model and so were assumed to make no contribution to non-specific deaths. Covariates were excluded one at a time, with the most extreme negative contribution excluded on each occasion. Estimated proportions are based on statistical associations between two time series. The use of the word ‘contribution’ is for convenience, and should be interpreted with caution.
RESULTS
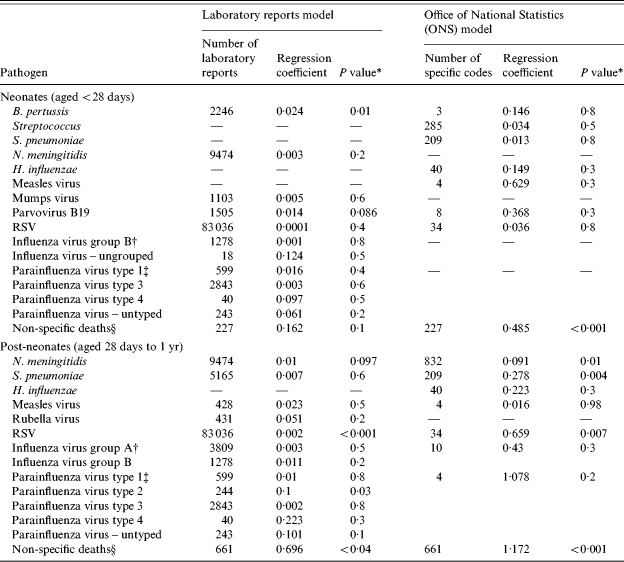
Over the 8-year period from 1993 to December 2000 in England and Wales there were 888 non-specific deaths which met our selection criteria. Of these 227 were in neonates (ages <28 days) and 661 in post-neonates (ages between 28 days and <1 year). The total number of laboratory reports for the studied pathogens over the period (ages <16 years) was 141 154. The total number of mentions of the pathogens under study in deaths reported by ONS (ages <16 years) was 1564 ( Table 3).
Table 3.
Numbers of specific, non-specific deaths and laboratory reports used as well as regression coefficients and significance of the estimates from the two models
Wald test.
The laboratory reports data presented are for influenza virus by group while the ONS data are for influenza virus all groups.
The laboratory reports data presented are for parainfluenza virus by type while the ONS data are for parainfluenza virus all types.
This field contains the number of non-specific deaths included in the study, the regression constant and P value for estimates of deaths not attributable to specific microorganisms.
Laboratory reports model
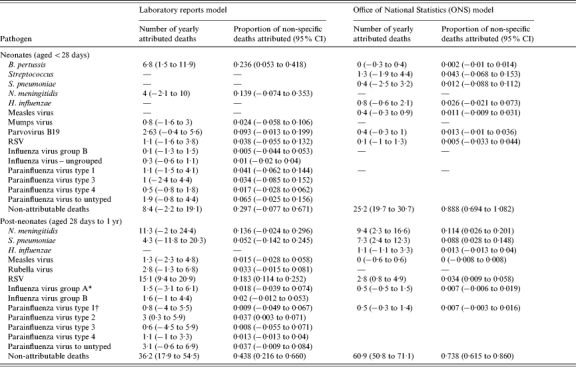
Using laboratory reports of infectious disease as explanatory variables, overall 59·8% or 531 of the non-specific deaths were attributed to specific pathogens over the study period corresponding to 66 deaths per year. In neonates 70·3% or 160 of the non-specific deaths, were attributed to specific pathogens over the study period, corresponding to 20 deaths per year. From the covariates kept in the model in this age group (Table 3) only Bordetella pertussis elicited a statistically significant estimate. The yearly number of non-specific deaths attributable to pertussis was estimated to be 6·75 (95% CI 1·5–11·88) (Table 4). In post-neonates 56·2% or 371 of the non-specific deaths, were attributed to specific pathogens in the 8-year period, corresponding to 46 deaths per year. Two organisms had significant estimates – RSV with 15·13 non-specific deaths attributable per year (95% CI 9·38–20·88) and parainfluenza virus type 2 with three deaths attributable per year (95% CI 0·25–5·88).
Table 4.
Yearly numbers of deaths and proportions of deaths with unknown cause attributed to specific pathogens as estimated from the two models in comparison
The laboratory reports data presented are for influenza virus by group while the ONS data are for influenza virus all groups.
The laboratory reports data presented are for parainfluenza virus by type while the ONS data are for parainfluenza virus all types.
ONS mortality model
Using mentions of infectious diseases caused by specific pathogens in death certificates as explanatory variables overall 22·4% or 199 of the non-specific deaths were attributed to specific infections corresponding to 25 deaths per year. Among neonates, only 11·2% or 26 of the non-specific deaths could be attributable to specific pathogens over the study period corresponding to three deaths per year. Also in the group of neonates no estimates of individual burden of pathogens were statistically significant using this model. In post-neonates 26·2% or 174 of the non-specific deaths were attributed to specific microorganisms over the period of the study, corresponding to 22 deaths per year. There were three organisms with significant estimates of mortality burden among non-specific deaths. Neisseria meningitidis, with 9·38 deaths attributed per year (95% CI 2·25–16·63); Streptococcus pneumoniae with 7·25 deaths attributed per year (95% CI 2·38–12·25) and RSV with 2·75 deaths attributed per year (95% CI 0·75–4·88).
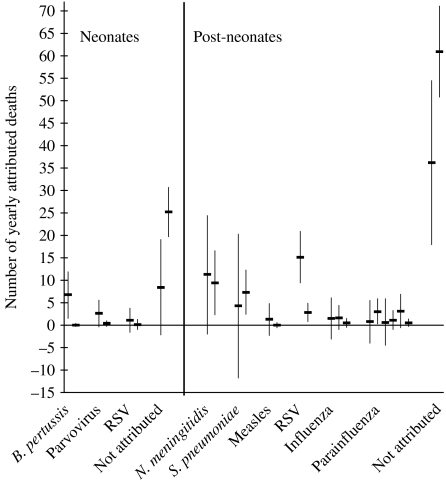
Among neonates there are three variables in common for the two models – pertussis, parvovirus and RSV. In the post-neonatal group meningococcus, pneumococcus, measles virus, RSV, influenza virus and parainfluenza virus were the variables in common for the two models. Estimates of attributable deaths to pathogens common to the two models are presented for comparison in Figure 2. In the neonatal group the confidence intervals of two of the estimates –parvovirus B19 and RSV overlapped very closely across the two models. All of the estimates of the numbers of deaths attributable to pathogens in the post-neonatal group except for RSV had substantially overlapping confidence intervals, with most of the estimates being very close to each other. The estimates which were significant in both models (although different in magnitude) were only in the group of post-neonates. These were the number of deaths attributed to RSV and the estimation of number of deaths that are not attributable to any of the pathogens studied.
Fig. 2.
Yearly number of deaths attributed to specific pathogens for neonates and post-neonates – the estimates present in both models and their 95% confidence intervals in comparison.
In both age groups all estimates from the model based on the laboratory reports were higher both in value and in significance from the estimates of the model based on death certificates with the exception of N. meningitidis, S. pneumoniae in post-neonates, and the non-attributable deaths in both age groups.
DISCUSSION
The number of children who die during infancy in the United Kingdom, particularly in the neonatal period is small, and this makes it more challenging to produce a robust analysis. We assumed that completeness of laboratory surveillance was constant during the study period. This is broadly true in that there were no abrupt changes. The approach we have taken works best for diseases with clearly defined and distinct seasonality [7]. We are dependent for the model on including diseases for which surveillance provides good laboratory data or enough mortality data for the specific causes of death in either model to explain those without a specific cause. This method will not detect the impact of infections for which hardly any laboratory reports are made although the infection is frequent, or infections which rarely appear on death certificates although they are a frequent cause of death. It is not possible to measure or adjust for the potential impact on non-specific deaths of pathogens about which we do not have information. This is especially valid for viral pathogens such as pneumovirus, metapneumovirus, rhinovirus and others [8], which have a marked seasonality closely mirroring that of pathogens included in the study, e.g. RSV. Importantly as the information available determines the outcome for any model and the two data sources differ considerably, the different approaches yield different results.
An additional challenge for neonatal deaths is that we do not have underlying cause of death reported and have to use any mention of a code as a proxy. As we do not know what was the main cause of death we are likely to have included some deaths for which infection was not important and hence lost power to measure the impact of infection. This factor also makes it hard to compare the results for neonatal and post-neonatal deaths. With the small numbers of neonatal deaths, caution should be exercised in interpreting the results for these in particular.
The data used in the study are of grouped nature so we must be careful not to overinterpret results. But because it is difficult to know post factum the aetiological agent responsible for these infectious deaths directly, statistical modelling presents an invaluable method for inferring the likely burden of different pathogens. The inclusion of all ‘positive’ contributions is appropriate even though in many cases the contribution of a covariate to the model was not statistically significant. To exclude such contributions would be to assume no contribution, and potentially bias the results. Non-significant contributions are quite likely to be non-significant simply because of the small number of non-specific deaths available for the analysis.
A strength of the analysis which used only ONS mortality data is that the sequence of events in specific and non-specific causes are synchronous. With the laboratory data we do not know the exact temporal relationship between the time the sample is taken and the time of death. We could have introduced a time lag to account for delay between laboratory sampling and deaths, but in reality the lag is likely to vary between pathogens and between deaths assigned to specific and non-specific causes. For example, it may be that deaths with a specific infectious cause occur later than those for which no diagnosis is made, giving time for laboratory investigation. We chose for simplicity not to introduce any lags into the analysis. This is a conservative approach as it risks negative findings.
Neonatal deaths attributable to B. pertussis were estimated from the model using laboratory reports at 6·8 per year (95% CI 1·5–11·9). This is consistent with results from a previous study [4], which estimated pertussis deaths to be 9 per year among young infants (almost 90% were under 4 months of age) using capture–recapture methods and with other studies also supporting our finding that pertussis is underestimated in young infants [3, 6]. For comparison the ONS reported only 1 death from pertussis in their official figures during 1999 for the entire infant age group and none during 2000 [9, 10]. In the same model and age group, parvovirus B19 was estimated to be responsible for 2·6 (95% CI −0·4 to 5·6) deaths with unknown cause per year and the confidence interval of this estimate overlaps with that of the ONS mortality-based estimate. The low significance of the latter must be viewed in the light of the extremely small number of observations on which it is based.
The only microorganism with an estimated contribution to infant deaths with unknown cause in the post-neonatal age group which was significant in both models (although with very different estimates) was RSV. This is also the pathogen with the highest number of yearly attributable deaths in the study. The laboratory reports-based model estimated the yearly deaths attributable to RSV to be 15·1 (95% CI 9·4–20·9) and the mortality-based model estimated 2·8 (95% CI 0·8–4·9) deaths per year. For comparison the number of RSV infant deaths reported by the ONS was 0 in 1999 and 3 in 2000. A previous study found 4 deaths from RSV in four London clinical units alone over one year (N. S. Crowcroft, unpublished observations), also indicating that RSV deaths are likely to be much more frequent than officially reported and supporting our finding that RSV deaths are underestimated. The fivefold difference between our laboratory-based and mortality-based estimates is again likely to be due to the very low counts available from the ONS source to model this organism.
After RSV the microorganisms with the highest number of attributed deaths were N. meningitidis with 9·4 (95% CI 2·3–16·6) and S. pneumoniae with 7·3 (95% CI 2·4–12·3) attributed deaths per year in post-neonates from the mortality-based model. The number of meningococcal infant deaths reported by the ONS was 30 in 1999 and 23 in 2000. For the pneumococcus these figures were 9 and 8, respectively [9, 10]. Both of the estimates for these bacteria are statistically significant in the model using the ONS data and not in the laboratory reports-based model even though the statistical power of the latter is in general much higher. The explanation of this apparent anomaly may lie in the very small numbers of deaths in the ONS data for RSV, influenza and parainfluenza viruses. As a result, we have not been able to control properly for the effect of these important seasonal pathogens which is likely to have inflated the significance or effect of the bacterial pathogens which exhibit similar seasonal variation, especially pneumococcus. For N. meningitidis this effect is probably of a lesser importance as suggested by the close estimates from the two models and the P value of the laboratory-based estimate.
As many as three deaths of post-neonates per year were attributed to parainfluenza virus type 2 by the model based on laboratory reports and this was a statistically significant estimate. This is an important finding as parainfluenza virus type 2 has not previously been shown to be underestimated or associated with mortality among infants [11] and official mortality statistics do not report any parainfluenza infant deaths [9, 10].
Our model included a parameter allowing for variation in the non-specific infectious deaths that could not be accounted for by the variation in weekly counts of the studied microorganisms. In neonates (Table 4) the mortality-based model elicited a significant estimate of 25·2 (95% CI 19·7–30·7) deaths per year not attributed to any of the pathogens studied. In the group of post-neonates the estimates from both models were statistically significant. The laboratory-based model estimated the non-attributable deaths at 36·2 (95% CI 17·9–54·5) and the mortality-based model, at 60·9 (95% CI 50·8–71·1) deaths per year. Some proportion of this group of unattributed deaths thus obtained could be due to infectious agents not included in the study. Probably at least some of the deaths in this group though are there because they were genuinely not caused by an infectious agent. Conversely, the low laboratory or ONS specific counts with the associated reduction in power could have led to an overestimation in the number of deaths not attributable to an infectious cause. This is supported by the much higher number of non-attributable deaths in both age groups in the model based on ONS mortality – a marked exception from the rest of the estimates in common to the two models, where the ones based on laboratory reports have higher significance and magnitude.
Another factor which could partially account for non-attributable deaths is the opposite seasonal variation of some of the pathogens (parainfluenza virus type 3, for example, peaks in late spring–early summer unlike most other seasonal pathogens which peak in the winter period) which may partly cancel each other out, reducing the estimates of covariates and increasing the constant (non-attributable deaths) (N. J. Andrews, personal communication, May 2004). Although apparently composite, estimates of non-attributable deaths are an indicator for a proportion of non-infectious deaths wrongly classified as infectious by the process of death certification. This has an important implication for policy in this area because it suggests strongly that low specificity is at least as important a problem for the system of death certification as low sensitivity. These issues also have important methodological consequences for any epidemiological study which uses ONS mortality data, by introducing noise and decreasing the power to detect real effects.
The fact that the estimations from the models based on laboratory reports and ONS data differ so much partly reflects the different quality of each dataset. The much larger number of attributed deaths in the laboratory reports model, the overall higher level of significance in both age groups (apart from N. meningitidis and S. pneumoniae), and the higher number of weekly counts available, suggests laboratory reports may be more reliable. Among other things this reinforces the importance of good surveillance and the benefits of laboratory reporting especially when other reliable sources of data are lacking. It shows that ONS data have scope for improvement in the precision of assigning cause of death. In part this is a question of information from laboratory results being included in the medical certificate of cause of death. The sophistication of routine and reference microbiological methods is such that it should be less and less frequent for there to be no precise cause of death for infants who die. However, such methods may not always be applied [12].
Regardless of the differences in the power of the two models to estimate the deaths attributable to this group of microorganisms, many of the individual estimates agree across the two models as illustrated very convincingly in Figure 2. The confidence intervals for all of them, except two, overlap, most of these to a substantial degree. Bearing in mind the vastly different nature of the two information sources used, this reinforces the validity of our approach. Our work utilizes the temporal variation of a large number of pathogens over 8 years, which makes our estimates quite robust.
To appreciate the magnitude of the yearly deaths attributed to these pathogens it is important to keep in mind that these deaths are unaccounted for through the procedure of death certification and traditional methods of surveillance and are thus likely to be deaths in excess of those already identified from each of the pathogens. As the annual number of deaths from most of the microorganisms studied is small, the yearly deaths identified with our method for most of these pathogens are a substantial addition.
In our opinion future, more specialized, studies should concentrate on pathogens for which our explorative work has found deaths to be underestimated, especially RSV, pertussis and parainfluenza virus type 2. An important message from our study is the value of good quality surveillance information and future studies should strive to acquire better quality and larger datasets or perhaps to collect primary data. Of course our analysis could be explored further, attempting to ensure better quality data, and also by including more of the pathogenic organisms important in infants, such as pneumovirus, metapneumovirus, rhinovirus. This method could also be used for looking into potential infectious causes of sudden infant death syndrome (SIDS).
Our approach has been able to estimate considerable hidden burden from a number of infectious pathogens in infants. This will inform surveillance and future epidemiological studies. As most of this mortality is preventable through existing or currently developed vaccines [13, 14], we hope the study results will help to inform priority setting and to tailor specific public health interventions, including vaccination, to the aetiology of infant deaths.
ACKNOWLEDGEMENTS
The authors thank Douglas Harding for help with producing the initial dataset. Peter Craig developed complex queries generating the weekly counts of ‘any mention’. We thank Nick Andrews and Tom Nichols for advice with the analysis and for help and advice we thank Maria Zambon, Nigel Gay, Usha Gungabissoon, Alessia Melegaro, Joanne White, Nichola Goddard and Jonathan Crofts.
DECLARATION OF INTEREST
None.
REFERENCES
- 1.Edmunds WJ et al. The potential cost-effectiveness of acellular pertussis booster vaccination in England and Wales. Vaccine. 2002;20:1316–1330. doi: 10.1016/s0264-410x(01)00473-x. [DOI] [PubMed] [Google Scholar]
- 2.Trotter CL, Edmunds WJ. Modelling cost effectiveness of meningococcal serogroup C conjugate vaccination campaign in England and Wales. British Medical Journal. 2002;324:809. doi: 10.1136/bmj.324.7341.809. [DOI] [PMC free article] [PubMed] [Google Scholar]
- 3.Nicoll A, Gardner A. Whooping cough and unrecognised postperinatal mortality. Archives of Diseases in Childhood. 1988;63:41–47. doi: 10.1136/adc.63.1.41. [DOI] [PMC free article] [PubMed] [Google Scholar]
- 4.Crowcroft NS et al. Deaths from pertussis are underestimated in England. Archives of Diseases in Childhood. 2002;86:336–338. doi: 10.1136/adc.86.5.336. [DOI] [PMC free article] [PubMed] [Google Scholar]
- 5.Mueller-Pebody B et al. Contribution of RSV to bronchiolitis and pneumonia-associated hospitalizations in English children, April 1995 – March 1998. Epidemiology and Infection. 2002;129:99–106. doi: 10.1017/s095026880200729x. [DOI] [PMC free article] [PubMed] [Google Scholar]
- 6.Crowcroft NS et al. Severe and unrecognised – pertussis in UK infants. Archives of Diseases in Childhood. 2003;88:802–806. doi: 10.1136/adc.88.9.802. [DOI] [PMC free article] [PubMed] [Google Scholar]
- 7.Ryan MJ et al. Hospital admissions attributable to rotavirus infection in England and Wales. Journal of Infectious Diseases. 1996;174:S12–S18. doi: 10.1093/infdis/174.supplement_1.s12. (Suppl. 1): [DOI] [PubMed] [Google Scholar]
- 8.Van den Hoogen BG et al. A newly discovered human pneumovirus isolated from young children with respiratory tract disease. Nature Medicine. 2001;7:719–724. doi: 10.1038/89098. [DOI] [PMC free article] [PubMed] [Google Scholar]
- 9.Office of National Statistics. Mortality statistics – cause. Review of the Registrar General on deaths by cause, sex and age, in England and Wales. 1999;DH2(26):2–88. [Google Scholar]
- 10.Office of National Statistics. Mortality statistics – cause. Review of the Registrar General on deaths by cause, sex and age, in England and Wales. 2000;DH2(27):2–92. [Google Scholar]
- 11.Laurichesse H et al. Epidemiological features of parainfluenza virus infections: laboratory surveillance in England and Wales, 1975–1997. European Journal of Epidemiology. 1999;15:475–484. doi: 10.1023/a:1007511018330. [DOI] [PubMed] [Google Scholar]
- 12.Crowcroft NS, George R, Okoro C. Need for expert laboratory investigation of sudden unexpected deaths in infancy. http://bmj.bmjjournals.com/cgi/eletters/328/7435/331#51819 British Medical Journal. [rapid response online] 27 February 2004 [cited 18 March 2004] ( [Google Scholar]
- 13.Dudas RA, Karron RA. Respiratory syncytial virus vaccines. Clinical Microbiology Reviews. 1998;11:430–439. doi: 10.1128/cmr.11.3.430. [DOI] [PMC free article] [PubMed] [Google Scholar]
- 14.Choo S, Finn A. New pneumococcal vaccines for children. Archives of Diseases in Childhood. 2001;84:289–294. doi: 10.1136/adc.84.4.289. [DOI] [PMC free article] [PubMed] [Google Scholar]


