

SUMMARY
With reports of hospital-acquired methicillin-resistant Staphylococcus aureus (MRSA) continuing to increase and therapeutic options decrease, infection control methods are of increasing importance. Here we investigate the relationship between surveillance and infection control. Surveillance plays two roles with respect to control: it allows detection of infected/colonized individuals necessary for their removal from the general population, and it allows quantification of control success. We develop a stochastic model of MRSA transmission dynamics exploring the effects of two screening strategies in an epidemic setting: random and on admission. We consider both hospital and community populations and include control and surveillance in a single framework. Random screening was more efficient at hospital surveillance and allowed nosocomial control, which also prevented epidemic behaviour in the community. Therefore, random screening was the more effective control strategy for both the hospital and community populations in this setting. Surveillance strategies have significant impact on both ascertainment of infection prevalence and its control.
INTRODUCTION
The development of antimicrobial resistance in many nosocomial pathogens poses a serious threat to public health. Methicillin-resistant Staphylococcus aureus (MRSA) presents a particular problem with the majority of English acute NHS Trusts being affected [1] and the number of isolate reports increasing [2].
With therapeutic options scarce, and becoming scarcer, infection control methods are becoming increasingly important with a focus on providing preventative rather than reactive measures. However, studies on control measures are limited [3] and evidence for their effectiveness sparse and often contradictory [4]. Current guidelines are based on medical and scientific rationale and suggestive evidence rather than study results [4]. However, with infection rates relentlessly increasing, old guidelines have become unfeasible and impractical to perform and now flexible, targeted approaches tend to be favoured [5]. As a consequence strategies are not uniformly applied and vary from hospital to hospital.
As infection is almost invariably acquired by transmission (particularly via the hands of health-care workers) rather than developing de novo, effective infection control is usually brought about by preventing spread. There are two basic approaches: universal and targeted. Universal approaches, such as increasing hand hygiene, aim to reduce the transmission opportunities between patients, but are not specifically aimed at patients known to be infectious. If they can be implemented to such an extent that each infectious patient produces (on average) less than one other infectious patient, then this intervention alone is sufficient to control infection within the hospital. In contrast targeted approaches rely on identification of infectious cases through surveillance, and taking steps to reduce their infectiousness from the point of detection (we term these steps ‘isolation’). Detecting MRSA in routine clinical samples has been shown to be inadequate and epidemiological surveillance allowing identification and treatment of carriers is crucial to epidemic control and reduction in infection numbers [6–9]. The implementation of detection and isolation programmes remains controversial due to uncertainty over efficacy coupled with the inherent costs and disruption involved, as well as limited isolation resources.
In addition to allowing targeted control, surveillance of infection (i.e. detection) plays an important role in measuring the magnitude of the problem, determining the penetrance of antibiotic resistance [e.g. vancomycin-resistant Staphylococcus aureus (VRSA)] and determining the effectiveness of control. Consequently, control of infection by detection and isolation is not independent of surveillance. In this paper we address this relationship between surveillance and control.
Mathematical modelling
Mathematical models provide a way of testing control strategies theoretically prior to their implementation, and give an indication of factors which may lead to control success/failure.
Models of infectious disease transmission dynamics commonly fall into one of two categories: deterministic or stochastic. Deterministic models use differential equations to approximate the mean behaviour from initial conditions. Whereas stochastic models define movements of individuals to be chance events occurring at random time-intervals determined by the model parameters, meaning the outcome may be different for different simulation runs. There have been a number of previous models looking specifically at nosocomial infection transmission dynamics [10–19]. This work builds on those studies, particularly those by Cooper et al. [4, 18, 19] which use stochastic models to explore the spread of nosocomial pathogens. The novel aspect of this work, however, is that we model transmission between a hospital and community and within this setting include both control (by isolation) as well as active surveillance, in a single framework.
In particular we address questions relating to surveillance and control of MRSA in an epidemic setting through two screening strategies: random and on admission. The overall objective was to develop a simple stochastic model of MRSA transmission dynamics to explore the effects of the different screening strategies upon MRSA control, taking into consideration the effect of both the hospital and community populations.
In the first section we define the model structure and underlying assumptions, including some simple analytical results. We then use the model to produce some numerical simulations, initially presenting a simple comparison of the two screening strategies in terms of numbers detected, and then consider the level of effort put into each strategy (i.e. numbers screened per day). To examine the relationship between surveillance and control, we consider the implementation of isolation once positive patients are identified and therefore determine how the effectiveness of detection for each strategy translates to the effectiveness of control.
METHODS
Description of model framework
The framework is based closely on Cooper et al. [4, 19]. Briefly, we model a closed population consisting of both a fixed-size hospital and the community it serves. Individuals in both the hospital and community populations are categorized as either MRSA-positive and infectious (either infected or colonized) or MRSA-negative and susceptible to infection (for brevity referred to as infected and susceptible respectively from now on).
Infected in-patients are classified into one of three groups: isolated (ISO), detected but not isolated (DNISO) or undetected infected (UIH). Isolated patients are those known to be MRSA-positive and consequently placed in an isolation facility; detected not isolated patients are those known to be positive but who cannot be isolated; and undetected infected patients are those not known to be infectious. By isolation, we consider any mechanism by which patients are effectively isolated in terms of transmission; this might include specific facilities (e.g. an isolation ward) or staff (e.g. cohort nursing). For convenience, we use isolation ward (IW) as the abbreviation for this facility. The key assumptions are that isolation is perfect (i.e. transmission from isolation never occurs) and it is limited (i.e. there is a fixed capacity in terms of the numbers of patients that can be isolated at any one time, given by NISO). Infected patients are detected, and isolated if capacity is available (if the fixed capacity of IW not reached), and marked DNISO otherwise. Thus, observed (apparent) hospital prevalence of infection (i.e. those picked up by screening) is ISO+DNISO, whereas the actual (real) prevalence is ISO+DNISO+UIH.
Under the assumption of 100% bed occupancy, patients discharged from hospital are immediately replaced by an individual from the community, with the rate of discharge being assumed equal for all hospital subgroups (i.e. regardless of infection status).
The community population is also split into subgroups, each with a different readmission rate. Discharged patients at first enter the group with a high readmission rate (C1) from where, if they are not readmitted, they move at a set rate to the second community group (C2) with a lower readmission rate [4]. The number of susceptible and infected individuals in C1 and C2 are denoted SC1, IC1, SC2 and IC2 respectively.
Transmission is assumed to be within the hospital only, meaning the dynamics are hospital driven. The rate of infection of susceptible patients is determined by the proportion of UIH and DNISO patients, i.e. isolated patients do not contribute to infection, and for simplicity it is assumed that UIH and DNISO patients are equally infectious. Homogeneity is assumed within the susceptible population with all individuals having an equal chance of becoming infected. For simplicity, recovery of infected patients is assumed to occur at an equal rate for all infected groups in both the hospital and community and isolated patients were assumed not to recover but to be discharged infected. However, the effects of eradication therapy may mean that in fact the recovery rate for known infected (and therefore treated) patients would be greater than for untreated patients (i.e. undetected infected and infecteds in the community). Additionally, homogeneity of MRSA is assumed in terms of both transmissibility and detectability.
Within this setting we consider two screening strategies: random and on admission. Both strategies are assumed to be 100% accurate and the effects of sensitivity and specificity are not included explicitly, although their effects can be included in the model parameters.
Random screening allows patients to enter the hospital unscreened as either susceptible (SH) or undetected infected (UIH). Routine random screening then occurs at a set rate (φ), so that each patient is screened at an average interval of 1/φ. Detected infections are moved into the IW. If the IW is at capacity then these detected patients are DNISO and have priority to move into IW when space becomes available, i.e. when an isolated patient is discharged.
The on-admission screening strategy screens a proportion (ω) of patients on entry to the hospital so detected infected individuals are placed directly in isolation and cannot infect. Again, if the IW is at capacity then detected infected patients become DNISO. Note that a proportion (1 – ω) of admissions are unscreened and join SH or UIH appropriately, where they will remain unscreened for the duration of their stay.
To allow effective comparison between the two strategies the numbers of patients screened per day were set to be equal. The number screened at random is φN per day (where N is hospital capacity) and the admission rate is μN per day (where 1/μ is average length of stay) so that the numbers screened on admission per day are ωμN. For the screening effort to be equal:
Schematic diagrams of the two screening strategies are presented in Figure 1, although the model framework allows both strategies to be included simultaneously. Parameter values are in accordance with previous work by Cooper et al. [4], and are given in Table 1.
Fig. 1.

Schematic diagram of the model for both screening strategies. See text for symbol definitions. The bold lines indicate the screening process. (a) Random screening; (b) on-admission screening.
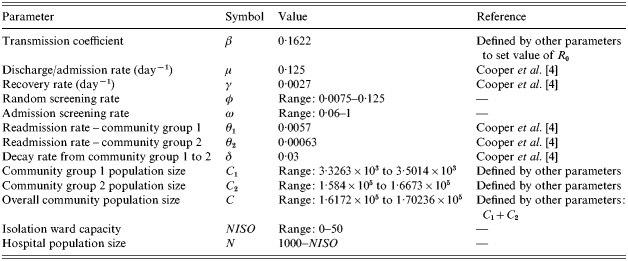
Table 1.
Parameter values used in the model
The model proceeds as a stochastic, iterative process with successive events performed after random time-intervals (drawn from a negative exponential distribution with the rate given by the total rate of events) and events occurring to whole individuals. This stochastic nature of the model is essential for the simulation of dynamics of hospital infections, where random events have the potential to greatly influence outbreak behaviour [18]. Unlike all other events, the movement of susceptible individuals from C1 to C2 is assumed to be deterministic due to the large numbers of individuals involved. All stochastic events and their corresponding rates are listed in Table 2.
Table 2.
Events in model and their rates
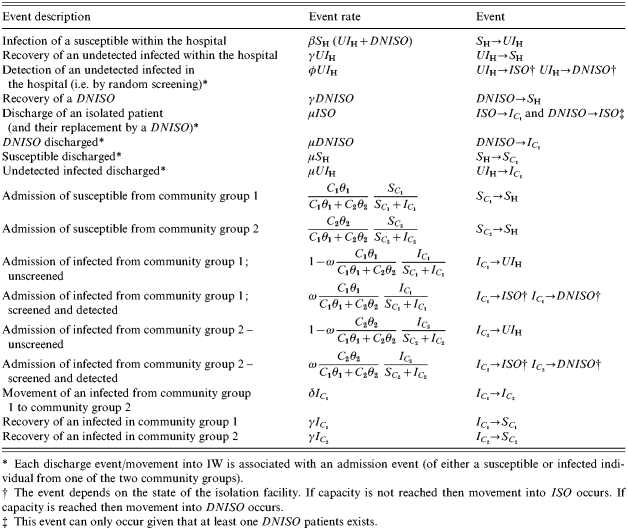
Each discharge event/movement into IW is associated with an admission event (of either a susceptible or infected individual from one of the two community groups).
The event depends on the state of the isolation facility. If capacity is not reached then movement into ISO occurs. If capacity is reached then movement into DNISO occurs.
This event can only occur given that at least one DNISO patients exists.
The model was written and run in matlab® (MatLab, The MathWorks, Natick, MA, USA) on a personal computer.
Analytical results
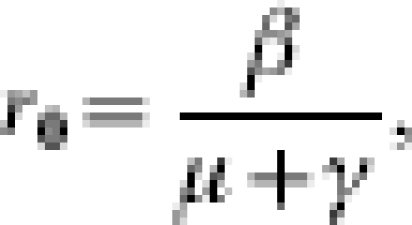
The transmissibility of the infection is considered in terms of the basic reproduction number (R0), defined as the average number of secondary cases caused by one primary case in a completely susceptible population. For models explicitly including the community, there are two components to R0: a within-hospital value (r0) and a term to include the possibility of multiple returns to hospital [19]. The within-hospital reproduction number in the absence of intervention, given by
 |
considers only the number of secondary cases arising from a single admission. The overall R0 considers the number of secondary cases caused by a single visit and the mean number of visits per patient, while they are still infected [4]. If P is the probability that an infected patient is discharged and readmitted while still infected (in the absence of control), then 1/(1 – P) is the mean number of infected visits, so that
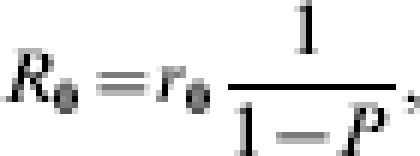 |
where
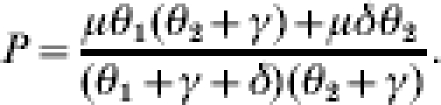 |
Therefore R0 can be expressed as
Including control by isolation (but not any constraint on isolation capacity) has differing impact depending on the screening strategy adopted. Random screening has the effect of curtailing the period of time over which infected individuals can transmit (i.e. they are removed from general circulation). If  is the within-hospital reproduction number with random screening, then
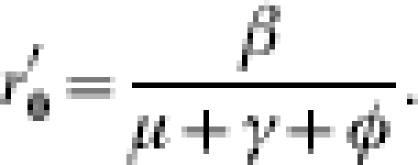 |
Whereas, when patients are screened on admission, the effect is to reduce P to P′ where P′=(1 – ω)P.
The value for r0 (within-hospital) was taken from the study by Cooper et al. [4] and set at 1·27 and the value of P was calculated to be 0·037 using the parameter values shown in Table 1 (taken from the same study), these parameters give an overall R0 value of 1·32.
We solve the model numerically for different parameter values, concentrating on the combined effects of the amount of effort put into each strategy (φ and ω) and the capacity of the IW. The outcome variables of interest are the apparent and real infection prevalences in the hospital and community (i.e. surveillance and control success).
RESULTS
Surveillance of epidemic (no control)
Initially we consider the effect of the two surveillance strategies in the absence of any control during an epidemic (i.e. from the introduction to endemic state). Figure 2(a, b) shows 10 epidemic simulations in terms of the real number of infections in the hospital and community. With the chosen parameters the prevalence in the hospital and community reach approximately 400/1000 and 14 000/170 234 respectively. The apparent number in the hospital (i.e. those detected through active surveillance) is shown for the two screening strategies: random (Fig. 2 c) and on admission (Fig. 2 d). There are two features to note. First, random screening is more efficient in that more infected individuals are detected (the equilibrium value is ∼160 as opposed to ∼80). Second, the pattern of timing of detection with random screening closely follows the pattern of the overall hospital prevalence, whereas detection with screening on admission follows the community prevalence pattern, which is slower with a pronounced lag of about half a year.
Fig. 2.

Results of 10 simulations with no control over 1800 days (∼5 years): (a) real hospital prevalence including both known and unknown infected individuals; (b) real community prevalence; (c) apparent hospital prevalence under random screening; and (d) apparent hospital prevalence under screening on admission. Note the different vertical scales. Screening parameter values are φ=0·087 and ω=0·7 (such that 70% of the admissions/day are screened). All other parameters are set to the values in Table 1.
The relationship between real and apparent prevalence for one epidemic further highlights differences between the two strategies (Fig. 3). For random screening, the apparent prevalence reflects the real prevalence within the hospital, i.e. there is a linear relationship so that a doubling in real hospital prevalence gives a proportional increase in the number detected (Fig. 3a). Surveillance efficiency is the slope of the relationship, so that, for example with φ=1/8 days, ∼50% of all infections in the hospital are detected (200 vs. 400). However, the same relationship is not seen between apparent and real prevalence in the community (Fig. 3 b). There is an initial linear relationship between real and apparent prevalence, but once the real community prevalence reaches a threshold level (between 1000 and 2000 infected individuals), and the epidemic takes off in the community, further increases in community prevalence make very little difference to the numbers detected by random screening in the hospital. For example, for φ=1/16 days, for all community prevalence values between approximately 2000 and 9000 the corresponding apparent prevalence results are within the narrow range of around 80–140. However, increasing the detection effort results in increased efficiency and more sensitive results (the relationship is more linear).
Fig. 3.

Real and apparent prevalence for different surveillance effort levels over a single epidemic. Lines join adjacent points 7 days apart during the epidemic, the total duration of observations=1800 days (∼5 years). Panels (a) and (b) display results for random screening with three φ values: ●=1/8 days; □=1/16 days; ×=1/133 days. Panels (c) and (d) display results for screening on admission for three corresponding values of ω: ●=1; □=0·6; ×=0·06. Parameters are set to the values in Table 1.
Screening on admission provides less effective detection overall (note the difference in horizontal scales). This strategy underestimates hospital infection at low prevalence levels (during the early stages of the epidemic), although the relationship becomes more linear once infection levels become sufficiently high (a threshold level of ∼250) (Fig. 3 c), especially with increased effort (measured as the proportion screened on admission, ω). In contrast to random screening, on-admission screening reveals a linear relationship between real and apparent community prevalence meaning the apparent prevalence more accurately reflects the real prevalence throughout the epidemic. The efficiency of this is increased with increasing screening effort (i.e. the slope of the relationship decreases with an increase in effort). Note that for both strategies the hospital prevalence reaches an endemic state at the end of the simulation (the points are clumped together).
In terms of surveillance, screening on admission clearly provides a better approach to estimating community prevalence than screening in-patients at random. However, screening on admission provides much more limited information on hospital prevalence, which is better estimated by randomly screening in-patients.
Control of epidemic
Upon introduction of a control measure the values for r0, P and R0 are altered dependent on screening effort. The corrected r0, P and R0 values are 0·76, 0·037 and 0·79 for a random screening effort of φ=0·087 and 1·27, 0·011 and 1·28 for an on-admission screening effort of ω=0·7 (effort values correspond to those in Fig. 4).
Fig. 4.

Simulations of 10 epidemics over 1800 days (∼5 years) with an IW of capacity 20. Random screening (φ=0·087) is shown in the left hand panels and on-admission screening (ω=0·7) on the right. The four rows examine: hospital prevalence; number of patients in IW, number of DNISO patients and community prevalence. All other parameters are set to the values in Table 1.
Figure 4 shows 10 simulations under each screening strategy when a control measure is present, in this case an IW with capacity of 20 patients so that the detection of individuals serves an additional purpose: it allows them to be isolated, in the expectation of preventing transmission and, hence, an epidemic. The two strategies show very different dynamics.
Random screening gives the greatest control; both hospital and community prevalence is lower than for on-admission screening [cf. panels (a) vs. (b) and (g) vs. (h) in Fig. 4]. The number of infected individuals in the hospital appears to increase very gradually throughout the simulation period under random screening. One of the simulations begins to show epidemic behaviour at the end of the period, but for most simulations the number of infected individuals remains below 50 with only small-scale fluctuations. The capacity of the IW (NISO=20) is generally adequate with most detected individuals being able to be placed under control and IW overflow occurring infrequently (Fig. 4 c, e). The community prevalence also gradually increases over time (Fig. 4 g). For most simulations (excepting the one exhibiting epidemic behaviour) the maximum is ∼800 by the end of the simulation period.
Overall, random screening appears to exhibit control but with gradually increasing numbers of infected individuals causing control capability to be increasingly stretched and IW overflow and epidemic behaviour increasingly likely.
Screening on admission allows epidemics within the hospital which take off rapidly and remain uncontrolled; the endemic state that develops has an equilibrium value of ∼300 infected individuals (Fig. 4 b). Corresponding with the hospital epidemic the IW quickly reaches and remains at its capacity of 20 patients and subsequently overflows (Fig. 4 d). The number of DNISO patients more steadily increases up to an equilibrium of ∼60 (Fig. 4 f). The community prevalence levels show a slower epidemic pattern than that in the hospital, reaching nearly 14 000 infected individuals at equilibrium (Fig. 4 h).
Overall, on-admission screening does not control MRSA under the chosen parameter values. The epidemics in all simulations take off quickly causing the IW to become overwhelmed, in turn leading to a build up of known positive patients who cannot be isolated.
Surveillance and control
Figure 5 explores the relationship between surveillance and control, looking at the effect of surveillance effort (φ and ω) in terms of number of infections/detections summed over the simulation period (1800 days) given different control capabilities (i.e. IW sizes).
Fig. 5.

Relationship between screening and control for random screening (a, c) and on-admission screening (b, d). Panels show the average number of infection events (a, b) and detection events (c, d) over a simulation period (∼5 years) from 10 simulations (note that the scale for (a) and (b) ranges from 0 to 35 000 infections). The epidemics were run with different IW sizes: □=10; ●=20; ○=50. All other parameters are set to the values in Table 1.
Under random screening the average number of infections in the simulation period can be seen to decrease with increasing screening effort (Fig. 5 a). The effect of increasing IW capacity is to reduce the level of effort required to achieve the same result, e.g. to achieve a fall to 15 000 infections per simulation period a detection effort of φ≈0·06 is required when the IW capacity is 50, compared to a detection effort of φ≈0·09 when the IW capacity is 10.
The results for screening on admission show a different picture (Fig. 5 b); the average number of infections during the simulation period remains high until >80% of admissions are successfully screened. Larger IW sizes correspond to slightly fewer infection events but have relatively little effect, i.e. the constraint is the detection.
The number of detections over the simulation period for both policies is peaked with a single maximum. The initial increase is caused by the fact that as screening effort increases then so does the ability to detect infected individuals. However, the steady decline in numbers of detections that follow the peak is due to the fact that detection enables effective control. Therefore, there are fewer individuals available to be detected, leading to fewer detection events. For random screening an increase in IW capacity causes the peak to be reached at lower effort levels and with lower numbers of detections meaning that detection is efficient and isolation capacity is a constraint for control success.
For on-admission screening, the average number of detections over the simulation period (Fig. 5 d) increases linearly with detection effort, up to 80% screening. Detection effort values over this give a decreasing number of detection events, corresponding to the control seen after this effort level (Fig. 5 b), i.e. once control occurs there are fewer infected individuals to detect. The peak in the number of detections occurs at a much higher effort level for on-admission screening (Fig. 5 d) than for random screening (Fig. 5 c), meaning that random screening is more efficient, i.e. less detection effort is required for successful control.
Results in terms of R0
These results can be explained by considering overall and within-hospital R0 values given different levels of surveillance effort for each strategy. Figure 6 shows a diagrammatic representation of R0 values and compares both the within-hospital r0 and the overall R0 (which includes both the hospital and community by considering R0 over multiple visits) for the two screening strategies.
Fig. 6.

Diagrammatic representation of r0 and R0 values given different screening effort levels. Thin lines denote random screening and bold lines screening on admission. The dotted lines show within-hospital r0 values, dashed and dotted lines 1/(1 – P′) values, and unbroken lines overall R0 values. Parameters used: initial r0=1·27, P=0·037, initial R0=1·32, φ=range 0–0·125, ω=range 0–1.
Upon an increase in surveillance effort, random screening gives a decrease in within-hospital r0 and the overall R0 value decreases at the same rate. Random screening has no effect on the readmission of community infection. The decrease in the overall R0 is simply due to the hospital r0 effects. Conversely, screening on admission has no effect at all on the within-hospital r0 and the decrease in the overall R0 corresponds only to the decrease in infectious readmissions from the community (P).
Figure 6 shows that for on-admission screening the overall R0 can never be brought below the within-hospital r0, meaning that using these parameter values, with an r0>1 (r0=1·27), on-admission screening will never be able to control MRSA even at 100% screening (i.e. ω=1). However, in Figure 5 on-admission screening at ω=1 allows control. This is due to the assumption that at ω=1, 100% of admitted patients are screened and all of these screens effective. As all infected individuals are assumed to be in the community population initially, 100% effective screening will prevent any infectious individuals ever entering the hospital, i.e. the screening barrier is never breached. Therefore, despite the within-hospital r0 being >1 no infectious individuals are ever actually present within the hospital to transmit MRSA.
DISCUSSION
We believe that this is the first attempt to simultaneously consider the effects of surveillance and control on the transmission dynamics of nosocomial infections. Surveillance plays two important roles with respect to control. First, active surveillance allows detection of infected (and possibly more importantly asymptomatic, colonized) patients. This identification is necessary for targeted control that curtails the infectious period (‘isolation’). The second role of surveillance is to estimate the burden of infection, which is essential if the success of any control strategy is to be quantified.
Surveillance and control interaction
For many bacterial infections, the risk of disease (with overt clinical symptoms) given infection/colonization is small and dependent on other factors (e.g. surgical wounds, catheterization, presence of intravenous devices and antibiotic use). Consequently, monitoring and controlling infection requires active surveillance to detect individuals with asymptomatic carriage. Inadequate surveillance causes any control strategy to fail as too few infectious patients are isolated and transmission is not sufficiently reduced (i.e. R0 remains >1). However, despite actually failing, the control strategy can appear effective since the apparent prevalence is low due to the inefficiency of detection. The potential for misinterpretation lies in the fact that a successful surveillance and control programme would give exactly the same results in terms of numbers detected. When infection is controlled the apparent prevalence is low, not due to the inadequacy of surveillance, but because it reflects real prevalence. This finding is displayed in Figure 5(c, d) where the same apparent prevalence is seen for both low and high detection efforts.
The two screening strategies examined here display different control capabilities in an epidemic situation simply due to the differences in detection capability. With random screening, the apparent hospital prevalence reflects the real hospital prevalence consistently for all real prevalence values, i.e. there is a linear relationship (Fig. 3 a). Therefore epidemics can be prevented (by isolation) while infected numbers are still low. The IW can cope with these small numbers of detected patients and the epidemic can be controlled before it becomes endemic. By contrast, screening on admission means that apparent prevalence reflects community prevalence accurately, but reflects real hospital prevalence only when real prevalence levels are high (i.e. when the hospital prevalence also reflects community prevalence) (Fig. 3 c, d). Therefore the IW is more likely to be overwhelmed and the control strategy fail [19].
At the start of an epidemic, the majority of infections are amongst in-patients, so provided there is isolation capacity, epidemics within the hospital are controlled by random screening before they disseminate into the community (Fig. 4 g). Whereas, screening on admission cannot detect infected individuals in the hospital, who may be either (a) readmissions of infected individuals from the community (the probability of which increases as the community prevalence increases) that remain unscreened (with a probability of 1 – ω) or (b) those who have acquired MRSA whilst in hospital. Therefore, these patients provide an unchecked source of infection. Additionally, DNISO patients are also a potential source on infection. With on-admission screening, the number of DNISO patients resembles the epidemic pattern seen in the community because IW overflow is caused only by admitted patients (i.e. from the community). As soon as the IW becomes full it remains full, therefore all admitted, screened patients move straight into this class. Consequently, whatever the levels of infection look like in the community, this pattern will be reflected in the hospital.
Control of dissemination of MRSA throughout the community requires effective control of nosocomial MRSA transmission [20] and, therefore, the surveillance/control strategy adopted, whilst not neglecting community effects, should concentrate on reducing hospital transmission. We believe this implies that on-admission screening alone cannot be used to control MRSA epidemics or any other infection which is driven by transmission between in-patients. This would apply to the pending epidemics of VRSA. However, on-admission screening may play an important role in surveillance and control of endemic infection (i.e. when it is well established in the community); in particular it provides an estimate of the infectious assault a hospital is experiencing, community prevalence and past transmission.
We have shown that screening in-patients randomly provides the best information on hospital prevalence (Fig. 3) and is most effective at reducing the rate of infection within the hospital (Fig. 6). In contrast, screening on admission provides a better approach to estimating community prevalence (Fig. 3) but does not reduce within-hospital r0; therefore, the overall R0 can only ever be reduced to the initial within-hospital r0 value. As transmission is determined by the within-hospital reproduction number, random screening becomes the more effective strategy overall.
Choosing a screening strategy
Hospital infection control is costly and despite some evidence suggesting infection-related costs exceed those of screening and control [4, 21–23], the costs and benefits associated with screening are largely unknown. This may lead to reservations regarding strategy implementation and so a greater understanding of the potential benefits and pitfalls is clearly needed.
Combination screening
It is likely that a combination of screening strategies is desirable, reducing both hospital transmission and infectious assault. Further research is required to determine optimal combination strategies, within given constraints (e.g. the number of patients that can be screened per day), and dependent on given goals. The community prevalence and pathogen transmissibility values will help determine the optimal combination, i.e. the optima will change for different epidemic/endemic situations. For example, if community prevalence is high and transmissibility low then a reduction in R0 through screening on admission may be most effective, but in a setting of low community prevalence and high pathogen transmissibility then a reduction in within-hospital r0 would probably be most beneficial and, therefore, random screening favoured.
Consideration of setting
All simulation results in this study are for specific R0 and r0 values, 1·32 and 1·27 respectively; we believe this situation is similar to those in most UK settings. If other parameters had been chosen such that initial r0 was <1 (i.e. insufficient to allow an epidemic in the hospital) but overall R0 was >1 then readmissions of infected patients would be essential for MRSA endemicity so that screening on admission may be more effective. Further analytical investigation would allow dependence of each strategies’ success/failure upon parameter and r0 values to be determined.
Therefore, when considering how to deal with potential epidemics, such as VRSA, factors such as estimated reproduction numbers, hospital and community prevalences and readmission rates need to be taken into account.
A more targeted approach to targeted surveillance
Screening through routine clinical specimens has been shown to be inadequate and an active screening programme will generally be required to control MRSA [24]. The random and on-admission strategies included here are expensive and intensive. In reality screening is likely to occur in a more targeted way, in that certain criteria help determine which individuals are to be screened. For example, van Saene et al. [25] suggest only those at high risk should be targeted and less effort given to those where MRSA is unlikely to increase mortality. Targeted screening to high-risk groups alone has been shown to be effective in a number of studies [26, 27]. Other targeted approaches include screening health-care workers to prevent subsequent transmission to patients [28], and also so-called ‘ring-fencing’ where screening is targeted to the contacts of a known case [29].
A potential problem with these targeted methods is that their failure may go unnoticed due to the fact that those individuals who are not specifically targeted may provide a reservoir of undetected infection. As no screening would occur for untargeted individuals, no MRSA would ever be detected; however, this would not necessarily mean that MRSA was not present, i.e. there may be large differences between real and apparent prevalence. Thus, targeted methods of screening, unless implemented carefully, may lead to control failure. Randomly screening outside the target group may be a way of overcoming this problem.
Limitations of the model
The main limitations are due to the simplification of the system and the resulting reduction in heterogeneity.
As homogeneity is assumed, and no patient is more or less likely to transmit or contract MRSA than any other, the effects of targeted screening, for example of high-risk groups or health-care workers, cannot be explored. For example, it may be a hospital’s policy to screen all patients going into an intensive care unit [30] but not for other wards. Our simple average screening rate is inadequate to determine the impact that this selective screening may have on transmission dynamics. Heterogeneity in patient susceptibility (to infection and disease) is also missing. Additionally, the assumption that the rate of discharge is equal for all hospital subgroups ignores a particular feature of MRSA: it increases length of stay. Perhaps most importantly, we do not include heterogeneity in patient contact rates, other than to assume that recently discharged patients have a higher rate of readmission. For example, the possibility that prolonged length of stay and/or infection with MRSA (as well as other factors such as age) might increase the readmission rate is not included. It is likely that the ‘mixing’ of patients and staff will have important impacts on the transmission dynamics, especially when considering multiple health-care facilities with a single community reservoir. Movements of individuals (particularly persistent carriers) between hospitals, long-term care facilities and community populations need to be included in order to model MRSA transmission dynamics effectively [31, 32].
It must be borne in mind that this model is not meant to be used as a forecasting tool but rather to give an indication of factors that would contribute to a successful control strategy and to force a theoretical framework to be established and thus complex relationships to be brought down to their simplest form. This requires an understanding of underlying processes involved [13] and helps to identify areas in which more precise information is needed [11].
CONCLUSIONS
Surveillance is essential to infection control and the particular surveillance strategy adopted can dramatically alter the effectiveness of this control. Given exactly the same control strategy and setting, one surveillance strategy may allow a particular control method to work and prevent spread, whilst another may cause it to fail and an epidemic to ensue.
We found screening randomly within the hospital to be an effective strategy for hospital surveillance and screening on admission to be effective at community surveillance. Additionally we found nosocomial control, brought about by effective hospital surveillance, also prevented epidemic behaviour in the community. Thus making random screening the more effective strategy overall for the parameter values chosen.
ACKNOWLEDGEMENTS
We thank Ben Cooper for helpful discussions, advice and suggestions. This work was funded by a BBSRC DTA Studentship to J.V.R.
DECLARATION OF INTEREST
None.
Footnotes
An Abstract of the research of this paper was published in the Book of Abstracts of the 45th Interscience Conference on Antimicrobial Agents and Chemotherapy, December 2000.
REFERENCES
- Anon. First report of the Department of Health’s mandatory MRSA bacteraemia surveillance scheme in acute NHS Trusts in England: April–September 2001. Communicable Disease Report Weekly. 2002;12(6) [Google Scholar]
- Anon. The third year of regional and national analyses of the Department of Health’s mandatory MRSA surveillance scheme in England: April 2001–March 2004. Communicable Disease Report Weekly. 2004;14(29) [Google Scholar]
- Cooper BS et al. Isolation measures in the hospital management of methicillin resistant Staphylococcus aureus (MRSA): systematic review of the literature. British Medical Journal. 2004;329:533. doi: 10.1136/bmj.329.7465.533. [DOI] [PMC free article] [PubMed] [Google Scholar]
- Cooper BS et al. Systematic review of isolation policies in the hospital management of methicillin-resistant Staphylococcus aureus: a review of the literature with epidemiological and economic modelling. Health Technology Assessment. 2003;7(39) doi: 10.3310/hta7390. [DOI] [PubMed] [Google Scholar]
- Ayliffe GAJ et al. Revised methicillin-resistant Staphylococcus aureus infection control guidelines for hospitals. Report of a combined working party of the British Society for Antimicrobial Chemotherapy, the Hospital Infection Society and the Infection Control Nurses Association, prepared by G. Duckworth, B. Cookson, H. Humphreys and R. Heathcock. Journal of Hospital Infection. 1998;39:253–290. doi: 10.1016/s0195-6701(98)90293-6. [DOI] [PubMed] [Google Scholar]
- Coello R et al. Risk factors for developing clinical infection with methicillin-resistant Staphylococcus aureus (MRSA) amongst hospital patients initially only colonized with MRSA. Journal of Hospital Infection. 1997;37:39–46. doi: 10.1016/s0195-6701(97)90071-2. [DOI] [PubMed] [Google Scholar]
- Cookson B. Controversies: is it time to stop searching for MRSA? (Screening is still important) British Medical Journal. 1997;314:664. doi: 10.1136/bmj.314.7081.664. [DOI] [PMC free article] [PubMed] [Google Scholar]
- Farr BM. Prevention and control of methicillin-resistant Staphylococcus aureus infections. Current Opinion in Infectious Diseases. 2004;17:317–322. doi: 10.1097/01.qco.0000136926.52673.cd. [DOI] [PubMed] [Google Scholar]
- Lepelletier D et al. Which strategies follow from the surveillance of multidrug-resistant bacteria to strengthen control of their spread? A French experience. Infection Control Hospital Epidemiology. 2004;25:162–164. doi: 10.1086/502368. [DOI] [PubMed] [Google Scholar]
- Austin DJ, Anderson RM. Transmission dynamics of epidemic methicillin-resistant Staphylococcus aureus and vancomycin-resistant enterococci in England and Wales. Journal of Infectious Diseases. 1999;179:883–891. doi: 10.1086/314682. [DOI] [PubMed] [Google Scholar]
- Austin DJ, Anderson RM. Studies of antibiotic resistance within the patient, hospitals and the community using simple mathematical models. Philosophical Transactions of the Royal Society of London, B: Biological Sciences. 1999;354:721–738. doi: 10.1098/rstb.1999.0425. [DOI] [PMC free article] [PubMed] [Google Scholar]
- Austin DJ et al. Vancomycin-resistant enterococci in intensive-care hospital settings: Transmission dynamics, persistence, and the impact of infection control programs. Proceedings of the National Academy of Sciences USA. 1999;96:6908–6913. doi: 10.1073/pnas.96.12.6908. [DOI] [PMC free article] [PubMed] [Google Scholar]
- Bonten MJM, Austin DJ, Lipsitch M. Understanding the spread of antibiotic resistant pathogens in hospitals: mathematical models as tools for control. Clinical Infectious Diseases. 2001;33:1739–1746. doi: 10.1086/323761. [DOI] [PubMed] [Google Scholar]
- Grundmann H et al. Risk factors for the transmission of MRSA in an adult intensive care unit: fitting a model to the data. Journal of Infectious Diseases. 2002;185:481–488. doi: 10.1086/338568. [DOI] [PubMed] [Google Scholar]
- Levin BR. Minimizing potential resistance: a population dynamics view. Clinical Infectious Diseases. 2001;33:S161–169. doi: 10.1086/321843. (Suppl. 3): [DOI] [PubMed] [Google Scholar]
- Lipsitch M, Bergstrom CT, Levin BR. The epidemiology of antibiotic resistance in hospitals: Paradoxes and prescriptions. Proceedings of the National Academy of Sciences USA. 2000;97:1938–1943. doi: 10.1073/pnas.97.4.1938. [DOI] [PMC free article] [PubMed] [Google Scholar]
- Sébille V, Chevret S, Valleron AJ. Modeling the spread of resistant nosocomial pathogens in an intensive-care unit. Infection Control and Hospital Epidemiology. 1997;18:84–92. doi: 10.1086/647560. [DOI] [PubMed] [Google Scholar]
- Cooper BS, Medley GF, Scott GM. Preliminary analysis of the transmission dynamics of nosocomial infections: stochastic and management effects. Journal of Hospital Infection. 1999;43:131–147. doi: 10.1053/jhin.1998.0647. [DOI] [PubMed] [Google Scholar]
- Cooper BS et al. Methicillin-resistant Staphylococcus aureus in hospitals and the community: stealth dynamics and control catastrophes. Proceedings of the National Academy of Sciences USA. 2004;101:10223–10228. doi: 10.1073/pnas.0401324101. [DOI] [PMC free article] [PubMed] [Google Scholar]
- Salgado CD, Farr BM, Calfee DP. Community-acquired methicillin-resistant Staphylococcus aureus: a meta-analysis of prevalence and risk factors. Clinical Infectious Diseases. 2003;36:131–139. doi: 10.1086/345436. [DOI] [PubMed] [Google Scholar]
- Casewell MW. New threats to the control of methicillin-resistant Staphylococcus aureus. Journal of Hospital Infection. 1996;30:465–471. doi: 10.1016/0195-6701(95)90050-0. [DOI] [PubMed] [Google Scholar]
- Chaix C et al. Control of endemic methicillin-resistant Staphylococcus aureus. A cost-benefit analysis in an intensive care unit. Journal of the American Medical Association. 1999;282:1745–1751. doi: 10.1001/jama.282.18.1745. [DOI] [PubMed] [Google Scholar]
- Papia G et al. Screening high-risk patients for methicillin-resistant Staphylococcus aureus on admission to the hospital: is it cost effective? Infection Control and Hospital Epidemiology. 1999;20:473–477. doi: 10.1086/501655. [DOI] [PubMed] [Google Scholar]
- Coello R et al. Prospective study of infection, colonization and carriage of methicillin-resistant Staphylococcus aureus in an outbreak affecting 990 patients. European Journal of Clinical Microbiology and Infectious Diseases. 1994;13:74–81. doi: 10.1007/BF02026130. [DOI] [PubMed] [Google Scholar]
- van Saene HKF et al. MRSA – time for a more pragmatic approach? Journal of Hospital Infection. 2004;56:170–174. doi: 10.1016/j.jhin.2004.01.018. [DOI] [PubMed] [Google Scholar]
- Girou E et al. Selective screening of carriers for control of methicillin-resistant Staphylococcus aureus (MRSA) in high-risk hospital areas with a high level of endemic MRSA. Clinical Infectious Diseases. 1998;27:543–550. doi: 10.1086/514695. [DOI] [PubMed] [Google Scholar]
- Girou E et al. Comparison of systematic versus selective screening for methicillin-resistant Staphylococcus aureus carriage in a high-risk dermatology ward. Infection Control and Hospital Epidemiology. 2000;21:583–587. doi: 10.1086/501807. [DOI] [PubMed] [Google Scholar]
- Blok HE et al. Role of healthcare workers in outbreaks of methicillin-resistant Staphylococcus aureus: a 10-year evaluation from a Dutch university hospital. Infection Control and Hospital Epidemiology. 2003;24:679–685. doi: 10.1086/502275. [DOI] [PubMed] [Google Scholar]
- Drinka PJ et al. Screening for methicillin-resistant Staphylococcus aureus in a nursing home. Infection Control and Hospital Epidemiology. 2004;25:95–96. doi: 10.1086/503495. [DOI] [PubMed] [Google Scholar]
- Kunori T et al. Cost-effectiveness of different MRSA screening methods. Journal of Hospital Infection. 2002;51:189–200. doi: 10.1053/jhin.2002.1247. [DOI] [PubMed] [Google Scholar]
- Smith DL et al. Persistent colonization and the spread of antibiotic resistance in nosocomial pathogens: resistance is a regional problem. Proceedings of the National Academy of Sciences USA. 2004;101:3709–3714. doi: 10.1073/pnas.0400456101. [DOI] [PMC free article] [PubMed] [Google Scholar]
- Smith DL, Levin SA, Laxminarayan R. Strategic interactions in multi-institutional epidemics of antibiotic resistance. Proceedings of the National Academy of Sciences USA. 2005;102:3153–3158. doi: 10.1073/pnas.0409523102. [DOI] [PMC free article] [PubMed] [Google Scholar]