

SUMMARY
This paper describes sentinel laboratory surveillance of hepatitis C antibody testing in England. Demographic and test result data were supplemented by follow-up questionnaires sent to the requesting clinician. Between October 2002 and September 2003 almost 75 000 anti-HCV tests were performed in eight sentinel centres. More males were tested than females and over half of those tested were aged 25–44 years. Overall 5·7% (3333/58 144, range 2·8–7·7%) individuals tested positive. Follow-up questionnaire data showed that 82% (1043/1277) of the positives had injecting drug use reported as the main risk exposure. The majority of negative individuals were undergoing routine screening as recommended for specific patient groups. Most individuals were asymptomatic. Antibody prevalence was estimated to be 34% in current injecting drug users and 42% in former injectors. Comparing positives to routine national surveillance suggests that only 53% (1782/3333) of diagnosed cases were reported. Sentinel laboratory data can provide valuable supplementary data to national surveillance.
INTRODUCTION
The hepatitis C virus (HCV) was first described in 1989 [1]. Twenty years after first infection, chronic HCV infection can lead to cirrhosis of the liver and 1–4% of cirrhotics per annum will further progress to primary liver cancer (hepatocellular carcinoma, HCC) [2, 3]. England is a low-prevalence country with an estimated 0·4% of the general population, ∼200 000 people, chronically infected with the virus [4]. Since 1992 confirmed HCV infections have been reported to the Health Protection Agency (HPA) Centre for Infections (CfI) by laboratories in England and Wales. By December 2004, 49 819 individuals had been reported to the scheme [5], but information about exposures, clinical symptoms or why the individual sought testing is not known for the majority of reports [6]. Such information is required to improve our understanding of the epidemiology of HCV infection in the United Kingdom, which will aid the targeting of testing and prevention interventions.
Pilot sentinel laboratory surveillance in 1996/1997 showed that a postal questionnaire sent to the clinician/General Practitioner (GP) who requested the anti-HCV test was both acceptable and provided risk-exposure information for the majority of cases [7]. A similar approach has been taken in France [8]. In this study, data from sentinel laboratory centres in England were collated to describe the characteristics of individuals being tested for anti-HCV between 1 October 2002 and 30 September 2003. Here we determine the reasons for testing and describe risk exposures and clinical features for both positive and negative individuals undergoing anti-HCV testing. Data have been extrapolated to estimate the prevalence of HCV in groups being tested. Matching of positive individuals to those reported to the Centre for Infections enables an investigation of the completeness of the national surveillance scheme.
METHODS
Participants
Laboratories from all NHS regions, who had previously reported to HPA CfI national surveillance of hepatitis C were encouraged to participate. The eight participating sentinel centres included four former public health laboratories and four local hospital testing laboratories, across England. The North of England (three centres including one that covers much of the North-west) and the Midlands (three centres) were well represented, with two smaller London laboratories. All eight use electronic laboratory information systems (LIS) to record test requests and results and patient information.
Data collection
A dedicated study computer in each sentinel centre identified and extracted data for all individuals tested for anti-HCV (ELISA) and HCV RNA (PCR), from the local laboratory system, in real time using generic software. Data collected within each centre included patient demographics, requesting clinician/GP name and department, freetext comments field and testing information (laboratory number, date of test, anti-HCV results, RNA results and genotype where available).
Data were cleaned and checked using Microsoft Excel (Microsoft Corporation, Seattle, WA, USA) software, and stored in a Microsoft Access database at each sentinel centre. ‘PC Anywhere’ software version 11 (Symantec Corporation, Cupertino, CA, USA) installed in each centre allowed the system to be monitored through remote access by the project coordinator in Leeds. Follow-up questionnaires were generated automatically each week, and sent to the clinician/GP who requested the test or to the microbiologist at the requesting hospital. Questionnaires were sent to individuals testing anti-HCV positive and a proportion of individuals testing negative (where no additional clinical information was supplied). The negatives were selected randomly to generate a practicable total number of follow-ups at each centre (e.g. 2/3 in smaller centres, 1/10 or 1/100 at larger centres). Data collected included reason for testing, risk factor and clinical information. A maximum of two reminders was sent to each clinician/GP.
Data collection started in a pilot site in February 2002 and was established in eight laboratories by October 2002. Data collection stopped on 30 September 2003. Periodically data were encrypted, soundex code applied (a pseudonomyized code of surname) [9], patient and clinician names removed, and sent electronically to a central database in Leeds where the data for all sites were combined. Further data quality checks were made, and then unnamed data from all sentinel sites was forwarded to HPA CfI for analysis.
Data handling
At HPA CfI, individuals were identified using a unique anonymous reference number, linked to all related test results and where available, a questionnaire. Test results were reviewed to classify each individual as anti-HCV positive (any positive result), anti-HCV negative (all tests negative or equivocal test followed by negative) or anti-HCV equivocal (all equivocal, or negative followed by equivocal). Age was calculated at date of testing and grouped into eight bands. To exclude infants with passively acquired maternal antibody, children <1 year old were identified separately. Quality-control samples and samples sent for confirmatory testing were identified and excluded. Answers to questions on follow-up questionnaires were coded on a hierarchical basis. For example, an individual with both injecting drug use (IDU) and occupational exposure was coded to IDU. (Risk hierarchy was: IDU, blood transfusion, receipt of blood products, occupational, other known risk, no risk, risk not known/not completed.) Similarly, for clinical features of liver disease, HCC was assigned first, then chronic hepatitis and/or cirrhosis, acute hepatitis, abnormal liver function, other non-liver disease, asymptomatic, not known/not completed.
Estimating exposure, clinical features and prevalence among people tested
Using the questionnaire data we calculated the proportion of individuals with each risk exposure for the positive and negative groups within each centre (excluding centre C), stratified by sex or by age group. As the questionnaires returned were a representative sample within the positive and negative groups (by age and sex), the proportions were applied to the total tested for each centre to estimate the number of individuals with each risk exposure being tested during the 12-month period. The numbers for the whole cohort tested were then obtained by summing across centres. To check sensitivity of results, centres with low response rates were excluded and the process repeated. These numbers were used to calculate the prevalence of anti-HCV among groups of people being tested. The same process was used to estimate the numbers of people with liver disease being tested and prevalence of anti-HCV among these groups. Centre C was excluded from these calculations because no questionnaires were sent to anti-HCV-negative individuals.
Matching to national surveillance data
All laboratories in England are requested to report confirmed hepatitis C infections to HPA HCV national surveillance (formerly Public Health Laboratory Service) [10]. Over 300 laboratories within England have reported HCV infections to this scheme [5]. Data on all positive individuals from this study were matched to data from the national surveillance scheme to calculate the proportion of cases testing positive in the participating laboratories during the 12-month period that had been reported to the national surveillance scheme, between January 1996 and December 2004. Individuals were matched on region, laboratory number, soundex, sex, date of birth, laboratory name, and a combination of these variables.
Statistical analysis and ethics approval
Data analysis was performed using Microsoft Access, Microsoft Excel and stata (Stata Statistical Software, release 8.1; StataCorp, College Station, TX, USA). Statistical significance was assessed using χ2 analysis where true numerators and denominators were available. Differences in estimated prevalence were assessed using survey weight in stata, to take into account the different sampling in each centre. Exact 95% confidence intervals were calculated using simulation. Ethical approval for the study was obtained from the Northern and Yorkshire Multi-Centre Research Ethics Committee (MREC1/3/76) and the Public Health Laboratory Service Ethics Committee. Additional local ethical approval, although not required, was sought where requested. Local clinicians were informed of the study prior to commencement.
RESULTS
A total of 74 265 samples were tested for anti-HCV between 1 October 2002 and 30 September 2003, of which 5338 (7·2%) samples were positive. This equates to 63 416 individuals, of whom 4643 (7·3%) were positive. On average there were 773 anti-HCV tests per month per centre, however this varied between centres, ranging from 56 to 3816. There was no marked increase or decrease in average tests per month for this period overall or by centre, and no strong seasonal trend in testing. After excluding 4490 samples (32 quality control, 4135 samples referred for confirmatory testing and 323 samples from children aged <1 year), 68 446 tests and 58 144 individuals are included in this analysis. The total number of individuals tested varied between centres; the lowest number tested was 1399 and the highest 27 547. Overall 3333/58 144 (5·7%) individuals tested positive for anti-HCV, and 119 tested equivocal. The proportion of positive individuals in each centre ranged from 2·8% to 7·7% (Table 1). Of the 58 144 individuals tested for anti-HCV, 2233 (3·8%) were also tested for HCV RNA by PCR. Of these 1251 were anti-HCV positive, of which 70·2% (878/1251) were positive for HCV RNA.
Table 1.
Numbers of people tested and positive for anti-HCV by sex and participating centre*
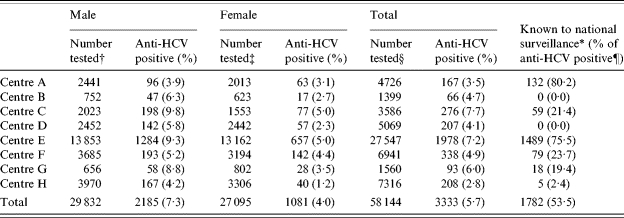
Under 1s excluded from sentinel surveillance study.
Includes 64 males with equivocal results.
Includes 53 females with equivocal results.
Includes 1217 individuals where sex not stated (two equivocal results had sex not stated).
That is the total number of anti-HCV-positive individuals identified in this study, that were known to national surveillance.
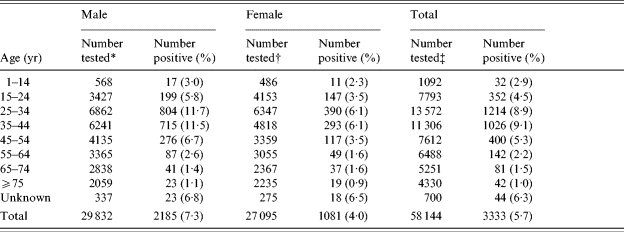
Slightly more males were tested than females and almost half of those tested were aged 25–44 years. The age distribution of males and females being tested was broadly similar and only a small number of people aged 1–14 years were tested. More males were anti-HCV positive than females and prevalence was highest among males aged 25–34 years. Only a small proportion of males and females in the older age groups were positive (Table 2).
Table 2.
Age and sex distribution of individuals tested for anti-HCV, and numbers testing positive, all centres combined
Includes 64 males with equivocal results.
Includes 53 females with equivocal results.
Includes 1217 individuals where sex not stated (two equivocal results had sex not stated).
Possible acute infections
Ten percent (6042/58 144) of individuals had two or more anti-HCV tests, of which 23 individuals had a negative anti-HCV test followed by a later positive test [10 were known to be injecting drug users (IDUs)]. The interval between tests ranged from 1 to 11 months (median 5 months). None of the individuals were tested for RNA at the same time as the first antibody test. Eight individuals were reported as concurrently testing negative for anti-HCV and positive for HCV RNA, all were aged between 29 and 39 years.
Follow-up questionnaires
Between 1 October 2002 and 30 September 2003, 4726 follow-up questionnaires were received; 1458 were for anti-HCV-positive individuals (957 male, 464 female, 37 sex not reported) and 3268 for anti-HCV-negative individuals (1616 male, 1542 female, 110 sex not reported). The response rate to the questionnaires overall was 65·5%, ranging from 31·3% to 84·5% by centre (excluding centre C) (Table 3). The age and sex breakdown of those not in receipt of a questionnaire were comparable to those who did receive a questionnaire for both negative and positive groups.
Table 3.
Number of questionnaires sent and received by centre
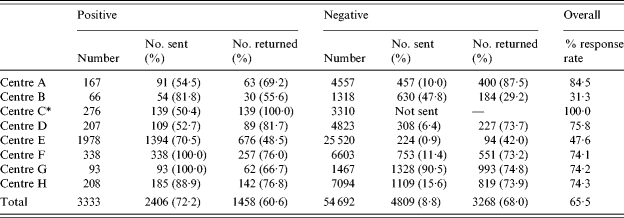
Questionnaires were not sent to individuals testing anti-HCV negative at Centre C.
The main reason for anti-HCV testing was reported for 1408 (97%) of anti-HCV positives and 3146 (96%) of anti-HCV negatives. After excluding non-response, among the anti-HCV-positive individuals the main reason for testing was risk exposure (n=994, 71%), followed by liver disease (n=185, 13%) and investigation of abnormal liver function tests (LFTs) (n=74, 5%). Routine screening (recommended as part of occupational, renal disease or fertility investigations) were reported in 155 (11%). Among the negatives, routine screening was the most commonly reported reason for testing (n=1337, 43%), followed by risk exposure (n=778, 25%), liver disease (n=574, 18%) and abnormal LFTs (n=457, 15%).
The question relating to clinical features of disease was not completed for 192 (13%) positive individuals and 649 (20%) negatives. After excluding non-response, the majority of individuals tested for anti-HCV were reported to be asymptomatic including 839 (66%) of the anti-HCV-positive individuals, and 1635 (62%) of those testing anti-HCV negative. Three positive and three negative individuals were diagnosed with HCC and a larger proportion of those testing positive had chronic hepatitis and/or cirrhosis [positive 101 (8%), negative 92 (4%)]. Over one quarter of negative (n=702, 27%) individuals were reported to have abnormal LFTs, compared to a fifth of positive (n=264, 21%) individuals.
Information on risk exposure was reported for almost 90% of the positives and 53% of the negatives. IDU was more commonly reported for anti-HCV-positive individuals, whereas occupational exposure and/or testing of health-care workers was more common amongst those without detectable HCV antibody (Table 4). Almost twice as many anti-HCV-positive individuals with IDU risk exposure were male (male:female ratio, 2·4:1). A similar ratio was seen among the negatives (male:female ratio, 1·9:1). Risk exposure among anti-HCV-positive and -negative individuals varied with age [Fig. (a) and (b)]. Almost 86% (473/552) of anti-HCV-positive people aged 25–44 years had the reported risk exposure as IDU. However, among older age groups this proportion dropped and for the majority of people aged ⩾55 years, no known risk exposure was reported. Among the negatives, the proportion of people reporting IDU was <20% in all age groups. Of the 1043 anti-HCV-positive individuals with a history of IDU, 371 (36%) were reported to be current injectors and 404 (39%) former injectors. Among the 268 injectors testing anti-HCV negative, 102 (38%) were reported as current injectors and 77 (29%) as former injectors. A total of 113 out of 1458 (8%) infections were believed to have been acquired abroad, with Pakistan (n=34) being the most commonly reported country.
Table 4.
Risk exposures reported on follow-up questionnaires of anti-HCV-positive and -negative individuals, all centres combined
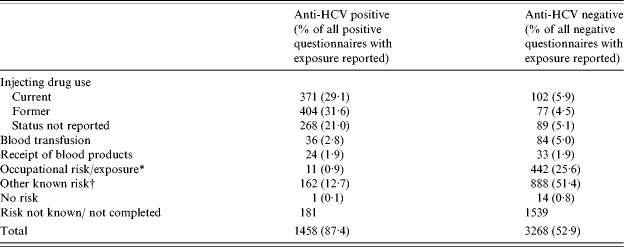
Occupational risk or exposure can relate to health-care workers that perform exposure-prone procedures undergoing routine screening or individuals who have been exposed to HCV or blood via needlestick injury. Needlestick injury was reported for 211/442 anti-HCV-negative questionnaires and 5/11 positives.
‘Other known risk’ includes patients on dialysis, individuals who have been in contact with or have a family history of injecting drug use or HCV infection, individuals with the same sex partner and/or HIV positive, where partner is known to be HCV positive or from countries of high HCV endemicity.
Fig.

Risk exposure reported on questionnaire for (a) anti-HCV-positive individuals, (b) anti-HCV-negative individuals, by age group, all centres. ■, IDU; □, blood transfusion/product;  , occupational;
  , other known risk;
  , risk unknown.
Extrapolation from the questionnaires to describe the risk exposure and clinical features of liver disease for the cohort of individuals tested for anti-HCV
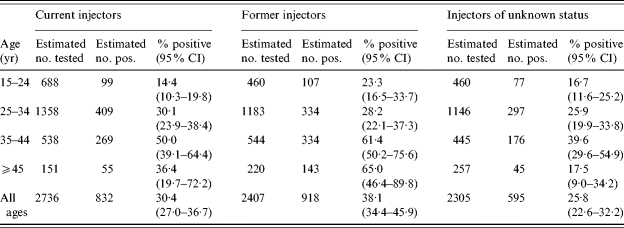
Within each centre, the proportion of anti-HCV-positive and anti-HCV-negative males and females reporting each risk exposure were calculated. For example, in centre E, 81% (353/438) of anti-HCV-positive males and 77% (166/215) of anti-HCV-positive females for whom questionnaires were returned reported the risk exposure, IDU, compared to 13% (8/61) and 3% (1/32) anti-HCV-negative males and females respectively. Extrapolating from these proportions to the 13 825 males tested in centre E we estimated that 1035 anti-HCV-positive and 1645 anti-HCV-negative males had a risk exposure of IDU. Among 13 142 females tested for anti-HCV in centre E, we estimated that 507 (77%) of the 657 positives and 390 (3%) of the 12 485 negative females had a risk of IDU. This process was repeated for each centre and summed across to give an estimate of 4759 male injectors tested at the eight centres during the 12-month period and 1810 females tested. Anti-HCV prevalence of those being tested with a history of IDU risk exposure was therefore estimated to be 32% among males and 37% among females. This difference was not found to be statistically significant (P=0·52). We estimated that 2·6 times more male IDUs were tested than females. Calculations were repeated to give an estimate that 2725 current injectors and 2399 former injectors were tested during the 12-month period. Prevalence was estimated to be 31% among current and 38% among former injectors. When centres B and E were excluded, prevalence was estimated to be lower among both current injectors (21%) and former injectors (35%), and in each age band, although the same trend was observed. Former injectors have a higher estimated prevalence in all age groups, except among 25- to 34-year-olds, compared to current injectors (Table 5), although this is not statistically different.
Table 5.
Estimated prevalence among current and former injectors, by age group
Using the same approach, among males tested we estimated 1286 (8% of 2185 positive plus 4% of 27 647 negative) had chronic hepatitis and/or cirrhosis; it was estimated that 13% of these men were anti-HCV positive. Among females we estimated that 475 (5% of 1081 positive plus 2% of 26 014 negative) had chronic hepatitis and/or cirrhosis; 11% were estimated to be anti-HCV positive. After excluding centres B and E, estimated prevalence among males with chronic hepatitis and/or cirrhosis was 7%, and among females 8%. Of the 7069 males estimated to have abnormal liver function (in the absence of chronic hepatitis, cirrhosis or HCC), 6% were estimated to be anti-HCV positive; among the estimated 5955 females this figure was 3%. Similar prevalences were seen after excluding centres B and E. Of the 13 024 people estimated to have abnormal liver function, the percent estimated to be anti-HCV positive varied by age; estimated prevalence was highest among males aged 25–34 years (16%) and roughly halved with each increasing age group. A similar pattern was seen among females although at a lower level; 10% of women aged 25–34 years reporting abnormal liver function were estimated to be anti-HCV positive.
Comparison to national surveillance data
Matching identified that 1782 (53%) anti-HCV-positive individuals from this study had also been reported to the national surveillance scheme (Table 1). There were large differences in reporting between the centres with two reporting over 75% of individuals and two reporting none to the HPA CfI. A comparison of the age-sex distribution of the positives identified in this study with the profile of patients reported to the surveillance scheme showed them to be broadly similar.
DISCUSSION
This study has demonstrated that a large number of people are being tested for hepatitis C across England each year; most of whom are testing anti-HCV negative. Many individuals are screened for anti-HCV, following recommended testing protocols for specific patient groups, including patients with chronic renal failure or on dialysis [11], undergoing fertility investigations [12] or following occupational exposure [13]. More males were tested than females and almost half of those tested during the 12-month period were aged 25–44 years. Most positive individuals were tested because they had a risk exposure for HCV and IDU was the main route of acquisition of hepatitis C infection. As expected, few individuals reported acquisition of HCV through blood transfusion or blood products [14] and very low numbers reported acquisition through sexual exposure [15]. Acute HCV infection is characterized by a mild or asymptomatic clinical picture. Although the number of acute infections identified through testing was small, the majority of those identified occurred in IDUs. The responses to the postal questionnaires confirm that risk exposure history is known by the clinicians of the majority of individuals being tested for anti-HCV, particularly those testing positive. Among older individuals with HCV infection risk exposures were less likely to be known or reported, possibly because exposure may have occurred many years before testing; thus drug use [16] or blood transfusion [17] may not be discovered or disclosed. It is, therefore, important that clinicians have careful discussions with older individuals who test anti-HCV positive.
Response rates to the questionnaires overall were good (66%), however, there was variation between centres (range 30–85%, excluding centre C). The lowest response rate was due to technical difficulties that meant a large number of questionnaires were posted retrospectively combined with staff changes that prevented complete follow-up (centre B). The centre with the largest number of positives (centre E) also experienced a lower response rate (48%) because some local hospital sites did not return any questionnaires, possibly due to the large volume.
This study estimates that the prevalence among IDUs of all age groups being tested for anti-HCV was not statistically different among females and males (37% and 32% respectively), although many more male IDUs were tested. This may be due to chance, a result of the smaller number of questionnaires received for females or because the smaller number of females being tested were more likely to be anti-HCV positive. Despite this, estimated prevalence is similar to the prevalence of infection among IDUs tested in the Unlinked Anonymous Prevalence Monitoring Programme injecting drug user survey [18] and suggests that the method used to extrapolate prevalence among the group tested is fairly reliable. As risk exposure was not as well reported among people testing anti-HCV negative, it is possible that we may have under- or over-estimated the numbers tested and therefore the prevalence in some risk groups also. The degree of inaccuracy is hard to calculate, as there are few reports of risk exposures among people testing anti-HCV negative, however, under-reporting of risk exposures among individuals testing negative would lead to smaller estimated prevalence. It is of interest that in the present study a higher proportion of IDUs were reported as former injectors, than current injectors. Overall, former injectors had a higher prevalence than current injectors, which may be because former injectors had been repeatedly exposed to HCV due to a longer injecting career, in comparison to recent initiates or current injectors. The slightly higher estimated prevalence among current IDUs aged 25–34 years, compared to former injectors, is likely to be a chance finding, however, it may reflect a recent increase in transmission of HCV among younger drug users [18–20]. Excluding centres with low or non-response to the questionnaires led to a decrease in estimated prevalence, indicating that the estimation process is sensitive to response rates, however, prevalence remained higher among former injectors compared to current injectors. It has been suggested that former injectors are more likely to be able to access and comply with treatment for HCV than individuals still injecting drugs [21] and former injectors are therefore targeted for testing in the HCV strategy [22]. This study confirms that such individuals are accessing testing at a variety of sites, although the total number of those at risk remains unclear [23].
The majority of people undergoing testing were asymptomatic and it was estimated that only 3% of the individuals tested were known to have chronic hepatitis and/or cirrhosis. Only a minority of individuals being investigated for such conditions at the participating centres were HCV infected.
Every individual newly diagnosed with HCV should be reported to the national hepatitis C surveillance scheme. Matching study data to the national surveillance database identified that only half of the cases tested in the eight sentinel sites during the 12-month period had been reported. The matching process may have missed some individuals, or some individuals tested in this period may have been previously reported from other laboratories. Investigation revealed that one centre had chosen not to report any infections because of uncertainty about case definitions; this centre will now report all HCV infections. For four centres problems with the electronic reporting mechanism during the 12 months under study meant that few or no HCV cases had been reported. Problems at two centres have since been rectified and the remaining centres are currently under investigation. Reporting to national surveillance should therefore have improved since October 2003 and further checks will be made as the study continues. As the eight participating centres have incomplete geographical coverage, we did not extrapolate this level of under-reporting to the whole of England. Risk-factor information was available for the vast majority of cases in this study, compared to only 29% in national surveillance [5]. To improve both the completeness of ascertainment and of risk-factor information for national surveillance more sites are being recruited into the study.
The electronic extraction of routine laboratory data used in this study was minimally intrusive and provided rapid and timely surveillance of a large number of people being tested for anti-HCV. ‘PC Anywhere’ software enabled remote access for monitoring the progression of the study, data collection and problem solving. The project administrator, assisted by local staff, ran regular data quality checks to reduce data errors and remove duplicates. The identification of a few individuals with unusual test results suggests that some individuals included in this analysis may have tested false positive, or false negative, however, this will have had minimal impact upon the study findings. Some incident infections have been identified and, as the study continues, the ability to identify seroconversions will increase. This will provide valuable data on the incidence of infection and current routes of acquisition in the general population. Trends in the uptake in testing or changes to the profile of individuals being tested following the implementation of the HCV Action Plan [4] should also be identified. Surveillance of laboratory testing, supplemented by questionnaires to all anti-HCV-positive individuals, appears to be an appropriate method for monitoring HCV infection in the United Kingdom, and by increasing the number of sentinel sites the information is likely to be generalizable to the whole of England.
ACKNOWLEDGEMENTS
We thank all the administrators at each sentinel site: Ghislaine King (Newcastle), Eddie Cryer (Manchester), Claire Hayes-Gill (Nottingham), Lisa Marley (Birmingham), Jean Carroll (North Middlesex) and Aziza Begum (Ealing). Thanks are due to all the clinicians and GPs who completed the questionnaires. We also thank Nick Andrews, HPA Centre for Infections Colindale, for his statistical help, and the referees for their helpful insights. This study was funded by the Department of Health.
DECLARATION OF INTEREST
None.
REFERENCES
- 1.Choo QL et al. Isolation of a cDNA clone derived from a blood-borne non-A, non-B viral hepatitis Genome. Science. 1989;244:359–362. doi: 10.1126/science.2523562. [DOI] [PubMed] [Google Scholar]
- 2.Seeff LB, Hoofnagle JH. Appendix: The National Institutes of Health Consensus Development Conference Management of Hepatitis C 2002. Clinics in Liver Disease. 2003;7:261–287. doi: 10.1016/s1089-3261(02)00078-8. [DOI] [PubMed] [Google Scholar]
- 3.Booth JC, O’Grady J, Neuberger J. Clinical guidelines on the management of hepatitis C. Gut. 2001;49:I1–21. doi: 10.1136/gut.49.suppl_1.I1. [DOI] [PMC free article] [PubMed] [Google Scholar]
- 4.Department of Health. 2004.
- 5.Gungabissoon U, Balogun MA, Ramsay ME. Hepatitis C virus: laboratory surveillance in England and Wales 1992–2004. Epidemiology and Infection. doi: 10.1017/S0950268806007138. [DOI] [PMC free article] [PubMed] [Google Scholar]
- 6.Ramsay ME et al. Laboratory surveillance of hepatitis C virus infection in England and Wales: 1992 to 1996. Communicable Disease and Public Health. 1998;1:89–94. [PubMed] [Google Scholar]
- 7.Balogun MA et al. Risk factors, clinical features and genotype distribution of diagnosed hepatitis C virus infections: a pilot for a sentinel laboratory-based surveillance. Communicable Disease and Public Health. 2003;6:34–39. [PubMed] [Google Scholar]
- 8.Meffre C et al. Surveillance of screening for hepatitis C through the Laboratory Network RENA-VHC, France, 2000–2001. Eurosurveillance. 2003;8:101–107. doi: 10.2807/esm.08.05.00410-en. [DOI] [PubMed] [Google Scholar]
- 9.Mortimer JY, Salathiel JA. ‘Soundex’ codes of surnames provide confidentiality and accuracy in a national HIV database. Communicable Disease Report. CDR Review. 1995;5:R183–R186. [PubMed] [Google Scholar]
- 10.Public Health Laboratory Service. 2001. www.hpa.org.uk/infections/about/surveillance/cdsc_reporting_doc.pdf www.hpa.org.uk/infections/about/surveillance/cdsc_reporting_doc.pdf
- 11.Department of Health. 2002.
- 12.National Institute for Clinical Excellence. Fertility: assessment and treatment for people with fertility problems. London: National Institute for Clinical Excellence; 2004. [Google Scholar]
- 13.Expert Advisory Group on AIDS and the Advisory Group on Hepatitis. UK Health Departments. Recommendations of the Expert Advisory Group on AIDS and the Advisory Group on Hepatitis; 1998. [Google Scholar]
- 14.Soldan K et al. The contribution of transfusion to HCV Infection in England. Epidemiology and Infection. 2002;129:587–591. doi: 10.1017/s0950268802007744. [DOI] [PMC free article] [PubMed] [Google Scholar]
- 15.Balogun MA et al. A national survey of genitourinary medicine clinic attenders provides little evidence of sexual transmission of hepatitis C virus infection. Sexually Transmitted Infections. 2003;79:301–306. doi: 10.1136/sti.79.4.301. [DOI] [PMC free article] [PubMed] [Google Scholar]
- 16.Friedman SR, Jose B. Hepatitis C transmission and the underreporting of stigmatized behaviours. Sexually Transmitted Diseases. 1998;25:220–221. doi: 10.1097/00007435-199804000-00010. [DOI] [PubMed] [Google Scholar]
- 17.Buffington J et al. Lack of Awareness of hepatitis C risk among persons who received blood transfusions before 1990. American Journal of Public Health. 2001;91:47–48. doi: 10.2105/ajph.91.1.47. [DOI] [PMC free article] [PubMed] [Google Scholar]
- 18.Health Protection Agency, SCIEH, National Public Health Service for Wales, CDSC Northern Ireland, CRDHB, and UASSG. Shooting up; infections among injecting drug users in the United Kingdom 2003. London: Health Protection Agency; 2004. [Google Scholar]
- 19.Judd A et al. Incidence of hepatitis C virus and HIV among new injecting drug users in London: Prospective Cohort Study. British Medical Journal. 2004;330:24–25. doi: 10.1136/bmj.38286.841227.7C. [DOI] [PMC free article] [PubMed] [Google Scholar]
- 20.Judd A et al. Prevalence of, and risk factors for, hepatitis C virus infection among recent initiates to injecting in London and Glasgow: cross sectional analysis. Journal of Viral Hepatitis. 2005;12:655–662. doi: 10.1111/j.1365-2893.2005.00643.x. [DOI] [PubMed] [Google Scholar]
- 21.Goldberg D, Anderson E. Hepatitis C: who is at risk and how do we identify them. Journal of Viral Hepatitis. 2004;11:12–18. doi: 10.1111/j.1365-2893.2004.00570.x. [DOI] [PubMed] [Google Scholar]
- 22.Department of Health. Hepatitis C: strategy for England. Department of Health; 2002. [Google Scholar]
- 23.Bird SM, Goldberg DJ, Hutchinson SJ. Projecting severe sequelae of injection-related hepatitis C virus epidemic in the UK. Journal of Epidemiology and Biostatistics. 2001;6:243–265. [PubMed] [Google Scholar]