SUMMARY
We report attack rates and contact-related predictors among community contacts of severe acute respiratory syndrome (SARS) cases from the 2003 Toronto-area outbreak. Community contact data was extracted from public health records for single, well-defined exposures to a SARS case. In total, 8662 community-acquired exposures resulted in 61 probable cases; a crude attack rate of 0·70% [95% confidence interval (CI) 0·54–0·90]. Persons aged 55–69 years were at higher risk of acquiring SARS (1·14%) than those either younger (0·60%) or older (0·70%). In multivariable analysis exposures for at least 30 min at a distance of ⩽1 m increased the likelihood of becoming a SARS case 20·4-fold (95% CI 11·8–35·1). Risk related to duration of illness in the source case at time of exposure was greatest for illness duration of 7–10 days (rate ratio 3·4, 95% CI 1·9–6·1). Longer and closer proximity exposures incurred the highest rate of disease. Separate measures of time and distance from source cases should be added to minimum datasets for the assessment of interventions for SARS and other emerging diseases.
INTRODUCTION
Severe acute respiratory syndrome (SARS) cases were reported in 32 countries worldwide over the winter and spring of 2003. Outside of Asia, the highest number of SARS cases was reported in Ontario, Canada [1]. Almost all of them were in the Greater Toronto Area [2]. Health-care workers, other persons who provided care to SARS cases and in-patients were at highest risk for SARS [1, 3]. However, the rate of SARS transmission to other community members and the particular circumstances in which community transmission occurs are not well described. We report the attack rate among those community contacts of SARS cases from the 2003 Greater Toronto Area outbreak who incurred clearly defined non-overlapping exposures. We also assess contact-related factors for becoming a probable case.
METHODS
We extracted data from public health records of the three local health units of the City of Toronto and adjacent municipalities of York and Peel, hereinafter referred to as the Greater Toronto Area (GTA). These health units dealt with 90% of the SARS cases and 95% of identified SARS contacts in the Ontario outbreak. The study was approved by the participating health units and by the Health Sciences I Research Ethics Committee of the University of Toronto.
As potential SARS cases were reported to the local public health units, their contacts were identified and reached (usually by telephone) for assessment of exposure, symptoms, and directions regarding quarantine. Contacts were quarantined at home and assessed regularly by telephone by public health staff. A description of the tracking and follow-up of contacts has been previously published [4].
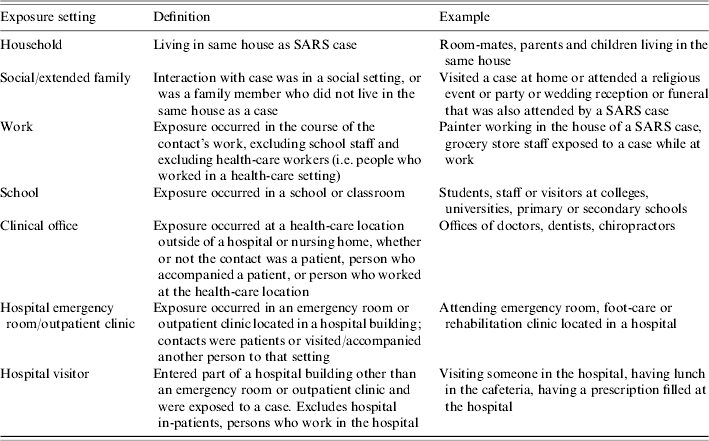
We reviewed the existing paper and electronic public health records of cases (all individuals investigated as potential cases) and contacts. These records, created at the time of the outbreak, included gender, age, the nature and date(s) of exposures, date of symptom onset for the source case (from which duration of source-case illness at the time the contact was exposed was calculated), and dates and outcomes of public health follow-up. The records were coded for level of contact (Table 1) and exposure setting (Table 2). The level of contact categories were based on an index initially piloted at Toronto Public Health during the later part of the outbreak. Contacts were classified into mutually exclusive and exhaustive categories according to the information available at the time of their initial identification. Where there was uncertainty, contacts were coded to the less-close level of contact. Final case status for individuals investigated as potential SARS was according to the case review conducted post-outbreak by all health units, using the 29 May 2003 Health Canada case definitions (probable, suspect, or not meeting case definition). Community contacts were defined as persons who were exposed in settings such as households, workplaces, social/religious gatherings, schools, visiting a friend/relative in hospital, or while at a physicians' office, outpatient clinic or emergency department. Persons exposed as a result of being in-patients or workers in hospitals were excluded from the present study, as were contacts exposed during international travel. After coding, the six relational databases (i.e. case and contact sets for three health units) were merged using unique personal identifiers. Contacts were linked to their source case(s). After removal of duplicate records and data cleaning, the dataset comprised 30 920 community contacts. It also included all suspect and probable source and secondary cases. From this dataset, we excluded 22 080 contacts that were exposed to multiple source cases simultaneously or in overlapping exposures. The remaining 8840 community contacts were able to be linked to a single source case in a well-defined non-overlapping exposure. Exposures (of the same person) separated by ⩾10 days (the majority of SARS cases have an incubation period of <10 days) were retained. A further 178 contacts were excluded because of missing data for exposure setting or level of contact, leaving 8662 community contacts for the present analysis. The Ontario outbreak occurred in two phases starting on 23 February 2003. Contacts whose last exposure date was between 23 February 2003 and 22 May 2003 (the day before the second phase of the outbreak was detected), were classified as Phase I contacts. Contacts in Phase II were exposed between detection of the second outbreak and two incubation periods (20 days) after the last case was placed in isolation (23 May 2003 to 2 July 2003).
Table 1.
Definitions of level of contact
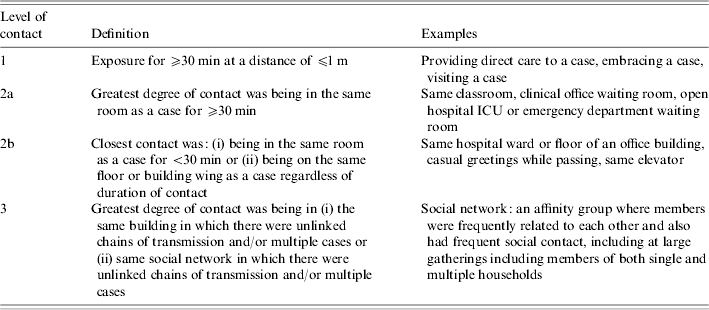
Table 2.
Definitions of exposure settings
Statistical analyses
Age, gender, and duration of source-case illness were missing for 1617 (18·7%), 437 (5·0%), and 487 (5·6%) respectively of the 8662 contacts. Rather than excluding them, we imputed age and gender using Hot-Deck Imputation [5] in the software package solas 3.0 [6]. This method of imputation sorted respondents and non-respondents into imputation subsets according to a specified set of demographic factors. An imputation subset comprised of subjects with the same values for all of the specified factors. Missing values were then replaced with values taken from matching respondents. A matching respondent was a subject who was identical to a non-respondent with respect to the values of the specified factors. If there was more than one matching respondent for any particular non-respondent, then the respondent's value was randomly selected from within the imputation subset. If a matching respondent did not exist in the initial imputation attempt, the subset was collapsed by one level starting with the last factor selected as a sort variable, or until a match could be found. We used the following four factors as sort variables (in order): outbreak phase, health unit, level of contact, and setting type.
The remaining statistical analyses were carried out using the software package SAS 8.2 [7]. Univariate analyses consisted of frequency distributions of contacts by age, gender, exposure setting, level of contact, duration of source-case illness, phase of outbreak, as well as attack rates corresponding to each of these factors. χ2 tests were used to assess the statistical significance of the relationships between occurrence of infection and the factors. In addition, the distribution of attack rates by age was summarized graphically using 10-year moving averages (an attack rate was calculated incrementally for each 10-year age group). In a similar manner, the distribution of attack rates by duration of source-case illness was summarized graphically using 2-day moving averages (an attack rate was calculated incrementally for each 2-day duration group). Multivariable logistic regression was used to assess the relationships after adjusting for potential confounders. A variable was considered to be a confounder if the ratio of two relative rates was 1·15 times or greater [8]. Receiver operating characteristic (ROC) methodology was used to assess the accuracy of the multivariable logistic regression model to predict a contact becoming a probable case by computing the area under the ROC curve [9, 10]. Values of the area ranged from 0·5 to 1·0, indicating the lowest to highest degree of accuracy, respectively. The corrected-group-prognosis method was used to compute adjusted attack rates [11]. To assess the effect of imputation, the above-mentioned analyses were repeated by excluding contacts with missing age, gender, or duration of source-case illness. Because the patterns of attack rates were similar and overall conclusions were unchanged between the two sets of analyses, we opted to report the results only from the imputed dataset in this paper.
RESULTS
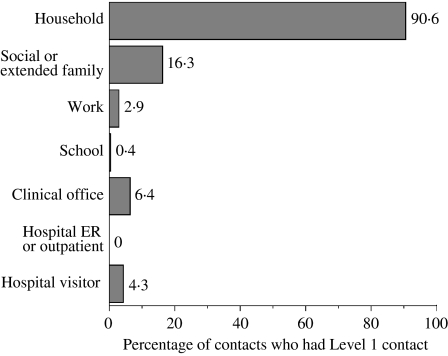
There was an approximately equal distribution of male and female contacts, and the majority were between the ages of 18 and 69 years (Table 3). Only 647 (7·5%) of contacts were classified as having ‘Level 1’ exposures – i.e. exposure for at least 30 min at a distance of ⩽1 m. The largest proportion of contacts were among persons for whom the greatest degree of contact was being in the same room as a case for ⩾30 min (i.e. Level 2a). Household settings had the largest percentage of Level 1 exposures (Fig. 1), followed by social or extended family settings.
Table 3.
Distribution of discrete factors and univariate estimates of attack rates
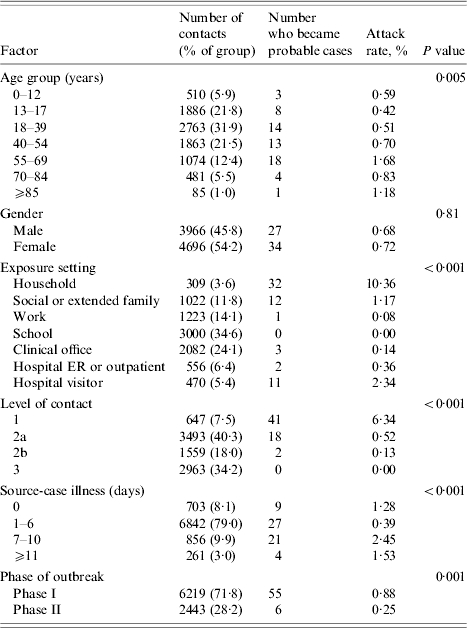
Fig. 1.
Percentage of contacts who had Level 1 contact by type of setting.
Attack rates
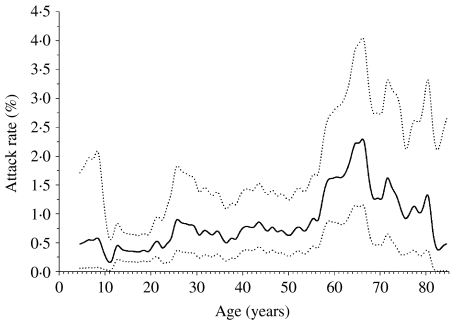
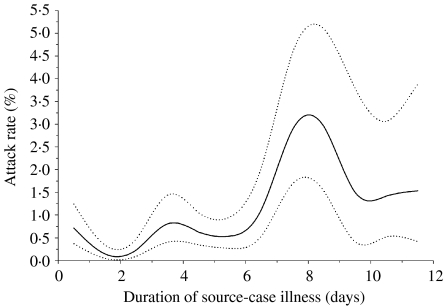
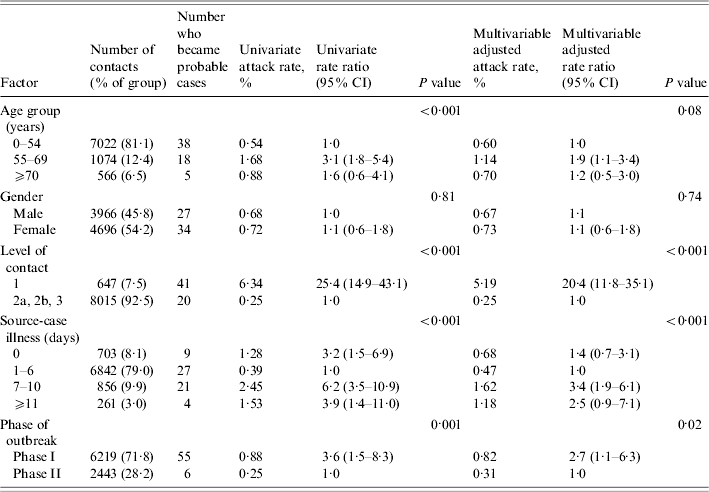
A total of 61 persons became probable and eight became suspect cases as a result of the 8662 community exposures, yielding a crude attack rate (probable cases) of 0·70% (95% CI 0·54–0·90%). The attack rates were higher for those aged ⩾55 years compared to younger persons (Fig. 2). Attack rates by duration of source-case illness are displayed in Figure 3. Phase of outbreak, level of contact, duration of source-case illness, and exposure setting were all significant factors for becoming a case in univariate analysis, while gender was not (Table 3). Analyses in Table 3 were repeated using both probable and suspect cases as the outcome and because the findings were very similar only the results from the probable cases are reported. From a multivariable analysis of the data (adjusting for all factors listed in Table 3) the pattern of results remained unchanged, although the rate ratios were attenuated towards the null, indicating the presence of confounding (Table 4). Although there was still an age effect, it was no longer statistically significant. Attack rates were higher in Phase I than in Phase II of the outbreak (0·82% vs. 0·31%, P value=0·02). The highest attack rate by level of contact occurred among those who had a Level 1 exposure (5·19% vs. 0·25%, P<0·001). Exposure setting was not included in the multivariable analysis because of its high correlation with level of contact, leading to problems with multicollinearity. Nonetheless, from univariate analyses, the exposure setting with the highest attack rate was households (10·36%), followed by hospital visitor (2·34%), then by social or extended family (1·17%). The attack rates for the remaining exposure settings were all below 0·5% (Table 3). For the multivariable analysis, the area under the ROC curve was 0·89 (95% CI 0·84–0·92), indicating a high level of accuracy of the model to predict a contact becoming a case. The accuracy of this model was higher than for the model that used exposure setting instead of level of contact, which yielded an area under the ROC curve of 0·86 (95% CI 0·81–0·90). This implies that level of contact was a more accurate predictor of a contact to become a case than exposure setting. To facilitate more direct comparisons with the literature, we examined age-specific attack rates among household members (n=309). Among those aged 0–54 years, the attack rate was 9·36% compared to 15·09% among those aged 55–69 years, and 9·52%, for those aged ⩾70 years.
Fig. 2.
Smoothed 10-year moving average attack rates (—) and 95% confidence bands (· · · · · ·) by age.
Fig. 3.
Smoothed 2-day moving average attack rates (—) and 95% confidence bands (· · · · · ·) by duration of source-case illness.
Table 4.
Distribution of factors and univariate and multivariable estimates of attack rates and rate ratios
Interpretation
Our study is the first to report the relationship between level of exposure (distance and time) and attack rate among community contacts of probable SARS cases, after considering the effects of other factors. Exposure for ⩾30 min at a distance of ⩽1 m was the strongest risk factor, regardless of age, gender or duration of source-case illness at time of exposure. Level of contact was very strongly associated with exposure setting. Among persons in household settings, 90·6% had Level 1 contact. This finding indicates the nature of the key questions that should be asked of all contacts, and provides useful prognostic information.
There are few data in the literature regarding SARS attack rates among community contacts. Several authors [12–15] have examined risk factors in terms of the relationship (e.g. spouse) of the contact to source case, being a caregiver for a source case, and/or the exposure setting (e.g. household). However, not all studies used multivariable analyses to assess the relative importance of risk factors [12, 13]. Comparisons between studies are difficult because of differences in quarantine methods, and differences in categorization of exposures. From our univariate analyses, we observed that the highest attack rates were among persons who were exposed in a household setting, lower attack rates among hospital visitors, and very low attack rates among work or school contacts, a similar pattern to that observed elsewhere [12].
Gender was not a factor for the acquisition of SARS in our study, consistent with others [14]. Our findings with respect to age resemble those from Beijing [12]. In the Singapore household contact study age was not a risk factor for transmission [14], although the sample was small and there was limited power for that analysis. It is possible that age may be a marker for some other attribute, such as the probability of becoming symptomatic after infection [12]. A few serological studies have examined the occurrence of subclinical/asymptomatic disease. One study [16] found that cases of ‘pneumonic’ SARS did not differ in age from asymptomatic cases. Other investigators have found that the occurrence of subclinical disease was very low and have lacked the power to test for an association between age and the likelihood of developing symptomatic disease [17–21].
In our study, attack rates were lower in Phase II than in Phase I. In the initial stages of the outbreak, SARS was all but unknown. By Phase II, knowledge about control measures had greatly advanced and an infrastructure was available to rapidly implement them. It is also possible that SARS coronavirus may have become inherently less transmissible over the period or that transmissibility was influenced by seasonal effects.
In the published literature on SARS there is no consistent set of variables or definitions for the ascertainment of exposures. Measures that are used tap into mixed constructs (e.g. our Level 1 exposure includes both time and distance criteria). A minimum dataset for SARS has been proposed [22], to support assessment of reproduction rate, case status and outcomes. It expands on the minimum reporting requirements of the World Health Organization [23] to include limited information on exposures to a putative source case. It includes limited information on duration and locale (setting) of exposures. If the recommended data are collected on both cases and contacts, and are then linked together, one is able to estimate the duration of illness in the source case at the time when contacts are exposed. However, it does not include any ‘distance’ measures other than a description of the exposure. We recommend that a simple distance measure such as we used be added to this minimum dataset as it has proven useful in the characterization of transmission risk and (elsewhere), mode of transmission [24]. A composite index consisting of time, distance and setting variables could then be constructed from the description and the duration, distance and setting measures. Settings are useful for outbreak investigators to use as a starting point for making lists of contacts. They may also help investigators to set priorities for contact tracing [25]. However, data on time and distance are also needed, as noted by the CDC: ‘In large indoor settings, because of diffusion and local circulation patterns, the degree of proximity between contacts and the index patient can influence the likelihood of transmission’ [25]. Time and distance measures are needed to be able to operationally define the cut-points for the concentric circles of contact investigation in an outbreak. For newly emerging infections, this information may also help to distinguish between airborne vs. droplet spread; information that is critical to direct control measures.
Our study is limited by the nature of the available data. Our definitions for level of exposure were specific to the outbreak in the GTA and their utility may be less in other settings. Because the clinical case definition of SARS is non-specific, it is possible that ‘close’ contacts were more likely to be classified as being SARS than others. Some additional variables of interest (e.g. the health status of contacts) were not available, and our definition of ‘community contact’ may have included caregivers of some cases. In order to calculate accurate attack rates, our analysis focused on exposure to single cases with well-defined exposures. In practice, some settings often involved overlapping exposures to multiple cases and many hospital-visitor contacts were excluded because of this. Attack rates for persons with multiple and ill-defined exposures might differ from those with single, well-defined exposure episodes. The attack rates given here represent close exposure to an identifiable case. The risk to the general hospital visitor is much lower.
CONCLUSION
The important factors for becoming a probable case included level of exposure, age, duration of source-case illness, and phase of outbreak. Among community contacts in the GTA SARS outbreak of 2003, the crude attack rate was very low: 0·70%. We recommend that a simple distance measure for the characterization of exposures should be included in a minimum dataset for evaluation of SARS interventions and for other emerging infectious diseases.
ACKNOWLEDGEMENT
The study was funded by the Ontario Ministry of Health and Long Term Care. Dr Eliasziw is supported by a Senior Health Scholar Award from the Alberta Heritage Foundation for Medical Research.
DECLARATION OF INTEREST
None.
REFERENCES
- 1.World Health Organization http://www.who.int/csr/sars/country/table2004_04_21/en/print.html. 2005. http://www.who.int/csr/sars/country/table2004_04_21/en/print.html . Summary of probable SARS cases with onset of illness from 1 November 2002 to 31 July 2003 ( ). Accessed 3 December .
- 2.Public Health Agency of Canada http://www.phac-aspc.gc.ca/sars-sras/cn-cc/20030903_e.html. 2005. http://www.phac-aspc.gc.ca/sars-sras/cn-cc/20030903_e.html . Canadian SARS numbers, September 3, 2003 ( ). Accessed 3 December .
- 3.Ou J et al. Efficiency of quarantine during an epidemic of severe acute respiratory syndrome: Beijing, China, 2003. Morbidity and Mortality Weekly Report. 2003;52:1037–1040. [PubMed] [Google Scholar]
- 4.Svoboda T et al. Public health measures to control the spread of the severe acute respiratory syndrome during the outbreak in Toronto. New England Journal of Medicine. 2004;350:2352–2361. doi: 10.1056/NEJMoa032111. [DOI] [PubMed] [Google Scholar]
- 5.Little RJA, Rubin DB. Statistical Aanalysis with Missing Data. 2nd edn. New York: Wiley; 2002. [Google Scholar]
- 6.SOLAS 3.0. Statistical Solutions Ltd; 2001. , Saugus, MA, USA, [Google Scholar]
- 7.SAS 8.2. SAS Institute Inc.; 2001. , Cary, NC, USA, [Google Scholar]
- 8.Maldonado G, Greenland S. Simulation study of confounder-selection strategies. American Journal of Epidemiology. 1993;138:923–936. doi: 10.1093/oxfordjournals.aje.a116813. [DOI] [PubMed] [Google Scholar]
- 9.Erdreich LS, Lee ET. Use of relative operating characteristic analysis in epidemiology. A method for dealing with subjective judgement. American Journal of Epidemiology. 1981;114:649–662. doi: 10.1093/oxfordjournals.aje.a113236. [DOI] [PubMed] [Google Scholar]
- 10.Metz CE. ROC methodology in radiologic imaging. Investigative Radiology. 1986;21:720–733. doi: 10.1097/00004424-198609000-00009. [DOI] [PubMed] [Google Scholar]
- 11.Nieto FJ, Coresh J. Adjusting survival curves for confounders: a review and a new method. American Journal of Epidemiology. 1996;143:1059–1068. doi: 10.1093/oxfordjournals.aje.a008670. [DOI] [PubMed] [Google Scholar]
- 12.Pang X et al. Evaluation of control measures implemented in the Severe Acute Respiratory Syndrome outbreak in Beijing, 2003. Journal of the American Medical Association. 2003;290:3215–3221. doi: 10.1001/jama.290.24.3215. [DOI] [PubMed] [Google Scholar]
- 13.Lee ML et al. Use of quarantine to prevent transmission of Severe Acute Respiratory Syndrome – Taiwan, 2003. Morbidity and Mortality Weekly Report. 2003;52:680–683. [PubMed] [Google Scholar]
- 14.Goh DL et al. Secondary household transmission of SARS, Singapore. Emerging Infectious Diseases. 2004;10:232–234. doi: 10.3201/eid1002.030676. [DOI] [PMC free article] [PubMed] [Google Scholar]
- 15.Lau JTF et al. Probable secondary infections in households of SARS patients in Hong Kong. Emerging Infectious Diseases. 2004;10:235–243. doi: 10.3201/eid1002.030626. [DOI] [PMC free article] [PubMed] [Google Scholar]
- 16.Wilder-Smith A et al. Asymptomatic SARS coronavirus infection among healthcare workers, Singapore. Emerging Infectious Diseases. 2005;11:1142–1145. doi: 10.3201/eid1107.041165. [DOI] [PMC free article] [PubMed] [Google Scholar]
- 17.Ip M et al. Seroprevalence of antibody to severe acute respiratory Syndrome (SARS)-associated coronavirus among health care workers in SARS and non-SARS medical wards. Clinical Infectious Diseases. 2003;38:e116–118. doi: 10.1086/421019. [DOI] [PMC free article] [PubMed] [Google Scholar]
- 18.Chow PK et al. Healthcare worker seroconversion in SARS outbreak. Emerging Infectious Diseases. 2004;10:249–250. doi: 10.3201/eid1002.030397. [DOI] [PMC free article] [PubMed] [Google Scholar]
- 19.Le DH et al. Lack of SARS transmission among public hospital workers, Vietnam. Emerging Infectious Diseases. 2004;10:265–268. doi: 10.3201/eid1002.030707. [DOI] [PMC free article] [PubMed] [Google Scholar]
- 20.Ho HT et al. Colonization of severe acute respiratory syndrome-associated coronavirus among health-care workers screened by nasopharyngeal swab. Chest. 2006;129:95–101. doi: 10.1378/chest.129.1.95. [DOI] [PMC free article] [PubMed] [Google Scholar]
- 21.Lai TS et al. Low prevalence of subclinical severe acute respiratory syndrome-associated coronavirus infection among hospital healthcare workers in Hong Kong. Scandinavian Journal of Infectious Diseases. 2005;37:500–503. doi: 10.1080/00365540510033645. [DOI] [PubMed] [Google Scholar]
- 22.Scott RD, Gregg E, Meltzer MI. Collecting data to assess SARS interventions. Emerging Infectious Diseases. 2004;10:1290–1292. doi: 10.3201/eid1007.030749. [DOI] [PMC free article] [PubMed] [Google Scholar]
- 23.WHO. Global surveillance for severe acute respiratory syndrome (SARS) Weekly Epidemiological Record. 2003;78:100–110. [PubMed] [Google Scholar]
- 24.Wong TW et al. Outbreak Study Group. Cluster of SARS among medical students exposed to single patient, Hong Kong. Emerging Infectious Diseases. 2004;10:269–276. doi: 10.3201/eid1002.030452. [DOI] [PMC free article] [PubMed] [Google Scholar]
- 25.Centers for Disease Control and Prevention. Guidelines for the investigation of contacts of persons with infectious tuberculosis; recommendations from the National Tuberculosis Controllers Association and CDC. Morbidity and Mortality Weekly Report. 2005;54:1–47. [PubMed] [Google Scholar]


