Summary
Background
Clinical research in Parkinson’s disease (PD) has increasingly focused on the development of interventions to slow the underlying neurodegenerative process. These efforts have stimulated interest in objective biomarkers to measure changes in the rate of disease progression with treatment. Radiotracer-based imaging of nigrostriatal dopaminergic function has given rise to a specific class of progression biomarkers that has been used in clinical trials of potential disease-modifying agents. However, in some of these studies, discordance was revealed between the imaging outcome measures and blinded clinical ratings of disease severity. Ongoing research is being conducted to identify and validate alternative imaging approaches using brain metabolism to assess the efficacy of new therapies for PD and related disorders.
Recent Developments
Over the past several years, spatial covariance analysis has been used with 18F-fluorodeoxyglucose (FDG) PET to detect abnormal patterns of brain metabolism in patients with neurodegenerative disorders. Rapid, automated voxel-based algorithms have recently been introduced for use with metabolic imaging to quantify the activity of disease-specific networks in individual subjects. This approach has facilitated the characterization of unique metabolic patterns associated with the motor and cognitive features of PD. In the past year, several studies have appeared showing correction of abnormal motor, but not cognitive, network activity by treatment with dopaminergic therapy and deep brain stimulation (DBS). A recent longitudinal imaging study of early stage PD revealed significant differences in the evolution of these metabolic networks over four years of follow-up.
Where Next?
The recent developments in network imaging have created the basis for several new applications of metabolic imaging in the study of parkinsonism. A washout study is currently being conducted to determine the long-duration effects of dopaminergic therapy on PD-related network activity. This information will be useful in the planning of future trials of disease modifying agents. Network approaches are also being applied to the study of atypical parkinsonian syndromes. The characterization of specific patterns associated with these conditions, in addition to classical PD, will create the basis for a fully automated imaging-based procedure for the early differential diagnosis of individual patients. Lastly, efforts are underway to quantify PD-related networks using less invasive imaging methods. Assessments of network activity with perfusion-weighted MRI show excellent concordance with measurements conducted using established radiotracer techniques. This approach will ultimately allow for the evaluation of abnormal network activity in cohorts of individuals at risk for developing PD on a genetic basis.
Progression Biomarkers in Parkinson’s Disease
The need for accurate and comprehensive descriptions of the natural history of Parkinson’s disease (PD) has become increasingly important as new therapies for this disorder are developed. Knowledge of the rate of disease progression, particularly at early phases of illness, is essential for the design of clinical trials aimed at evaluating potential neuroprotective treatment strategies. However, such determinations can be challenging when based solely upon clinical assessments, especially if the different manifestations of disease do not evolve in parallel.1,2
Over the past five years, attention has turned toward the use of imaging biomarkers as a more objective and accurate means of gauging disease progression. Radiotracer-based imaging assessments of nigrostriatal dopaminergic function have proved useful in the detection of early PD and in monitoring disease progression. Nonetheless, the relationship of these measures to clinical change has not always been straightforward.3 Functional brain imaging can provide other insights into mechanisms of therapy for PD and related disorders. Particularly, metabolic imaging of the brain with 18F-fluorodeoxyglucose (FDG) PET has yielded useful information regarding disordered functional connectivity in neurodegenerative disease.4 By mapping glucose metabolism at a voxel level, this imaging approach provides a measure of regional synaptic activity and the biochemical maintenance processes that dominate the rest state. The effects of localized pathology on these cellular functions can alter functional connectivity across the entire brain in a disease-specific manner.
Spatial covariance analysis has proven useful as a means of identifying the network abnormalities that are associated with PD and related disorders.5 Using this approach, we have found that PD is associated with the expression of an abnormal metabolic pattern characterized by increased pallido-thalamic and pontine activity, and relative metabolic reductions in cortical motor and association regions (Figure 1A). To date, this PD-related spatial covariance pattern (PDRP) has been detected in metabolic scans from multiple patient populations (Figure 1B). Using an automated algorithm for network quantification in single cases6 (software downloadable at http://feinsteinneuroscience.org), we have recently found PDRP expression to be highly reproducible in individual subjects scanned at a single center, with stable network activity over hours to weeks.7 In addition to discriminating accurately between PD patients and healthy volunteer subjects (Figure 1C), this network measure has recently been found useful in the differential diagnosis of classical PD and atypical forms of parkinsonism.6,8,9
Figure 1.
A. Parkinson’s disease-related pattern (PDRP) identified by network analysis of FDG PET scans from 33 PD patients and 33 age-matched normal volunteers.7 This spatial covariance pattern was characterized by relative increases in pallido-thalamic, pontine, and cerebellar metabolism, associated with decreases in the premotor and posterior parietal areas. [The display represents voxels that contribute significantly to the network at p = 0.001 and which are reliable (p < 0.001) on bootstrap estimation. Voxels with positive region weights (metabolic increases) are color coded from red to yellow; those with negative region weights (metabolic decreases) are color coded from blue to purple.]
B. Region weights on PD-related spatial covariance patterns identified in seven independent populations of patients and healthy subjects undergoing metabolic imaging in the rest state (see text). The statistical criteria employed to select these patterns have been provided elsewhere.7 These metabolic networks were found to be similar across sites (r = 0.75, p < 0.001 for between-center correlations of PDRP region weights). The patterns were characterized by significant contributions from the putamen/globus pallidus, thalamus, and cerebellum (metabolic increases), and from the lateral premotor and parietal association regions (metabolic decreases). [Region weights of absolute value > 1 correspond to areas with significant local metabolic contributions to network activity (p < 0.001). The bold line indicates population-averaged regional loadings across centers.]
C. PDRP expression in the 33 PD patients and 33 age-matched healthy control subjects whose FDG PET scans were originally used to identify the pattern (left panel), and in 32 subsequent age- and disease severity-matched PD patients whose scans were used to validate the pattern on a prospective case basis (right panel).7 Network activity was elevated in both PD patient cohorts relative to the healthy volunteer group (p < 0.001 for each patient cohort; Student’s t test). [Error bars indicate standard deviations]
D. Mean PDRP activity in 15 early stage PD patients followed longitudinally at baseline, 24 and 48 months. Network activity increased over time (p < 0.0001; repeated measures analysis of variance). PDRP expression in the patient group was significantly elevated at all three timepoints relative to values for 15 age-matched healthy control subjects. [PDRP values were adjusted so that zero represents the mean for the healthy control group. The dashed line represents one standard deviation above the normal mean. Bars represent the standard error for the PD patient group at each timepoint. Asterisks represent the significance of comparisons with control values at each timepoint (*p < 0.05, **p < 0.001, ***p < 0.0001; post hoc Tukey tests)]
Substantial evidence has accrued linking the PDRP to the motor manifestations of the disease. The activity of this network has been found to correlate with standardized motor ratings10 and also with spontaneous firing rates of neurons in the human motor pallidum.5 Moreover, PDRP activity can be modulated by therapeutic lesioning or deep brain stimulation (DBS) of this structure as well as the subthalamic nucleus.10,11 The reduction in network activity induced by each of these interventions has been found to correlate with the degree of motor benefit that was observed postoperatively.
Network analysis of metabolic imaging data has also provided unique insights into the mechanisms underlying abnormal cognitive functioning in PD. In a recent FDG PET study, we found that neuropsychological performance in non-demented PD patients was associated with the activity of a separate metabolic pattern that was unrelated to the PDRP.12 This PD-related cognitive pattern (PDCP) was characterized by reduced metabolic activity in prefrontal and parietal cortex, associated with relative increases in the dentate nuclei and cerebellar hemispheres (Figure 2A). PDCP expression in individual patients correlated consistently with performance on tests of memory and executive functioning (Figure 2B). Network activity in individual patients was highly reproducible over an eight week period but was not altered by the treatment of motor symptoms with either levodopa or STN stimulation. We have recently noted elevated PDCP expression in PD patients fulfilling clinically defined criteria for mild cognitive impairment (MCI) relative to their cognitively intact counterparts13 (Figure 2C). These findings suggest that the PDCP network can serve as a potential biomarker of cognitive functioning at early clinical stages of the disease.
Figure 2.
A. Parkinson’s disease-related cognitive pattern (PDCP) identified by network analysis of FDG PET scans from 15 non-demented PD patients with mild-moderate motor symptoms.12 This spatial covariance pattern was characterized by metabolic reductions in the dorsolateral prefrontal cortex, rostral supplementary motor area (preSMA), and medial-superior parietal regions, associated with increases in the cerebellum and dentate nucleus.
B. Correlations between PDCP expression and performance on the California Verbal Learning Test (CVLT Sum) in the original identification group (n = 15; squares) and in the prospective validation group (n = 32; triangles). Significant linear relationships between network activity and performance were present for the whole sample (R2 = 0.36; p < 0.001; fitted regression line and 95% confidence intervals), as well as for the original and the prospective samples. Similar correlations were found between PDCP activity and tests of executive functioning in the same patient cohort.12
C. Mean PDCP activity for 18 PD patients with mild cognitive impairment (MCI+) and 18 cognitively intact PD patients (MCI−) (see text). The two groups were matched for age, motor disability, disease duration, and educational level. PDCP network activity was elevated in the MCI+ group relative to the MCI- group (**p < 0.01, Student’s t test). [Error bars indicate standard deviations. Figure courtesy of Dr. C. Huang].
D. Mean PDCP activity in 15 early stage PD patients followed longitudinally at baseline, 24 and 48 months. Network activity increased over time (p < 0.0001; repeated measures analysis of variance). PDCP expression in these patients was within the normal range at the first two timepoints, but reach abnormal levels relative to controls (p < 0.001) at the final timepoint. [PDCP values were adjusted so that zero represents the mean for the healthy control group. The dashed line represents one standard deviation above the normal mean. Bars represent the standard error for the PD patient group at each timepoint. Asterisks represent the significance of comparisons with control values at each timepoint (***p < 0.001; post hoc Tukey tests)]
Metabolic Changes in the Presymptomatic Period
Although abnormal network activity is a feature of early PD, the precise time at which the disease-related metabolic patterns emerge is unknown. This is particularly relevant to the study of individuals harboring genetic mutations for this disorder. Using functional MRI, Buhmann and colleagues14 demonstrated increased striatocortical activation during movement in asymptomatic carriers of the Parkin mutation. Nigrostriatal dopaminergic dysfunction was also evident in these patients.15 Thus the enhanced cortical motor activation that was observed may constitute a form of compensation in individuals with latent dopaminergic deficits. We have recently noted similar changes in motor activation responses in early stage PD patients.16
It is not known how these changes relate to the emergence of abnormal PDRP expression and to the onset of clinical symptoms. Recently, Tang et al.17 found that PDRP expression was significantly elevated in the “preclinical” hemispheres (i.e., those opposite the clinically uninvolved limbs) of patients with pure hemiparkinsonism. Further increases were evident as clinical symptoms emerged on this body side. These results suggest that abnormal network activity is present prior to symptom onset. FDG PET studies are currently being conducted to determine whether latent network abnormalities are present in individuals at risk for developing PD such as those with Rapid Eye Movement Behavior Disorder (RBD)18 or with susceptibility genes.19
Longitudinal imaging data have been used to estimate the actual duration of the “presymptomatic period”. Network analysis of metabolic imaging data has provided evidence for a comparably short preclinical period in PD, in which dissociation of the normal relationship between metabolic activity and age occurred approximately five years before symptom onset. Serial dopaminergic imaging measurements have yielded similar estimates ranging 3–7 years.20 Indeed, these estimates are in general agreement with a recent pathological study correlating clinical severity with substantia nigra neuronal density.21 Regardless of approach, it is likely that imaging tools will prove useful in defining a time window for early intervention in PD.
Change in Network Activity with Disease Progression
Information has recently become available on the time course of network expression in early PD in relation to concurrent clinical and dopaminergic imaging measures of disease progression. In a longitudinal multitracer PET study22, 15 early stage PD patients (Hoehn and Yahr Stage 1.2 ± 0.3, mean ± SD; disease duration ≤ 2 years) were scanned at baseline, 24 and 48 months. All subjects underwent serial imaging with FDG PET in a 12 hour off-state to measure the expression of the two disease-related networks at each timepoint. The patients were also scanned with [18F]-fluoropropyl βCIT (FP-CIT) to quantify caudate and putamen dopamine transporter (DAT) binding as an index of presynaptic nigrostriatal dopaminergic dysfunction.
We found that PDRP activity increased linearly with disease progression (p < 0.0001), and was significantly elevated with respect to control values at all three timepoints (Figure 1D). These changes correlated with concurrent reductions in motor function (p < 0.005) and putamen DAT binding (p < 0.01). The magnitude of these correlations was modest, in that no more than one third of the variability in any one of the progression biomarkers (i.e., clinical ratings, dopaminergic imaging, and PDRP) was explained by either of the remaining two descriptors. Thus, these measures are not interchangeable; each appears to capture a unique feature of the neurodegenerative process (Figure 3). In fact, the complementary nature of the dopaminergic and metabolic network imaging methods suggests that the two approaches together provide a better means of assessing disease progression than each individually. Further studies employing both approaches will be needed to assess their comparative sensitivity to longitudinal change.
Figure 3.
Schematic showing significant correlations (p < 0.01) between changes in UPDRS motor ratings, PDRP network activity, and striatal DAT binding during the progression of early stage PD. The grey areas indicate overlap between pairs of measures, represented by the strength (R2) of their within-subject correlations.22 The black area indicates the commonality (interaction effect) of the three measures.
PDCP activity also increased with time (p < 0.0001), but at a comparatively slower rate than the PDRP (Figure 2D). While PDRP expression was already abnormal at baseline, PDCP activity did not reach abnormal levels until the final timepoint. Indeed, the PDCP data were compatible with a curvilinear trajectory characterized by a slow increase followed by late acceleration. In contrast to the PDRP, the longitudinal changes in PDCP expression did not correlate with concurrent deterioration in motor ratings or caudate/putamen DAT binding measures. Thus, the PDRP and PDCP metabolic patterns evolve differently in the course of early stage PD, with the effects of disease progression varying in “motor” and “cognitive” pathways. While it would be desirable for disease modifying agents to slow or arrest the development of abnormalities in both neural systems, it is conceivable that different therapeutic approaches will be needed to retard the development of functional disturbances in each of the pathways. Metabolic imaging and network quantification tools may be helpful in monitoring these specific treatment effects.
The functional/anatomical basis for the PDRP and PDCP metabolic patterns is not completely understood. The correlation of PDRP expression with striatal DAT binding22 and its modulation by levodopa10 indicates that functionally this network is under dopaminergic influence. Nonetheless, as mentioned above, the magnitude of these effects is selectively modest, and levodopa administration cannot fully “correct” this metabolic abnormality. While nigrostriatal dopamine cell loss can be viewed as permissive for PDRP expression, network activity appears to be more closely related to basal ganglia output. Indeed, highly significant PDRP suppression is achievable through surgical interventions targeting downstream nodes of the network.10,11
By contrast, there is no evidence of a relationship between PDCP expression and nigrostriatal dopaminergic dysfunction.22 Indeed, this network does not appear to be modulated by either levodopa or STN stimulation.12 Abnormal PDCP activity may however be related to cortical cholinergic deficits that have been shown to occur with cognitive impairment in PD patients.23 In this regard, an FDG PET study is underway to determine whether this network is modulated by cholinesterase inhibition. It is also possible that the cortical metabolic reductions that occur with PDCP expression reflect the presence of abnormal protein aggregates in these regions. Cellular changes of this type in frontal and parietal neocortex may limit the degree of therapeutic network modulation that can be achieved by this class of agents.
Metabolic Networks and Clinical Trial Design
Rates of disease progression can be difficult to assess when the measured index is influenced by treatment. Nonetheless, the results of our recent longitudinal study suggest that the effect of advancing disease on PDRP expression is substantially greater than that of symptomatic treatment. Knowledge of the changes in network expression and motor ratings that occur during acute levodopa treatment in early stage PD, the relationship of these changes to medication dose, and the time course of motor changes during washout can be used in concert to model the impact of drug on PDRP-based measurements of the progression rate. This approach revealed that extending the duration of washout from 12 hours to two weeks had minimal impact (< 5%) on the progression measure. This suggests that rates of disease progression can accurately be measured by network assessment without extended washout. This notion is currently being examined in an FDG PET washout study of drug-naïve patients placed on oral levodopa therapy. Similar studies can be envisioned to determine the length of washout needed for accurate network measurement in the testing of potential neuroprotective drugs for early stage PD. This information will be critical in the planning of imaging biomarker assessments in randomized placebo-controlled clinical trials of new disease-modifying agents.
FDG PET imaging has proved useful in a recent phase I clinical trial of unilateral subthalamic AAV-GAD gene therapy for advanced PD.24,25 In this unblinded study of 12 patients in whom dopaminergic medications were kept stable for one year, the observed clinical benefit was associated with significant metabolic changes in the thalamus and motor cortex. Network analysis disclosed relative reductions in PDRP expression on the treated side following surgery, which correlated with clinical improvement. By contrast, continuous increases were seen on the untreated side, consistent with disease progression. There was no change in PDCP expression in either cerebral hemisphere. While preliminary, these results demonstrate how objective information regarding treatment effects can be obtained by this approach, even in “open-label” circumstances. Changes in network expression as an index of treatment efficiency will be further evaluated in a blinded, sham surgery controlled study of bilateral STN GAD gene therapy for PD. This multicenter trial is planned to begin in late 2007.
Where next?
Several issues relating to the use of network biomarkers in PD are currently being studied. Although the major effect of symptomatic treatment on PDRP activity appears to be reversible over 12–18 hours10, the precise time needed for complete washout is not precisely known. This knowledge will be critical for the design of future neuroprotection trials, especially of agents with potential network modulatory effects. Investigations are also underway to examine the association between increasing PDCP metabolic activity and the development of early cognitive dysfunction in PD patients. The relationship of these changes to the deposition of abnormal protein aggregates is also being investigated using a multiple PET radiotracer approach including newly developed ligands that are sensitive to this pathological process.
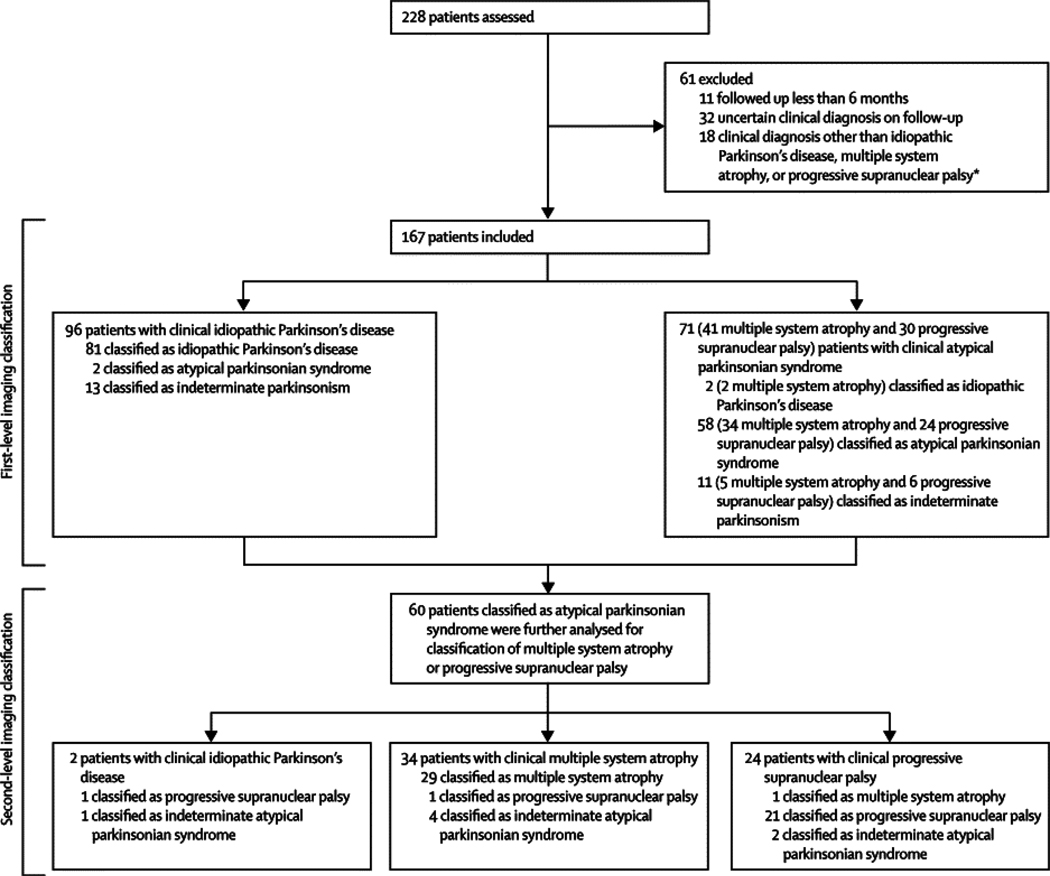
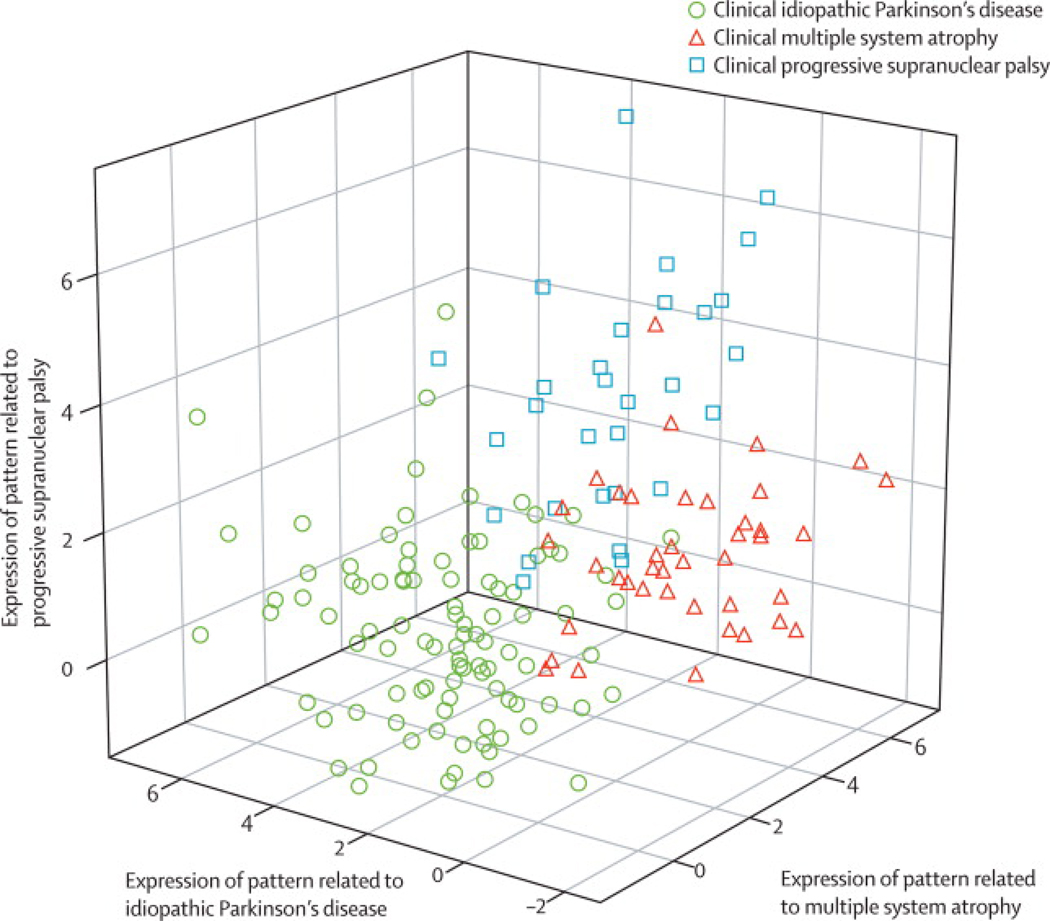
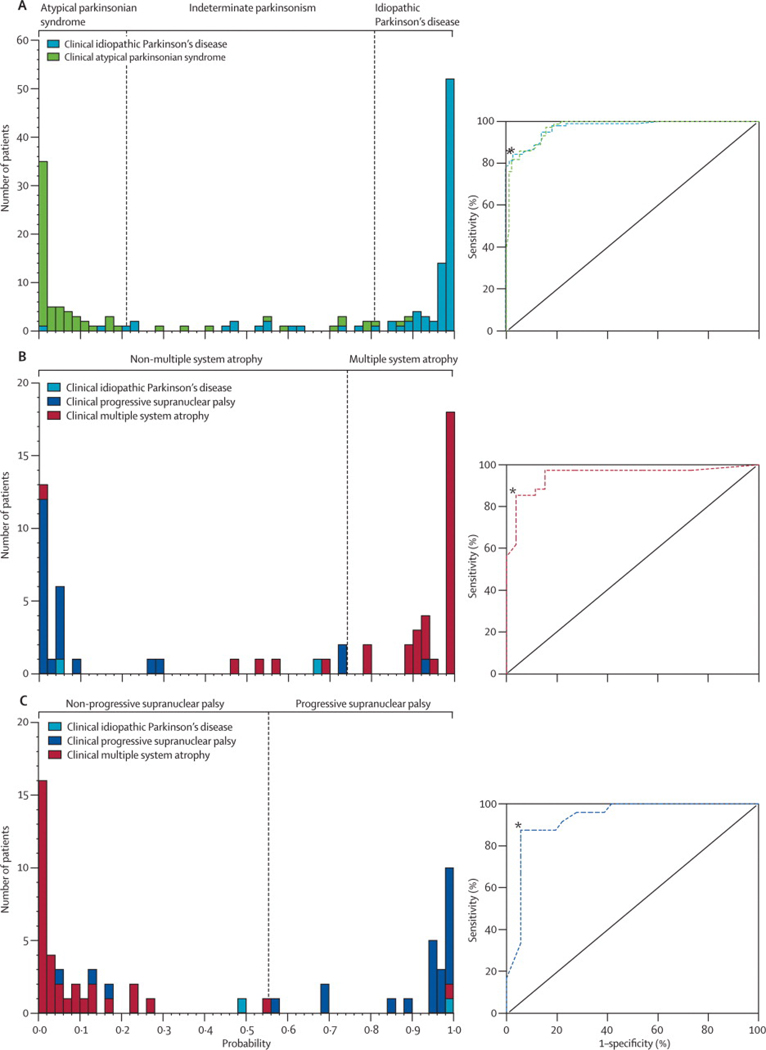
Ongoing research is also being conducted on the implementation of functional MR methods for network quantification. Recent work has demonstrated that blood flow and metabolism are highly coupled in PD, and that PDRP expression is abnormal in scans of cerebral blood flow acquired with SPECT as well as PET imaging.7,9 Preliminary studies suggest that accurate quantification of network activity can also be achieved with arterial spin labeling (ASL) MRI26, a technique to measure cerebral perfusion without ionizing radiation. If validated, such methods may be well-suited to the study of large populations, as might occur in a search for susceptibility genes for PD and related disorders. Lastly, new avenues of investigation are focusing on the identification of sensitive and specific network biomarkers for parkinsonian variant conditions like MSA and PSP. The validation of these networks would enable their use, along with the PDRP, in a fully automated algorithm for the discrimination of these conditions.6 This approach may be particularly relevant in clinical trials of new antiparkinsonian therapies in which treatment responses may differ according to diagnosis.
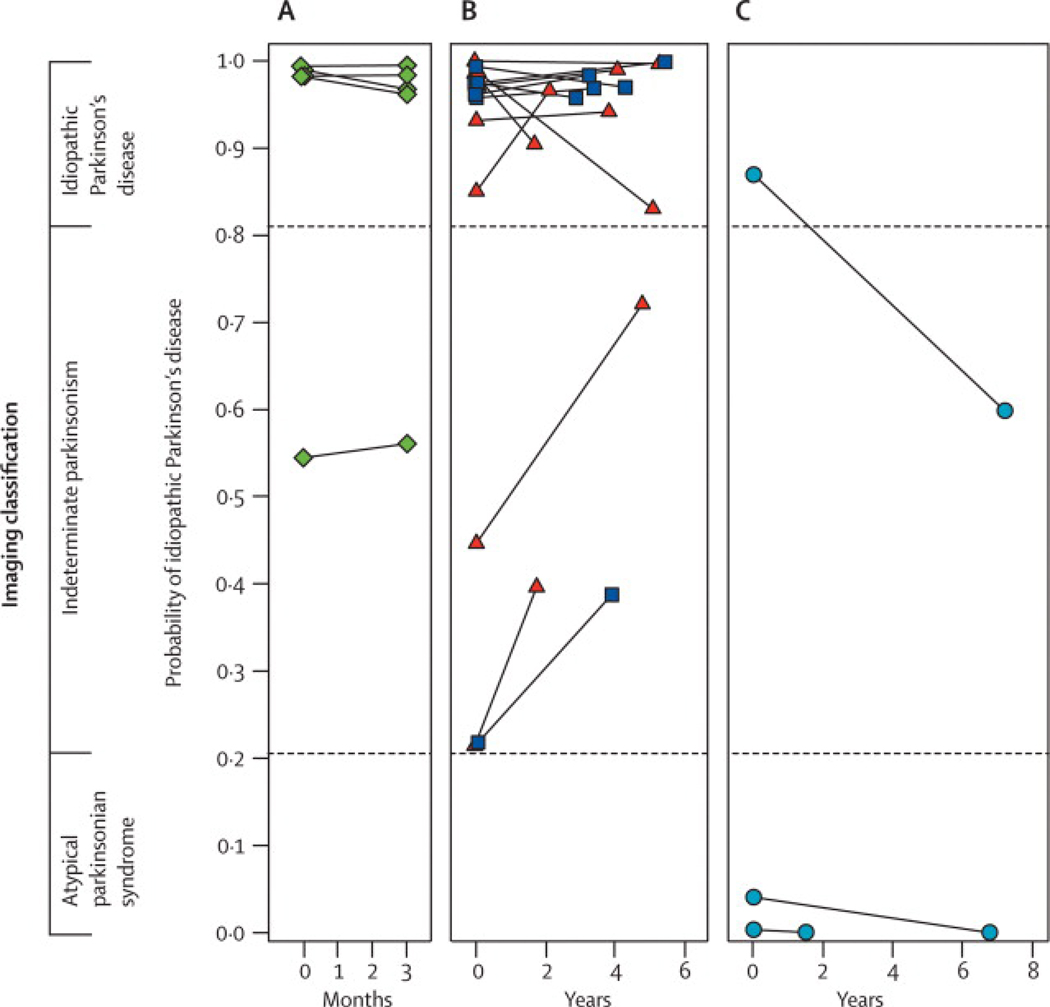
Figure 4.
Reliability of imaging classification on repeat testing Probabilities of idiopathic Parkinson’s disease and atypical parkinsonian syndrome computed from the initial and repeat scans of 22 patients. Values from the two scans from each patient are connected by solid lines. Significant agreement (p<0·0001) was found between the image-based classifications from the two scans for these patients. Probability of atypical parkinsonian syndrome is the inverse of that for idiopathic Parkinson’s disease. (A) Five patients clinically diagnosed with idiopathic Parkinson’s disease who were drug-naive at the time of the initial scan and who were rescanned after 3 months of oral carbidopa plus levodopa treatment. (B) 14 patients with clinical idiopathic Parkinson’s disease who were scanned twice in the off-state. Six patients (blue squares) were drug-naive at baseline and eight (red triangles) were receiving chronic oral treatment at the time of the first scan. All were receiving levodopa treatment chronically at the time of repeat scanning. (C) Three patients clinically diagnosed with multiple system atrophy who had repeat scanning.
Figure 5.
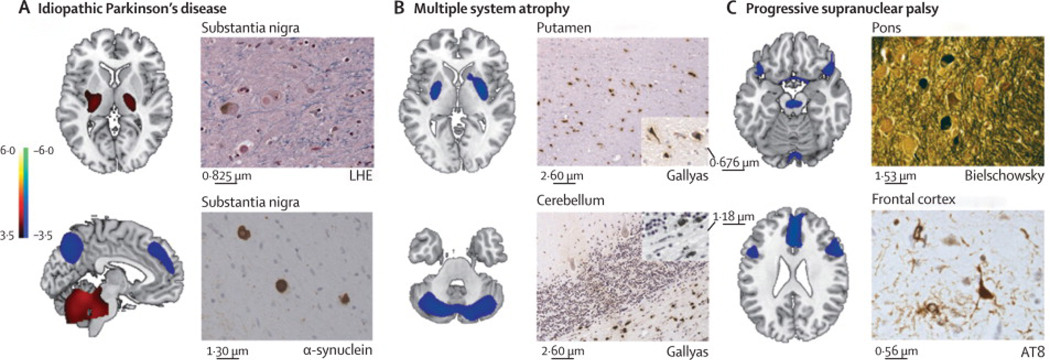
Disease-related metabolic patterns and post-mortem findings (A) The pattern related to idiopathic Parkinson’s disease (left)15 is characterised by increased (red areas) pallidothalamic and pontocerebellar metabolic activity associated with relative reductions (blue areas) in the premotor cortex, supplementary motor area, and parietal association regions. Neuropathological findings (right) from the substantia nigra pars compacta of a patient classified as having idiopathic Parkinson’s disease with a likelihood of 99% on the basis of fluorine-18-labelled-fluorodeoxyglucose (FDG)-PET 5·8 years before death. Diagnosis was confirmed at post-mortem examination, with the demonstration of Lewy-body containing neurons and severe cell loss in this region (LHE, 630X; top). Neuronal inclusions stained positively for α-synuclein (α-synuclein antibody, 400X; bottom). (B) The multiple system atrophy-related pattern (left)16 is characterised by bilateral metabolic reductions in putamen and cerebellar activity. Neuropathological findings (right) from a patient classified as having multiple system atrophy with a likelihood of 98% on the basis of FDG-PET 3 years before death. Autopsy revealed characteristic changes in abnormal hypometabolic pattern areas, with neuronal loss and gliosis in the putamen (top) and cerebellum (bottom). Both regions displayed glial cytoplasmic inclusions (Gallyas stain, 200X). Insets: putamen, 400X; cerebellum, 630X. (C) The progressive supranuclear palsy-related pattern (left)16 is characterised by metabolic reductions in the upper brainstem, medial frontal cortex, and medial thalamus. Neuropathological findings (right) from a patient classified as having progressive supranuclear palsy with a likelihood of 99% on the basis of FDG-PET 3�9 years before death. Post-mortem examination confirmed this diagnosis, with characteristic histopathological changes in abnormal hypometabolic pattern areas, in the pons (top) and frontal cortex (bottom). Argyrophilic globosum neuronal tangles were noted in the basis pontis (Bielschowsky stain 400X). A neuronal tangle with cytoplasmic inclusions and neuropil threads is displayed from the fifth cortical layer of the prefrontal region (AT8 stain, 630X). Tufted astrocytes (not shown) were present in this cortical region, the amygdala, globus pallidus, and claustrum. LHE=Luxol fast blue with haematoxylin and eosin.
Acknowledgments
This work was supported by NIH NINDS R01 35069 and P50 NS 38370. Special thanks to Ms. Toni Flanagan for valuable editorial assistance.
Footnotes
Publisher's Disclaimer: This is a PDF file of an unedited manuscript that has been accepted for publication. As a service to our customers we are providing this early version of the manuscript. The manuscript will undergo copyediting, typesetting, and review of the resulting proof before it is published in its final citable form. Please note that during the production process errors may be discovered which could affect the content, and all legal disclaimers that apply to the journal pertain.
Conflict of Interest
The authors have no conflicts of interest to disclose.
References
- 1.Alves G, Larsen JP, Emre M, Wentzel-Larsen T, Aarsland D. Changes in motor subtype and risk for incident dementia in Parkinson's disease. Mov Disord. 2006;21:1123–1130. doi: 10.1002/mds.20897. [DOI] [PubMed] [Google Scholar]
- 2.Langston JW. The Parkinson's complex: parkinsonism is just the tip of the iceberg. Ann Neurol. 2006;59:591–596. doi: 10.1002/ana.20834. [DOI] [PubMed] [Google Scholar]
- 3.Ravina B, Eidelberg D, Ahlskog JE, et al. The role of radiotracer imaging in Parkinson disease. Neurology. 2005;64:208–215. doi: 10.1212/01.WNL.0000149403.14458.7F. [DOI] [PubMed] [Google Scholar]
- 4.Trošt M, Dhawan V, Feigin A, Eidelberg D. PET and SPECT. In: Beal MF, Lang A, Ludolph A, editors. Neurodegenerative diseases: neurobiology pathogenesis and therapeutics. Cambridge: Cambridge University Press; 2005. pp. 290–300. [Google Scholar]
- 5.Eckert T, Eidelberg D. Neuroimaging and therapeutics in movement disorders. NeuroRx. 2005;2:361–371. doi: 10.1602/neurorx.2.2.361. [DOI] [PMC free article] [PubMed] [Google Scholar]
- 6.Spetsieris P, Ma Y, Dhawan V, Moeller JR, Eidelberg D. Highly automated computer-aided diagnosis of neurological disorders using functional brain imaging. Proc SPIE: Medical Imaging. 2006;6144:61445M1–61445M12. [Google Scholar]
- 7.Ma Y, Tang C, Spetsieres P, Dhawan V, Eidelberg D. Abnormal metabolic network activity in Parkinson's disease: test-retest reproducibility. J Cereb Blood Flow Metab. 2007;27:597–605. doi: 10.1038/sj.jcbfm.9600358. [DOI] [PMC free article] [PubMed] [Google Scholar]
- 8.Eckert T, Feigin A, Lewis DE, Dhawan V, Frucht S, Eidelberg D. Regional metabolic changes in parkinsonian patients with normal dopaminergic imaging. Mov Disord. 2006;22:167–173. doi: 10.1002/mds.21185. [DOI] [PubMed] [Google Scholar]
- 9.Eckert T, Van Laere KV, Tang C, Lewis DE, Santens P, Eidelberg D. Quantification of PD-related network expression with ECD SPECT. Eur J Nucl Med Mol Imaging. 2007;34:496–501. doi: 10.1007/s00259-006-0261-9. [DOI] [PubMed] [Google Scholar]
- 10.Asanuma K, Tang C, Ma Y, et al. Network modulation in the treatment of Parkinson's disease. Brain. 2006;129:2667–2678. doi: 10.1093/brain/awl162. [DOI] [PMC free article] [PubMed] [Google Scholar]
- 11.Trošt M, Su S, Su P, et al. Network modulation by the subthalamic nucleus in the treatment of Parkinson's disease. Neuroimage. 2006;31:301–307. doi: 10.1016/j.neuroimage.2005.12.024. [DOI] [PMC free article] [PubMed] [Google Scholar]
- 12.Huang C, Mattis P, Tang C, Perrine K, Carbon M, Eidelberg D. Metabolic brain networks associated with cognitive function in Parkinson's disease. Neuroimage. 2007;34:714–723. doi: 10.1016/j.neuroimage.2006.09.003. [DOI] [PMC free article] [PubMed] [Google Scholar]
- 13.Huang C, Mattis P, Brown N, Eidelberg D. Functional imaging measures of mild cognitive impairment in Parkinson's disease. Neurology. 2007;68:A390. [abstract] [Google Scholar]
- 14.Buhmann C, Binkofski F, Klein C, et al. Motor reorganization in asymptomatic carriers of a single mutant Parkin allele: a human model for presymptomatic parkinsonism. Brain. 2005;128:2281–2290. doi: 10.1093/brain/awh572. [DOI] [PubMed] [Google Scholar]
- 15.Khan NL, Scherfler C, Graham E, et al. Dopaminergic dysfunction in unrelated, asymptomatic carriers of a single parkin mutation. Neurology. 2005;64:134–136. doi: 10.1212/01.WNL.0000148725.48740.6D. [DOI] [PubMed] [Google Scholar]
- 16.Carbon M, Felice Ghilardi M, Dhawan V, Eidelberg D. Correlates of movement initiation and velocity in Parkinson's disease: A longitudinal PET study. Neuroimage. 2007;34:361–370. doi: 10.1016/j.neuroimage.2006.08.019. [DOI] [PMC free article] [PubMed] [Google Scholar]
- 17.Tang C, Edelstein A, Huang C, et al. Hemiparkinsonism: Parallel longitudinal changes in hemispheric striatal DAT binding and glucose metabolism. Neurology. 2006;66 Suppl 2 [abstract] [Google Scholar]
- 18.Stiasny-Kolster K, Doerr Y, Moller JC, et al. Combination of 'idiopathic' REM sleep behaviour disorder and olfactory dysfunction as possible indicator for alpha-synucleinopathy demonstrated by dopamine transporter FP-CIT-SPECT. Brain. 2005;128:126–137. doi: 10.1093/brain/awh322. [DOI] [PubMed] [Google Scholar]
- 19.Cookson MR, Xiromerisiou G, Singleton A. How genetics research in Parkinson's disease is enhancing understanding of the common idiopathic forms of the disease. Curr Opin Neurol. 2005;18:706–711. doi: 10.1097/01.wco.0000186841.43505.e6. [DOI] [PubMed] [Google Scholar]
- 20.Au WL, Adams JR, Troiano AR, Stoessl AJ. Parkinson's disease: in vivo assessment of disease progression using positron emission tomography. Brain Res Mol Brain Res. 2005;134:24–33. doi: 10.1016/j.molbrainres.2004.09.028. [DOI] [PubMed] [Google Scholar]
- 21.Greffard S, Verny M, Bonnet AM, et al. Motor score of the Unified Parkinson Disease Rating Scale as a good predictor of Lewy body-associated neuronal loss in the substantia nigra. Arch Neurol. 2006;63:584–588. doi: 10.1001/archneur.63.4.584. [DOI] [PubMed] [Google Scholar]
- 22.Huang C, Tang C, Feigin A, et al. Changes in network activity with the progression of Parkinson's disease. Brain. 2007;130:1834–1846. doi: 10.1093/brain/awm086. [DOI] [PMC free article] [PubMed] [Google Scholar]
- 23.Brooks DJ. Imaging Non-Dopaminergic Function in Parkinson's Disease. Mol Imaging Biol. 2007 doi: 10.1007/s11307-007-0084-5. [DOI] [PubMed] [Google Scholar]
- 24.Kaplitt M, Feigin A, Tang C, et al. Safety and tolerability of AAV-GAD gene therapy for Parkinson's disease: An open label, phase I trial. Lancet. 2007;369:2097–2105. doi: 10.1016/S0140-6736(07)60982-9. [DOI] [PubMed] [Google Scholar]
- 25.Feigin A, Tang C, During MJ, Kaplitt M, Eidelberg D. Gene therapy for Parkinson's disease with subthalamic nucleus AAV-GAD: FDG PET results. Mov Disord. 2006;21:1543. [abstract] [Google Scholar]
- 26.Huang C, Dyke JP, Pan H, Feigin A, Pourfar M, Eidelberg D. Assessing network activity in Parkinson's disease with arterial spin labeling MRI. NeuroImage. 2007;36:S111. [abstract] [Google Scholar]


