

SUMMARY
Hepatitis E virus (HEV) is ubiquitous in pigs worldwide and may be zoonotic. Previous HEV seroprevalence estimates for groups of people working with swine were higher than for control groups. However, discordance among results of anti-HEV assays means that true seroprevalence estimates, i.e. seroprevalence due to previous exposure to HEV, depends on choice of seroassay. We tested blood samples from three subpopulations (49 swine veterinarians, 153 non-swine veterinarians and 644 randomly selected individuals from the general population) with one IgM and two IgG ELISAs, and subsets with IgG and/or IgM Western blots. A Bayesian stochastical model was used to combine results of all assays. The model accounted for imperfection of each assay by estimating sensitivity and specificity, and accounted for dependence between serological assays. As expected, discordance among assay results occurred. Applying the model yielded seroprevalence estimates of ~11% for swine veterinarians, ~6% for non-swine veterinarians and ~2% for the general population. By combining the results of five serological assays in a Bayesian stochastical model we confirmed that exposure to swine or their environment was associated with elevated HEV seroprevalence.
INTRODUCTION
Hepatitis E virus (HEV) is an enterically transmitted RNA virus discovered in the early 1980s [1]. Since then, the virus has caused major outbreaks of hepatitis E as well as sporadic cases in humans in developing countries. A common source in epidemics is often contaminated water [2]. Mortality rates are around 1% in general [2], but may reach up to about 25% in pregnant women [3]. In addition, pre-term deliveries occur in an estimated two-thirds of HEV-infected pregnant women [3].
In developed countries, studies show seroprevalence between 0·9% and 2·6%, suggesting cases of hepatitis E occur [4]. Such cases are considered to be imported from HEV endemic areas, mainly Asia and Africa [2]. However, reports on locally acquired hepatitis E in developed countries are increasing and local sources of the virus have been identified. For instance, foodborne transmission of HEV was described in Japan, where consumption of undercooked game meat and pig livers led to clinical disease in humans [5–7]. However, no source has yet been documented for any reported locally acquired case in Europe and the United States [8–11].
Possible zoonotic transmission from domestic swine to humans was suggested after the discovery of porcine HEV that showed extensive similarity to human HEV strains [12]. The possibility of inter-species transmission of HEV was corroborated by experimental infection of pigs with a human HEV strain and subsequent HEV transmission to a contact pig, and by infection of primates with porcine HEV [13]. Furthermore, direct contact with swine was suggested to be a risk factor for veterinarians and swine farm-workers due to a higher seroprevalence compared to control individuals [14–17].
Several serological assays to detect HEV antigens in humans have been developed, but discordance among test results occurs when different assays are applied to the same samples [18, 19]. This makes interpretation of results difficult, especially when assays are applied to cross-sectional samples from populations and most positive results are probably from historic cases of hepatitis E. Knowing sensitivity and specificity of assays allows correction for misclassified results, but no gold standard is available to assess these two parameters. Several statistical methods are available to account for imperfect diagnostic testing in true seroprevalence estimation in the absence of a gold standard [20]. One such method estimates sensitivity and specificity of two diagnostic assays using maximum likelihood, for instance applicable for two assays used in two populations with different true seroprevalence (i.e. seroprevalence due to previous exposure to HEV) [21]. However, this method, requires use of large sample sizes and assumes conditional independence between assays, which limits its use. A statistical approach based on Bayes' theorem is able to deal with conditional dependence between assays and does not require large sample sizes [22]. An additional advantage of a Bayesian approach is inclusion of scientific knowledge in a probabilistic sense (designated priors).
The objective of this study was to estimate true HEV seroprevalence in three populations with differing exposure to swine, while accounting for imperfect diagnostic testing. We analysed serum samples from swine veterinarians, non-swine veterinarians and the general population with five serological assays. Subsequently, assay results were analysed with a Bayesian stochastical model that estimated sensitivity and specificity of each assay and accounted for potential dependency between assays.
METHODS
Serum samples and study populations
Blood samples were collected and processed as described previously [23]. Briefly, 202 samples from veterinarians were used and a total of 648 samples from the general population were matched by gender, age and geography. Serum samples had been stored at −70°C for about 2 years. Information from each veterinarian was obtained by questionnaire. Two questions addressed the relative distribution of time working with finishing and with farrowing pigs, divided in five categories: 0%, >0–25%, >25–50%, >50–75%, and >75%. Based on the estimated total time working with finishing and farrowing pigs (for quartiles, median values of categories were used for summation), veterinarians were considered swine veterinarian if >50% of their time was devoted to pigs (n=49) or non-swine veterinarians (n=153) if otherwise. Individuals from the general population were assumed to have had no professional exposure to swine.
Diagnostic assays
Five serological assays were used in this study: two ELISAs to detect IgG (E-1, Abbott Laboratories, Abbott Park, IL, USA; and E-2, Genelabs Diagnostics Inc., Redwood City, CA, USA), one ELISA to detect IgM (E-3, Genelabs Diagnostics), one Western blot to detect IgG (WB-1; Mikrogen, Martinsried, Germany) and one Western blot to detect IgM (WB-2; Mikrogen).
All serum samples were examined with E-1, E-2 and E-3. All but two samples that were positive in at least one ELISA (63 positive samples) and two samples of which results were uncertain were blindly examined with WB-1 at the Medical University Graz in Austria (Fig. 1). Among these 63 samples six were from swine veterinarians, 15 from non-swine veterinarians and 42 from individuals from the general population. In addition, 200 samples were examined with WB-1 and WB-2 at the National Institute for Public Health and the Environment in The Netherlands. Among these 200 samples 47 were from swine-veterinarians, 88 from randomly selected non-swine veterinarians and 65 from randomly selected individuals from the general population. In total, 48 swine veterinarians, 94 non-swine veterinarians and 102 samples from the general population were examined with WB-1.
Fig. 1.

Test protocol for serum samples of swine veterinarians, non-swine veterinarians and individuals from the general population. All samples were examined with the two IgG and one IgM ELISAs; a selection of samples were examined in Austria and The Netherlands with WB-1 (Western blot IgG assay) and WB-2 (Western blot IgM assay).
Ratios in optical density (OD) for E-1, E-2 and E-3, and scores for WB-1 and WB-2 were calculated according to the instructions supplied by the manufacturers. Samples with an OD ratio >1 in E-2 and E-3 or an OD ratio >0·9 in E-1 were retested in duplicate. Samples were defined as positive if the average OD ratio of the duplicate test was >1 for all ELISAs. For WB-1 and WB-2, samples were defined as positive when the score was >3 (WB-1) and >5 (WB-2), as prescribed by the manufacturer.
Agreement between assays was quantified with the kappa statistic [24].
Bayesian analysis
The Bayesian model that was applied in this study has two possible approaches for estimating sensitivity, specificity and true seroprevalence [25]. Of these two, the representation based on product conditional distributions was able to handle missing data and was therefore used. The described representation was extended to consider five diagnostic assays and three subpopulations. The model uses latent classes, which describe unknown distributions of true presence (D=1) or absence (D=0) of anti-HEV antibodies in serum samples. True presence or absence was assumed to be independently distributed with true seroprevalence πm=P(D=1|group m) among individuals sampled from subpopulation m. Hence, assay results follow a mixture of distributions for true positives and true negatives, with true seroprevalence as mixture probabilities. The Bayesian analysis was performed using the Gibbs sampler, as implemented in WinBUGS (the script can be obtained from the corresponding author) [26]. Sensitivity and specificity of each assay was assumed to be equal across subpopulations.
In Bayesian analyses, a priori information in a probabilistic sense (designated prior) is required for each parameter. Priors for sensitivity and specificity of each assay were based on the literature [19]. For assays based on similar antigens as E-2, sensitivity between 67% and 91% was observed. We specified a prior with a median of 50% [95% credible interval (CI) 15–98]. This prior was also used to describe specificity of all assays. Sensitivity of E-1 was considered to be lower than for E-2 based on experience, for which we specified a prior with a median of 25% (95% CI 6–66). The default prior for true seroprevalence was based on data for reported seroprevalence in industrialized countries and had a median of 12% (95% CI 0·5–51). Influence of all priors on final estimates was examined by substitution of initial priors with non-informative priors. To assess the influence of the prior for true seroprevalence, it was replaced with a less conservative prior with median 25% (95% CI 3–66) and a more conservative prior with median 7% (95% CI 0·3–31).
Differences between true seroprevalence estimates for the three subpopulations were estimated simultaneously with true seroprevalence. Statistical differences between populations were assumed to be present if zero was excluded from the 95% CI of the difference.
RESULTS
Descriptive
Characteristics of swine veterinarians and non-swine veterinarians are shown in Table 1. Swine veterinarians were over-represented in the south of The Netherlands (χ2, P<0·01), which reflects the concentration of swine farms in that region. Otherwise, no significant differences between swine veterinarians and non-swine veterinarians were observed.
Table 1.
Characteristics of Dutch swine (n=49) and non-swine veterinarians (n=153). The P value relates to the χ2 test of difference between swine veterinarians and non-swine veterinarians
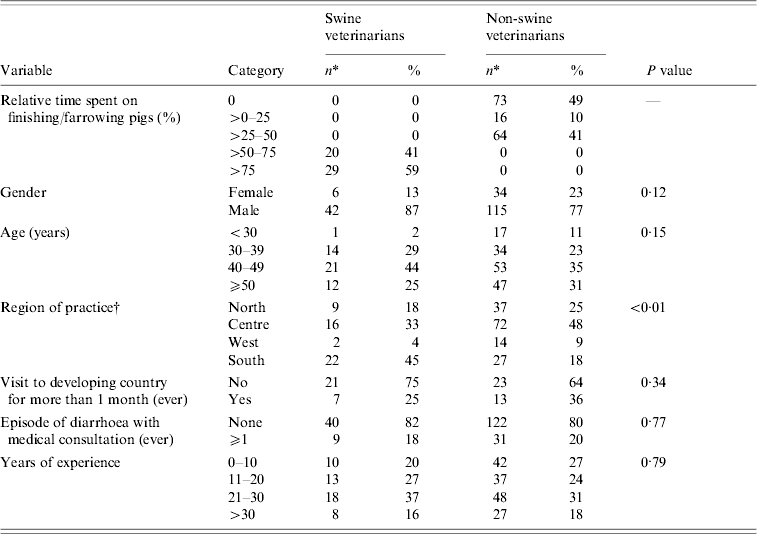
If numbers do not add up to 49 for swine veterinarians or 153 for non-swine veterinarians, data are missing.
North: provinces of Groningen, Friesland, Drenthe, Overijssel; Centre: provinces of Gelderland, Utrecht, Flevoland; West: provinces of Noord-Holland, Zuid-Holland; South: provinces of Zeeland, Noord-Brabant, Limburg.
Percentages of HEV positivity in each subpopulation are illustrated per assay in Figure 2. Large differences were observed in assay outcomes (see also Table 2). Quantifying the agreement between assays yielded ‘moderate’ (E-1 compared to E-2: kappa ~0·5), ‘slight’ (E-1 or E-2 compared to WB-1: kappa ~0·15) and ‘no’ (E-3 compared to WB-2; kappa=0) agreement.
Fig. 2.

Percentage of HEV IgG- and IgM-positive serum samples for swine veterinarians (■), non-swine veterinarians ( ) and the general population (□), for five serological assays. Numbers above bars indicate numbers of samples from the subpopulation that were examined with the respective assay. Data on the 63 samples that were analysed with WB-1 in Austria were omitted, because this selection was based on results for E-1 and E-2. Coding of assays is as follows: E-1, Abbott IgG; E-2, Genelabs IgG; WB-1, Western blot IgG; E-3, Genelabs IgM; WB-2, Western blot IgM.
Table 2.
Frequency counts of combined results for five serological assays against anti-HEV antibodies in three population groups differing in grade of professional exposure to swine. Other combinations than those displayed were not observed
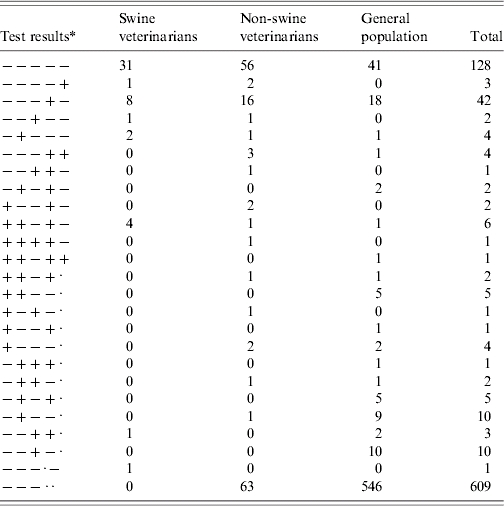
Representing: E-1, E-2, E-3, WB-1, WB-2 respectively. −, indicates a negative test result; +, indicates a positive test result; a dot (·) indicates missing data. (E-1, E-2, ELISA IgG assays; E-3, ELISA IgM assay; WB-1, Western blot IgG assay; WB-2, Western blot IgM assay.)
Recently, a strategy of using combined assay results for HEV to obtain acceptable sensitivity and specificity in low-endemic areas was proposed by M. Herremans et al. (unpublished observations). In this regime, positive results with E-2 are confirmed by WB-1. Using this regime on the 200 samples that were examined with WB-1 in The Netherlands yielded seroprevalence estimates of 6·4% for the general population, 2·3% for non-swine veterinarians and 8·5% for swine veterinarians.
Seroprevalence estimation
In all simulations, results from the first 4000 iterations were discarded for burn-in. Different chain lengths (50 000–2 500 000) as well as replicate chains of equal length (50 000 and 100 000) and three parallel chains with different initial values for all parameters (chain length 50 000) were compared with respect to the stability of posterior estimates. Posterior estimates were consistent in all comparisons. The results reported in this paper were obtained by one simulation with 100 000 iterations.
Estimated sensitivity of assays varied between 10% and 63%, with wide credible intervals (Table 3). Estimated specificity of assays varied between 74% and 99%, with small credible intervals. Changing the prior for specificity affected these results minimally. Changing the prior for sensitivity affected the sensitivity estimate for E-1 most and had marginal effects on the sensitivity of other assays.
Table 3.
Posterior medians and 95% credible intervals for sensitivity (SE) and specificity (SP) for five serological assays (IgG and IgM) detecting anti-HEV antibodies, based on different priors
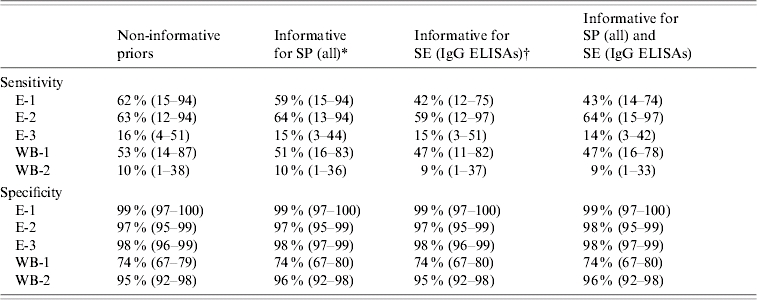
E-1, E-2, ELISA IgG assays; E-3, ELISA IgM assay; WB-1, Western blot IgG assay; WB-2, Western blot IgM assay.
For all assays, the prior emphasized a specificity of 0·75 (2·5% limit: 0·15; 97·5% limit: 0·98).
For E-1 the prior emphasized a sensitivity of 0·25 (0·06–0·66), for E-2 a sensitivity of 0·75 (0·15–0·98).
True seroprevalence estimates, based on the default prior for seroprevalence, for swine veterinarians, non-swine veterinarians and the general population are shown in Table 4. The highest true seroprevalence was estimated for swine veterinarians (~11%), lowest true seroprevalence for the general population (~2%), and intermediate true seroprevalence for non-swine veterinarians (~6%). The true seroprevalence among swine veterinarians was significantly higher than among the general population, with the 95% CI of the median of the difference (0·1–24) excluding zero. The true seroprevalence among non-swine veterinarians was not significantly different from the true seroprevalence among swine veterinarians or among the general population, but a dose–response relation was suggested. Changing priors for sensitivity or specificity altered the true prevalence estimates to the minimum.
Table 4.
Posterior median (95% credible interval) for seroprevalence of anti-HEV antibodies in three Dutch subpopulations (differing in degree of exposure to swine) using different priors for sensitivity (SE) and/or specificity (SP)
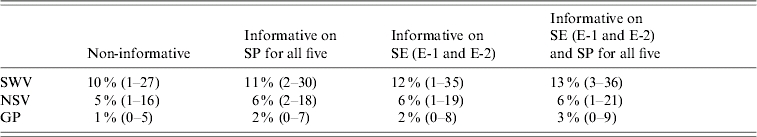
E-1, E-2, ELISA IgG assays.
SWV, Swine veterinarians; NSV, non-swine veterinarians; GP, general population.
Changing the prior for seroprevalence altered seroprevalence estimates for all groups (Table 5). The difference in true seroprevalence between swine veterinarians and the general population was 13% (95% CI 1·6–40) with use of the less conservative prior and 7% (95% CI 0·1–20) with use of the more conservative prior. Hence, the statistical difference between swine veterinarians and the general population remained. When substituting the less conservative seroprevalence prior for the default seroprevalence prior, assay sensitivity was estimated to be lower. When substituting the more conservative seroprevalence prior for the default seroprevalence prior, assay sensitivity was estimated to be higher. Estimated specificity of assays remained stable with each of the three seroprevalence priors.
Table 5.
Posterior medians for seroprevalence (95% credible interval) for swine veterinarians, non-swine veterinarians and the general population, and estimated sensitivity and specificity of five serological assays, for different priors for the seroprevalence (default, less conservative and more conservative). The informative priors for specificity were used for all assays in these analyses
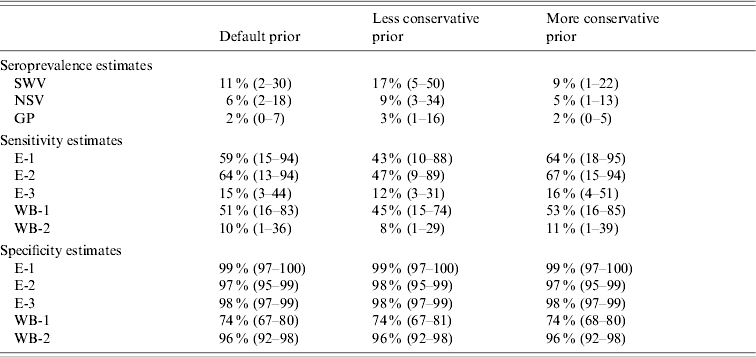
SWV, Swine veterinarians; NSV, non-swine veterinarians; GP, general population.
E-1, E-2, ELISA IgG assays; E-3, ELISA IgM assay; WB-1, Western blot IgG assay; WB-2, Western blot IgM assay.
DISCUSSION
The significant difference in estimated seroprevalence between swine veterinarians (~11%) and the general population (~2%) suggests a positive correlation between direct contact with swine, or swine farms, and seropositivity for anti-HEV antigens in humans. Our results agree with those from a US study that found 26% HEV seroprevalence for swine veterinarians compared to 18% for control subjects [16]. A similar association was observed for swine farm-workers compared to control subjects in Moldova (51% compared to 25%), Taiwan (27% compared to 8%) and the United States (11% compared to 2%) [14, 15, 17]. In contrast, no difference in seroprevalence was found between pig farmers and controls in Sweden (13% vs. 9·3%, respectively) [27]. Differences between seroprevalence estimates for comparable groups have probably been caused by differences in country of origin of study populations, in the study populations themselves, and in serological assays used.
All previous studies that relate contact with swine to HEV seroprevalence examined presence or absence of swine exposure. We also studied a group of individuals with less exposure to swine than swine veterinarians, but more exposure than the general population. Data tentatively suggest a positive relation between seroprevalence and level of exposure to swine. However, as this type of study design lacks the ability for causal inference, other possible sources of HEV on swine farms cannot be excluded as a possible explanation for elevated HEV seroprevalence. Therefore, the data presented confirm that exposure to swine or the swine environment is associated with elevated HEV seroprevalence.
Veterinarians may indeed be exposed to HEV during treatment of pigs, as HEV RNA was present on at least 54% of 97 randomly selected finishing pig farms in The Netherlands in 2005 [28]. However, other farm animals, such as cattle, sheep and goats, have also been shown to carry antibodies to the virus, albeit at a lower seroprevalence than swine, and might be a source of HEV. The seroprevalence of ~6% for non-swine veterinarians compared to 2% for the general population, although not significantly different, might, next to low-level swine exposure, also be the result of direct contact with other animal sources that are susceptible to HEV. Other animals that may spread HEV though faecal deposits should be examined in more detail, preferably with molecular methods.
Discordance between results from serological assays targeting similar immunoglobulins (IgG or IgM) against HEV was observed in this study. This observation has been reported previously [18, 19] and complicates the interpretation of cross-sectional HEV seroprevalence estimates based on results from a single assay. Preferentially, true seroprevalence estimates are adjusted for sensitivity and specificity of assays [24], but true sensitivity and specificity of assays are always unknown. Relative sensitivity and specificity of assays may be estimated from sample sets obtained from humans or animals during the acute phase of infection, but assay performance will probably be different when assays are used in a cross-sectional or cohort study. For instance, levels of HEV antibodies decay in time, making discrimination between positive and negative samples more difficult [29]. Statistical modelling is useful in such cases to estimate sensitivity and specificity of assays and subsequently true seroprevalence in the absence of a gold standard, as was applied in the present study. Ideally, the approach described in the present study should always be used to account for misclassified samples in a cross-sectional or cohort study.
The estimated seroprevalence of about 2% for the general population is consistent with most findings from developed countries [4]. Previous estimates for The Netherlands include: 0·4% of 1275 blood donors [30], 0% of 50 blood donors [31] and 3·6% of 167 individuals from the general population (M. Herremans et al., unpublished data). Such differences in estimates may be explained by misclassified results, by different study populations or differences in serological assays that were used. A proposed testing regime for low-endemic countries suggests that positive results from IgG and IgM ELISAs should be confirmed with an IgG and IgM Western blot (M. Herremans et al., unpublished data). However, although the proposed testing regime may be a simpler alternative to estimate prevalence, estimates may be biased as no correction for sensitivity and specificity is applied. Applying the proposed regime to the present data showed that seroprevalence estimates for non-swine veterinarians and the general population were overestimated, whereas the seroprevalence estimate of swine veterinarians was underestimated. Therefore, an approach as described in the present paper should always be followed.
Data from the present study did not reveal a higher number of medical consultations by swine veterinarians compared to non-swine veterinarians. One swine veterinarian did report a history of non-ABC hepatitis in the past, but results of serological assays performed on this sample in the present study were negative. The absence of a higher number of medical consultations for swine veterinarians may suggest that most encounters with HEV by veterinarians result in subclinical or mild infections.
The initial selection of 63 samples to be analysed with WB-1 was based on results from E-1, E-2 and E-3, and such a selection may affect seroprevalence estimates. However, in a Bayesian analysis, no special provision is needed for the selection of samples for WB-1, when all available data are analysed, because selection does not affect priors or (product conditional) likelihood. The priors and the kernels of the likelihood remain the same.
In this study, probabilities of detecting IgM and IgG were treated as if they were unrelated to the stage of the disease. However, it is known that IgM is a marker of acute infection, whereas IgG is a marker for past infections [32]. Theoretically, inclusion of IgM data may subsequently result in an underestimation of seroprevalence. However, underestimation of the presented seroprevalence due to inclusion of IgM assays was probably minimal, because sensitivity of IgM assays was low and specificity of IgG assays was high. To show that underestimation of the true seroprevalence did not occur, we repeated the analysis with data from IgG assays only. Minimal change in true seroprevalences and no change in conclusions were observed (data not shown). The advantage of including IgM assays in this study was to detect recent HEV infections for which an IgG response was still absent, and to increase statistical power.
In conclusion, discordance between results from different serological assays requires analysis of results from multiple assays to obtain seroprevalence estimates for HEV in industrialized countries. Presented data suggest an increased risk for swine veterinarians due to their professional exposure to swine or swine environments. Non-swine veterinarians, although not statistically significant, were found to also have a higher true seroprevalence estimate compared to the general population, which may be caused by exposure to swine (environments), albeit at a lower level than swine veterinarians, or due to other potential animal sources.
ACKNOWLEDGEMENTS
This study was funded by the Food and Product Safety Authority, within the framework of project V/330020, and the Wageningen Institute of Animal Sciences. We thank all cooperating veterinarians for their participation. Annika Haagsman and Willem Buist are acknowledged for their technical assistance.
DECLARATION OF INTEREST
None.
REFERENCES
- 1.Wong DC et al. Epidemic and endemic hepatitis in India: evidence for a non-A, non-B hepatitis virus aetiology. Lancet. 1980;2:876–879. doi: 10.1016/s0140-6736(80)92045-0. [DOI] [PubMed] [Google Scholar]
- 2.Emerson SU, Purcell RH. Hepatitis E virus. Reviews in Medical Virology. 2003;13:145–154. doi: 10.1002/rmv.384. [DOI] [PubMed] [Google Scholar]
- 3.Kumar A et al. Hepatitis E in pregnancy. International Journal of Gynaecology and Obstetrics. 2004;85:240–244. doi: 10.1016/j.ijgo.2003.11.018. [DOI] [PubMed] [Google Scholar]
- 4.Worm HC, Van der Poel WH, Brandstatter G. Hepatitis E: an overview. Microbes and Infection. 2002;4:657–666. doi: 10.1016/s1286-4579(02)01584-8. [DOI] [PubMed] [Google Scholar]
- 5.Tei S et al. Zoonotic transmission of hepatitis E virus from deer to human beings. Lancet. 2003;362:371–373. doi: 10.1016/S0140-6736(03)14025-1. [DOI] [PubMed] [Google Scholar]
- 6.Yazaki Y et al. Sporadic acute or fulminant hepatitis E in Hokkaido, Japan, may be food-borne, as suggested by the presence of hepatitis E virus in pig liver as food. Journal of General Virology. 2003;84:2351–2357. doi: 10.1099/vir.0.19242-0. [DOI] [PubMed] [Google Scholar]
- 7.Takahashi K et al. Complete or near-complete nucleotide sequences of hepatitis E virus genome recovered from a wild boar, a deer, and four patients who ate the deer. Virology. 2004;330:501–505. doi: 10.1016/j.virol.2004.10.006. [DOI] [PubMed] [Google Scholar]
- 8.Zanetti AR et al. Identification of a novel variant of hepatitis E virus in Italy. Journal of Medical Virology. 1999;57:356–360. doi: 10.1002/(sici)1096-9071(199904)57:4<356::aid-jmv5>3.0.co;2-d. [DOI] [PubMed] [Google Scholar]
- 9.Widdowson MA et al. Cluster of cases of acute hepatitis associated with hepatitis E virus infection acquired in the Netherlands. Clinical Infectious Diseases. 2003;36:29–33. doi: 10.1086/345439. [DOI] [PubMed] [Google Scholar]
- 10.Buti M et al. Sporadic cases of acute autochthonous hepatitis E in Spain. Journal of Hepatology. 2004;41:126–131. doi: 10.1016/j.jhep.2004.03.013. [DOI] [PubMed] [Google Scholar]
- 11.Mansuy JM et al. Hepatitis E in the south west of France in individuals who have never visited an endemic area. Journal of Medical Virology. 2004;74:419–424. doi: 10.1002/jmv.20206. [DOI] [PubMed] [Google Scholar]
- 12.Meng XJ et al. A novel virus in swine is closely related to the human hepatitis E virus. Proceedings of the National Academy of Sciences USA. 1997;94:9860–9865. doi: 10.1073/pnas.94.18.9860. [DOI] [PMC free article] [PubMed] [Google Scholar]
- 13.Meng XJ et al. Genetic and experimental evidence for cross-species infection by swine hepatitis E virus. Journal of Virology. 1998;72:9714–9721. doi: 10.1128/jvi.72.12.9714-9721.1998. [DOI] [PMC free article] [PubMed] [Google Scholar]
- 14.Hsieh SY et al. Identity of a novel swine hepatitis E virus in Taiwan forming a monophyletic group with Taiwan isolates of human hepatitis E virus. Journal of Clinical Microbiology. 1999;37:3828–3834. doi: 10.1128/jcm.37.12.3828-3834.1999. [DOI] [PMC free article] [PubMed] [Google Scholar]
- 15.Drobeniuc J et al. Hepatitis E virus antibody prevalence among persons who work with swine. Journal of Infectious Diseases. 2001;184:1594–1597. doi: 10.1086/324566. [DOI] [PubMed] [Google Scholar]
- 16.Meng XJ et al. Prevalence of antibodies to hepatitis E virus in veterinarians working with swine and in normal blood donors in the United States and other countries. Journal of Clinical Microbiology. 2002;40:117–122. doi: 10.1128/JCM.40.1.117-122.2002. [DOI] [PMC free article] [PubMed] [Google Scholar]
- 17.Withers MR et al. Antibody levels to hepatitis E virus in North Carolina swine workers, non-swine workers, swine, and murids. American Journal of Tropical Medicine and Hygiene. 2002;66:384–388. doi: 10.4269/ajtmh.2002.66.384. [DOI] [PubMed] [Google Scholar]
- 18.Ghabrah TM et al. Comparison of tests for antibody to hepatitis E virus. Journal of Medical Virology. 1998;55:134–137. [PubMed] [Google Scholar]
- 19.Mast EE et al. Evaluation of assays for antibody to hepatitis E virus by a serum panel. Hepatitis E Virus Antibody Serum Panel Evaluation Group. Hepatology. 1998;27:857–861. doi: 10.1002/hep.510270331. [DOI] [PubMed] [Google Scholar]
- 20.Enoe C, Georgiadis MP, Johnson WO. Estimation of sensitivity and specificity of diagnostic tests and disease prevalence when the true disease state is unknown. Preventive Veterinary Medicine. 2000;45:61–81. doi: 10.1016/s0167-5877(00)00117-3. [DOI] [PubMed] [Google Scholar]
- 21.Hui SL, Walter SD. Estimating the error rates of diagnostic tests. Biometrics. 1980;36:167–171. [PubMed] [Google Scholar]
- 22.Joseph L, Gyorkos TW, Coupal L. Bayesian estimation of disease prevalence and the parameters of diagnostic tests in the absence of a gold standard. American Journal of Epidemiology. 1995;141:263–272. doi: 10.1093/oxfordjournals.aje.a117428. [DOI] [PubMed] [Google Scholar]
- 23.Widdowson MA et al. Detection of serum antibodies to bovine norovirus in veterinarians and the general population in the Netherlands. Journal of Medical Virology. 2005;76:119–128. doi: 10.1002/jmv.20333. [DOI] [PubMed] [Google Scholar]
- 24.Thrusfield M. Veterinary Epidemiology. 2nd edn. Oxford: Blackwell Science; 1995. p. 483. , pp. [Google Scholar]
- 25.Engel B et al. Estimation of sensitivity and specificity of three conditionally dependent diagnostic tests in the absence of a gold standard. Journal of Agricultural, Biological, and Environmental Statistics. 2006;11:360–380. [Google Scholar]
- 26.Spiegelhalter D 2004. http://www.mrc-bsu.cam.ac.uk/bugs. http://www.mrc-bsu.cam.ac.uk/bugs Winbugs user manual. Version 1.4.1, ). Accessed 17 January 2005.
- 27.Olsen B et al. Unexpected high prevalence of IgG-antibodies to hepatitis E virus in Swedish pig farmers and controls. Scandinavian Journal of Infectious Diseases. 2006;38:55–58. doi: 10.1080/00365540500321470. [DOI] [PubMed] [Google Scholar]
- 28.Rutjes SA et al. Increased hepatitis E virus prevalence on Dutch pig farms from 33 to 55% by using appropriate internal quality controls for RT-PCR. Journal of Virological Methods 2007 doi: 10.1016/j.jviromet.2007.01.030. . Published online: 23 February . . doi: [DOI] [PubMed] [Google Scholar]
- 29.Mathur P et al. Sero-epidemiology of hepatitis E virus (HEV) in urban and rural children of North India. Indian Pediatrics. 2001;38:461–475. [PubMed] [Google Scholar]
- 30.Zaaijer HL et al. Hepatitis E in The Netherlands: imported and endemic. Lancet. 1993;341:826. doi: 10.1016/0140-6736(93)90599-c. [DOI] [PubMed] [Google Scholar]
- 31.Herremans M et al. Swine-like hepatitis E viruses are a cause of unexplained hepatitis in the Netherlands. Journal of Viral Hepatitis. 2007;14:140–146. doi: 10.1111/j.1365-2893.2006.00786.x. [DOI] [PubMed] [Google Scholar]
- 32.Roitt IM, Brostoff J, Male DK. Immunology. 4th edn. London: Mosby; 1995. p. 416. , pp. [Google Scholar]