

SUMMARY
Attempts to explain the clear seasonality of rotavirus infections have been made by relating disease incidence to climate factors; however, few studies have disentangled the effects of weather from other factors that might cause seasonality. We investigated the relationships between hospital visits for rotavirus diarrhoea and temperature, humidity and river level, in Dhaka, Bangladesh, using time-series analysis adjusting for other confounding seasonal factors. There was strong evidence for an increase in rotavirus diarrhoea at high temperatures, by 40·2% for each 1°C increase above a threshold (29°C). Relative humidity had a linear inverse relationship with the number of cases of rotavirus diarrhoea. River level, above a threshold (4·8 m), was associated with an increase in cases of rotavirus diarrhoea, by 5·5% per 10-cm river-level rise. Our findings provide evidence that factors associated with high temperature, low humidity and high river-level increase the incidence of rotavirus diarrhoea in Dhaka.
INTRODUCTION
Rotavirus remains the leading cause of childhood diarrhoea worldwide. About 40% of the hospitalizations for childhood diarrhoea worldwide are attributable to rotavirus and more than 0·6 million children aged <5 years die every year from rotavirus infection, mainly in developing countries [1]. Rotavirus diarrhoea peaks in winter and is rarely identified in summer in temperate regions, for example, the United States [2], Japan [3, 4], northern Asian regions [5], temperate regions in Australia [6] and Europe [7]. By contrast, it is detected all year round with less obvious seasonality in the tropics, for example, in Bangladesh [8], southern Asian regions [5], Bahrain [9] and Costa Rica [10]. A study using data from 34 studies from 23 countries on six continents showed that the seasonality of rotavirus diarrhoea is less distinct in the areas within 10° of latitude from the equator [7].
Attempts to explain these findings have been made by relating disease incidence to climate factors such as temperature, humidity and rainfall, but no clear conclusions could be drawn. In Japan, Konno et al. [3] reported that rotavirus infection was associated with lower temperature, but not with relative humidity. In the United States, rotavirus hospitalizations were more common after cold or dry (small amount of rainfall) months than after warm or wet months [11]. Indoor crowding and low indoor relative humidity in the cold months was suggested to promote transmission of rotavirus [11]. However, these studies inferred this relation from the increased number of rotavirus infections in cold or dry months, and it may be a consequence of other environmental or behavioural factors that are more (or less) often observed in the cold or dry months. Potential mutual confounding between weather factors (e.g. temperature and humidity) has also not been considered. In Bangladesh, high river level has been suggested as an explanation for a seasonal peak in rotavirus infections during the monsoon [12].
In this study, we investigated the relationship between short-term variations in ambient temperature, relative humidity and river level and the number of hospital visits owing to rotavirus infections in Dhaka, Bangladesh, using time-series methodology controlling for mutual confounding and for seasonal patterns of unknown cause.
METHODS
The primary outcome in this study is the weekly number of patients with rotavirus diarrhoea visiting the International Centre for Diarrhoeal Disease Research, Bangladesh (ICDDR,B) Dhaka Hospital. The ICDDR,B Hospital serves an urban population of about 10 million individuals and provides free treatment to more than 100 000 patients with diarrhoea each year. Every 50th patient attending the hospital for treatment of diarrhoea was enrolled in the surveillance system since 1996. For all patients enrolled in surveillance, faecal samples were collected and tested for rotavirus antigen by an enzyme-linked immunosorbent assay modelled after the Dakopatts commercial kit (Dakopatts, Copenhagen, Denmark). We abstracted individual information on the date of hospital visit and the pathogens identified from each stool specimen during a 6-year period (January 1996 to December 2001). A patient was classified as having rotavirus diarrhoea when rotavirus antigen was identified in the stool specimen. When V. cholerae was identified at the same time, the case was excluded from the analysis (n=199, 6% of all rotavirus-positive patients).
Daily maximum and minimum temperatures and relative humidity in Dhaka were obtained from the Bangladesh Meteorological Department. Daily average temperatures were computed as the mean of the daily maximum and minimum values. The daily river level of the Brigonga River at Mill Barrack in Dhaka was recorded by the Bangladesh Water Development Board. The weekly means for average temperature, relative humidity and river level were calculated from the daily records.
Statistical analysis
We examined the relationships between the weekly number of rotavirus diarrhoea cases and temperature, relative humidity and river level, using generalized linear Poisson regression models allowing for overdispersion. To account for seasonal patterns of rotavirus diarrhoea not directly due to these weather factors, Fourier terms with annual periodicity, up to the sixth harmonic, were introduced into the model. These are sine-cosine pairs, which together can fit any smooth pattern repeated each year [13]. Indicator variables for the years of the study were incorporated into the model to allow for long-term trends and other variations between years. Having adjusted for these seasonal patterns and between-year variations, the short-term associations between climate variables and the number of rotavirus diarrhoea cases can be investigated. An indicator variable for public holidays was incorporated into the model to account for an artificial drop in hospital visits during these weeks. Rainfall was also initially considered, but as there was no evidence that it was associated with the number of rotavirus diarrhoea cases (P>0·1), it was not included in the final analysis. To allow for autocorrelations, an autoregressive term at order 1 was incorporated into the models [14].
We considered lags (delays in effect) of up to 4 weeks from our previous study [15] and other existing literature [16, 17]. In initial analyses we fitted natural cubic splines (3 d.f.) [18] to means over lags of 0–4 weeks for (a) mean temperature (b) relative humidity and (c) river level. All three splines were included simultaneously in the model to control for potential mutual confounding.
In summary, the model took the following form:
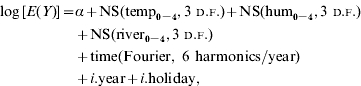 |
where E(Y) is the expected weekly case count, ‘temp’, ‘hum’ and ‘river’ indicate average weekly temperature, relative humidity and river level, respectively. NS indicates a natural cubic spline function, Fourier represents Fourier (trigonometric) terms, i.year represents indicator variables of year and i.holiday represents an indicator variable for public holidays.
As the plots of the smoothed relationships between temperature or river level and the number of rotavirus cases suggested log-linear associations above a threshold, we then fitted linear threshold models, i.e. models that assume a log-linear increase in risk above a threshold and no increase in risk below the threshold [19]. The choice of threshold was based on maximum-likelihood estimation for the temperature or river level over a grid of all possible integer values within a range indicated on the weather–rotavirus diarrhoea graphs. Likelihood profile confidence intervals (CIs) for each threshold were calculated as the thresholds for which deviance of the model was 3·84 more than the minimum. Because the plots of the smoothed relationships with humidity suggested a broadly linear negative relationship, we then fitted a linear model to estimate the effect (slope) [19]. With the simple linear model we then examined lag effects in more detail, by fitting linear unconstrained distributed lag models, comprising terms for humidity, temperature and river level at each lag from 0 to 4 weeks [19]. The simple linear-threshold model also allowed investigation of the modification of the effect of temperature, humidity and river level between seasons by including interaction terms in the models. The likelihood ratio test was used to test the evidence for the interaction. The season was categorized as summer (March–May), monsoon (June–September) or winter (October–February).
In order to investigate whether the results were sensitive to the levels of control for seasonal patterns, the analyses were repeated using Fourier terms up to the 3rd and 12th harmonics per year. All statistical analyses were carried out using stata 9.0 (Stata Corporation, College Station, TX, USA).
RESULTS
Out of 13 983 hospital visits (one in every 50) for all cause diarrhoea from 1996 to 2001, there were 3115 rotavirus diarrhoea cases, of which 62·5% were <1-year-old and 26·4% were aged between 1 and 2 years. Males (60·7%) were more numerous than females (39·3%). Descriptive statistics for the number of rotavirus diarrhoea cases and meteorological and river-level data are displayed in the Table. The subtropical monsoon climate is clear from the moderately warm temperatures, and high humidity. Temperatures rose rapidly in March, and the average mean temperature was about 29°C during the summer and monsoon seasons (April–September) (Fig. 1). Relative humidity was lowest in March, and increased towards the monsoon season. Rotavirus diarrhoea was common in winter with a lower peak in the middle of the monsoon. There was thus little obvious tracking of seasonal patterns of rotavirus diarrhoea incidence with humidity or temperature. River level peaked in the late monsoon season. River-level data are missing from April 1997 to March 1998.
Table.
Distribution of the weekly numbers of rotavirus diarrhoea cases in the ICDDR,B hospital, and meteorological data in Dhaka, 1996–2001
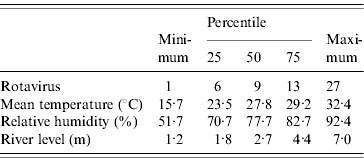
Fig. 1.

Seasonal variations of (a) number of rotavirus diarrhoea patients, (b) relative humidity (RH), (c) temperature and (d) river-level data in Dhaka, 1996–2001.
Relationship with temperature
The relationships between the relative risk of hospital visits for rotavirus diarrhoea and temperature are shown in Figure 2. In the crude relationship, the potential risk of rotavirus diarrhoea decreased as temperature increased from the coldest temperatures. The risk began to rise as the temperature increased above ~28°C, producing a ⋃-shaped relation. However, there was no evidence for increased risk at low temperatures after adjustment for humidity, river level, seasonal patterns, between-year variations and public holidays, while an increase in risk at the highest temperatures remained. The estimated threshold was 29°C (95% CI 28–30). For a 1°C increase above the threshold, the number of rotavirus diarrhoea cases increased by 40·2% (95% CI 19·4–64·6). The effect of high temperature was significant at lags 0 and 3 in the distributed lag model, while little effect was observed for any of the other lags (Fig. 3).
Fig. 2.

Relationship between relative risk (RR) of rotavirus diarrhoea (scaled to the mean weekly number of rotavirus diarrhoea cases) and average temperature over lags of 0–4 weeks (shown as a 3 d.f. natural cubic spline). (a) Crude relationship and (b) relationship adjusted for humidity, river level, seasonal patterns, between-year variations and public holidays. The centre line in each graph shows the estimated spline curve, and the upper and lower lines represent the 95% confidence limits.
Fig. 3.

Percent change (and 95% CIs) for high temperature effects of varying periods of risks on rotavirus diarrhoea (unconstrained distributed lag models). Percent change shows the change in the number of the cases for every 1°C increase above the threshold (29°C).
Relationship with humidity
The relationships between the relative risk of hospital visits for rotavirus diarrhoea and humidity are shown in Figure 4. In the crude relationship, there was no obvious pattern observed. After adjusting for temperature, seasonal patterns, between-year variations and public holidays, the pattern shows a linear negative slope with humidity, which was confirmed by fitting a linear model (P=0·05 by Wald test). For a 1% decrease in humidity, the number of rotavirus diarrhoea cases increased by 2·6% (95% CI 0·0–5·3). The distributed lag model showed that there was suggestive evidence for an effect of humidity at lag 0, and this effect decreased to null thereafter (Fig. 5).
Fig. 4.

Relationship between relative risk (RR) of rotavirus diarrhoea (scaled to the mean weekly number of rotavirus diarrhoea) and average humidity over lags of 0–4 weeks (shown as a 3 d.f. natural cubic spline). (a) Crude relationship and (b) relationship adjusted for temperature, river level, seasonal patterns, between-year variations and public holidays. The centre line in each graph shows the estimated spline curve, and the upper and lower lines represent the 95% confidence limits.
Fig. 5.

Percent change (and 95% CIs) for humidity effects of varying periods of risks on rotavirus diarrhoea (unconstrained distributed lag models). Percent change shows the change in the number of the cases for every 1% decrease in relative humidity.
Relationship with river level
The relationship between the relative risk of hospital visits for rotavirus diarrhoea and river level is shown in Figure 6. In the crude relationship, there appeared to be an increase in the number of cases of rotavirus diarrhoea when the river level was higher than 4–5 m. This pattern was similar (with slight loss of precision) after adjusting for temperature, relative humidity, seasonal patterns, between-year variations and public holidays. The estimated threshold was 4·8 m (95% CI 4·2–5·1). For each 10-cm increase above the threshold, the number of hospital visits for rotavirus diarrhoea increased by 5·5% (95% CI 3·2–7·8). The distributed lag model showed that there was suggestive evidence for an effect of river level at lag 1, while little effect was observed for any of the other lags (Fig. 7).
Fig. 6.

Relationship between relative risk (RR) of rotavirus diarrhoea (scaled against the mean weekly number of rotavirus diarrhoea) and average river level over lags of 0–4 weeks (shown as a 3 d.f. natural cubic spline). (a) Crude relationship and (b) relationship adjusted for humidity, temperature, seasonal patterns, between-year variations and public holidays. The centre line in each graph shows the estimated spline curve, and the upper and lower lines represent the 95% confidence limits.
Fig. 7.

Percent change (and 95% CIs) for high river-level effects of varying periods of risks on rotavirus diarrhoea (unconstrained distributed lag models). Percent change shows the change in the number of the cases for every 10 cm increase above the threshold (4·8 m).
The effect of temperature on rotavirus infections differed across seasons (P=0·02), while the effects of humidity and river level did not. When in sensitivity analyses the degree of control for seasonal patterns was halved (three harmonics) or doubled (12 harmonics), the estimates of the effect of temperature, humidity and river level changed little (results not shown).
DISCUSSION
In Bangladesh, there appears to be a significant positive association between the number of hospital visits for rotavirus diarrhoea and temperature above a threshold after adjusting for potential confounding by humidity, river level, seasonal patterns, between-year variations and public holidays. An inverse association between relative humidity and the number of rotavirus infections was also observed. Higher river level was associated with increased risk of rotavirus infections independently of these weather factors.
There have been many reports that have attempted to identify an association between the incidence of rotavirus infections and weather factors. In temperate regions, a peak in rotavirus infections is observed in the colder and drier months of the year [20]. In tropical and subtropical settings as well, the peak of rotavirus infections occurs in cool dry seasons, although the seasonality is less obvious in some developing countries. Therefore, lower air temperature, especially in combination with a dry atmosphere, has been suggested to increase the number of rotavirus infections [20]. However, previous studies did not take into account potential confounding due to seasonally varying factors other than weather factors, or mutual confounding between weather factors, which are likely to vary between regions. For example, Konno et al. [3] reported that there was a higher number of rotavirus diarrhoea cases in the months of low temperature in winter, but no association was found with relative humidity in Yamagata, Japan. The discrepancy in the results of association with low temperature could be due to the effect of seasonally varying factors, which was controlled in the current study but not in previous studies. The possibility that previous observations may be confounded is supported by the results in this study unadjusted for seasonal patterns, which found a significant negative association between temperature and the number of cases. Similarly, in the unadjusted analysis, no association was found between humidity and the number of the cases, but a negative association appeared after adjusting for seasonal patterns.
The seasonal pattern of rotavirus diarrhoea cases may be a consequence of unmeasured factors apart from weather factors. These factors include seasonal patterns linked to human activity and environmental factors other than weather. In Washington, DC, more children were hospitalized for rotavirus gastroenteritis after a month of cold or dry weather than after a matched calendar month of warm or wet weather [11]. In that study, temperature and humidity was not mutually adjusted, and this could also be a reason for the discrepancy between the results in Washington and those of this study.
The absence of evidence in this study for a link between low temperature and increasing number of rotavirus diarrhoea cases contrasts with findings from some laboratory studies. The survival of human rotavirus in faeces was longer under lower temperatures (range 4–37°C) than higher temperatures, in a laboratory setting [21]. The survival of bovine rotavirus in water droplets in the air was also longer at lower temperatures, regardless of relative humidity [22]. These studies, however, were conducted under laboratory settings and hence the results may not be applicable to the real environment. The biological plausibility of a potential high temperature effect and its lag structure (significant at lags 0 and 3 weeks) is not clear. As the most high-temperature weeks are concentrated during the monsoon season, and as we obtained evidence for a modification of temperature effects across seasons in this study, the effect of temperature may be exerted through complex temperature-dependent pathways in the monsoon season. Further research using the same approach in different climate conditions, for example, in temperate regions, could contribute deeper insight into the effects of temperature.
The finding of a negative association between cases of rotavirus diarrhoea and humidity is more consistent with laboratory evidence. Relative humidity may affect the survival of rotaviruses in air and on fomites and environmental surfaces. At low or medium relative humidity (13–55%), human rotavirus can remain viable on plastic, glass and stainless steel for more than 10 days at room temperature [21, 23]. Raising the relative humidity to 80% results in a rapid loss of infectivity [23]. Survival of human rotavirus in air at 20°C was best at 50% relative humidity, with a half-life of 44 h; at low (30%) and high (80%) relative humidity, the half-life was decreased to 24·4 h and 3·8 h, respectively [24]. Thus, in the range of relative humidity in this study (52–92%), the survival of human rotavirus increased with lower relative humidity in the fixed temperature in the laboratory setting. Dry conditions would also tend to encourage the formation of virus-laden dust and droplet nuclei [25]. However, no direct evidence shows the spread of rotavirus gastroenteritis through these pathways, and it is not clear whether the ability of rotavirus to survive in the environment is the basis for the inverse association between relative humidity and the number of rotavirus infections found in this study. The short lag of the effect of relative humidity (lag 0) is broadly in accordance with the short incubation period of rotavirus (~24–72 h) [26] even taking into account the lag owing to visiting the hospital after symptoms appeared (73% of rotavirus patients visited the hospital within 3 days after symptoms appeared).
The independent effect of high river level on the increased risk of rotavirus infections could be due to exposure to flood water. In Bangladesh, post-flood increases in rotavirus diarrhoea have been reported [27, 28]. Floods adversely affect water sources and supply systems as well as sewerage and waste disposal systems [29]. Sewage, which is known to contain large numbers of infectious rotavirus particles [30], may be disposed of in raw form and infectious rotaviruses can be recovered from sewage-polluted surface water [31]. There have also been reports of outbreaks of waterborne rotavirus gastroenteritis [20]. For example, river water used for bathing and for washing utensils was suspected of being involved in virus spread in the outbreak of rotavirus gastroenteritis in Brazil [32]. A faecally contaminated water supply was the primary vehicle in an outbreak of rotavirus gastroenteritis with 12 000 cases in China [33]. Survival of rotavirus in water has also been investigated. Simian rotavirus SA-11 was shown to survive in experimentally contaminated fresh and estuarine waters for several days at 20°C, especially in water heavily polluted with sewage [34]. Studies with rotavirus isolated from humans showed survival for several weeks at either 20°C or 4°C in river water [35]. Infectious particles of rotavirus have been recovered from a variety of natural waters including rivers, lakes and groundwater [36]. The results of this study support the idea that water or factors associated with river level could have been a frequent transmission route of rotavirus in Bangladesh.
Clarifying the effects of climate on the spread of rotavirus diarrhoea could contribute to improvements in the precision of the WHOs estimates for diarrhoeal disease burden attributable to global climate change [37], which did not consider the relative contribution of different pathogens to overall diarrhoea incidence despite the fact that their climate sensitivities are likely to be different. Because the proportion of rotavirus diarrhoea among all hospitalized diarrhoea varies from 24% to 45% between world regions [5, 38–40], the results could also improve estimates of regional health risks due to diarrhoeal disease associated with global climate change.
A strength of this dataset is the relative completeness of coverage of the population in Dhaka. The hospital serves an urban population of about 10 million individuals and provides free treatment to more than 100 000 cases of diarrhoea each year. Therefore, the data used in this study are reasonably representative of the underlying severe diarrhoeal morbidity of the population in Dhaka. Less severe cases would be less likely to be included, but this does not pose a threat to the validity of the comparisons over time, which is the subject of this study.
However, this study is not free from biases. Although cases excluded because the stool sample also included V. cholerae were most likely to have attended the hospital because of the cholera, those that would have attended in the absence of cholera should have been included. It was impossible to identify these cases, however, and the total of such comorbidity was small. There is also the possibility of residual confounding, although the robustness of the results to varying degrees of seasonal control was reassuring.
There are important uncertainties related to the extrapolation of the relationships in this study to others with different climate and geography. In particular, the observed association between river level and the number of rotavirus infections may be specific to places characterized by low land with bodies of water that are vulnerable to flooding. The association may also be greatly dependent on the degree of hygiene and sanitation in an area. Therefore, these findings may not pertain to other places.
In this study, weather factors were found to explain departures of the number of rotavirus diarrhoea cases from the usual seasonal pattern. This does not mean that these factors can explain the usual seasonal patterns themselves. The transmission of rotavirus is complex and multifactorial, involving both host and environmental factors. Some of these environmental factors have not been considered in this study, which suggests that temperature, relative humidity and river level might be important environmental determinants of rotavirus infectivity. Further work to clarify the role of weather in the seasonality of rotavirus infections in Bangladesh and elsewhere would be of interest.
ACKNOWLEDGEMENTS
We gratefully acknowledge the support of the ICDDR,B. This study was supported by Daiwa Foundation Small Grants. M. H. was supported by the Foundation for Advanced Studies on International Development and GlaxoSmithKline.
DECLARATION OF INTEREST
None.
REFERENCES
- 1.Parashar UD et al. Global illness and deaths caused by rotavirus disease in children. Emerging Infectious Diseases. 2003;9:565–572. doi: 10.3201/eid0905.020562. [DOI] [PMC free article] [PubMed] [Google Scholar]
- 2.Glass RI et al. The epidemiology of rotavirus diarrhea in the United States: surveillance and estimates of disease burden. Journal of Infectious Diseases. 1996;174:S5–11. doi: 10.1093/infdis/174.supplement_1.s5. (Suppl. 1): [DOI] [PubMed] [Google Scholar]
- 3.Konno T et al. Influence of temperature and relative humidity on human rotavirus infection in Japan. Journal of Infectious Diseases. 1983;147:125–128. doi: 10.1093/infdis/147.1.125. [DOI] [PubMed] [Google Scholar]
- 4.Nakagomi T et al. Incidence and burden of rotavirus gastroenteritis in Japan, as estimated from a prospective sentinel hospital study. Journal of Infectious Diseases. 2005;192:S106–110. doi: 10.1086/431503. (Suppl. 1): [DOI] [PubMed] [Google Scholar]
- 5.Bresee J et al. First report from the Asian Rotavirus Surveillance Network. Emerging Infectious Diseases. 2004;10:988–995. doi: 10.3201/eid1006.030519. [DOI] [PMC free article] [PubMed] [Google Scholar]
- 6.Bishop RF et al. Epidemiological patterns of rotaviruses causing severe gastroenteritis in young children throughout Australia from 1993 to 1996. Journal of Clinical Microbiology. 2001;39:1085–1091. doi: 10.1128/JCM.39.3.1085-1091.2001. [DOI] [PMC free article] [PubMed] [Google Scholar]
- 7.Cook SM et al. Global seasonality of rotavirus infections. Bulletin of the World Health Organization. 1990;68:171–177. [PMC free article] [PubMed] [Google Scholar]
- 8.Stoll BJ et al. Surveillance of patients attending a diarrhoeal disease hospital in Bangladesh. British Medical Journal (Clinical Research Edition) 1982;285:1185–1188. doi: 10.1136/bmj.285.6349.1185. [DOI] [PMC free article] [PubMed] [Google Scholar]
- 9.Dutta SR et al. Epidemiology of rotavirus diarrhoea in children under five years in Bahrain. International Journal of Epidemiology. 1990;19:722–727. doi: 10.1093/ije/19.3.722. [DOI] [PubMed] [Google Scholar]
- 10.Hieber JP et al. Comparison of human rotavirus disease in tropical and temperate settings. American Journal of Diseases of Children. 1978;132:853–858. doi: 10.1001/archpedi.1978.02120340029004. [DOI] [PubMed] [Google Scholar]
- 11.Brandt CD et al. Rotavirus gastroenteritis and weather. Journal of Clinical Microbiology. 1982;16:478–482. doi: 10.1128/jcm.16.3.478-482.1982. [DOI] [PMC free article] [PubMed] [Google Scholar]
- 12.Rahman M et al. Prevalence of G2P[4] and G12P[6] Rotavirus, Bangladesh. Emerging Infectious Diseases. 2007;13:18–24. doi: 10.3201/eid1301.060910. [DOI] [PMC free article] [PubMed] [Google Scholar]
- 13.Stolwijk AM, Straatman H, Zielhuis GA. Studying seasonality by using sine and cosine functions in regression analysis. Journal of Epidemiology and Community Health. 1999;53:235–238. doi: 10.1136/jech.53.4.235. [DOI] [PMC free article] [PubMed] [Google Scholar]
- 14.Brumback B et al. Transitional regression models, with application to environmental time series. Journal of the American Statistical Association. 2000;95:16–27. [Google Scholar]
- 15.Hashizume Met al. Association between climate variability and hospital visits for non-cholera diarrhoea in Bangladesh: effects and vulnerable groups. International Journal of Epidemiology (in press). [DOI] [PubMed]
- 16.Checkley W et al. Effect of El Nino and ambient temperature on hospital admissions for diarrhoeal diseases in Peruvian children. Lancet. 2000;355:442–450. doi: 10.1016/s0140-6736(00)82010-3. [DOI] [PubMed] [Google Scholar]
- 17.D'Souza RM et al. Does ambient temperature affect foodborne disease? Epidemiology. 2004;15:86–92. doi: 10.1097/01.ede.0000101021.03453.3e. [DOI] [PubMed] [Google Scholar]
- 18.Durrleman S, Simon R. Flexible regression models with cubic splines. Statistics in Medicine. 1989;8:551–561. doi: 10.1002/sim.4780080504. [DOI] [PubMed] [Google Scholar]
- 19.Armstrong B. Models for the relationship between ambient temperature and daily mortality. Epidemiology. 2006;17:624–631. doi: 10.1097/01.ede.0000239732.50999.8f. [DOI] [PubMed] [Google Scholar]
- 20.Ansari SA, Springthorpe VS, Sattar SA. Survival and vehicular spread of human rotaviruses: possible relation to seasonality of outbreaks. Reviews of Infectious Diseases. 1991;13:448–461. doi: 10.1093/clinids/13.3.448. [DOI] [PubMed] [Google Scholar]
- 21.Moe K, Shirley JA. The effects of relative humidity and temperature on the survival of human rotavirus in faeces. Archives of Virology. 1982;72:179–186. doi: 10.1007/BF01348963. [DOI] [PubMed] [Google Scholar]
- 22.Moe K, Harper GJ. The effect of relative humidity and temperature on the survival of bovine rotavirus in aerosol. Archives of Virology. 1983;76:211–216. doi: 10.1007/BF01311105. [DOI] [PubMed] [Google Scholar]
- 23.Sattar SA et al. Institutional outbreaks of rotavirus diarrhoea: potential role of fomites and environmental surfaces as vehicles for virus transmission. Journal of Hygiene. 1986;96:277–289. doi: 10.1017/s0022172400066055. [DOI] [PMC free article] [PubMed] [Google Scholar]
- 24.Ijaz MK et al. Effect of relative humidity, atmospheric temperature, and suspending medium on the airborne survival of human rotavirus. Canadian Journal of Microbiology. 1985;31:681–685. doi: 10.1139/m85-129. [DOI] [PubMed] [Google Scholar]
- 25.Brandt CD et al. Rotavirus gastroenteritis and weather. Journal of Clinical Microbiology. 1982;16:478–482. doi: 10.1128/jcm.16.3.478-482.1982. [DOI] [PMC free article] [PubMed] [Google Scholar]
- 26.Chin J. Control of Communicable Diseases Manual. 17th edn. Washington, DC: American Public Health Association; 2000. [Google Scholar]
- 27.Ahmed MU et al. Analysis of human rotavirus strains prevailing in Bangladesh in relation to nationwide floods brought by the 1988 monsoon. Journal of Clinical Microbiology. 1991;29:2273–2279. doi: 10.1128/jcm.29.10.2273-2279.1991. [DOI] [PMC free article] [PubMed] [Google Scholar]
- 28.Fun BN et al. Rotavirus-associated diarrhea in rural Bangladesh: two-year study of incidence and serotype distribution. Journal of Clinical Microbiology. 1991;29:1359–1363. doi: 10.1128/jcm.29.7.1359-1363.1991. [DOI] [PMC free article] [PubMed] [Google Scholar]
- 29.Parker DJ, Thompson PM. Floods in Africa: Vulnerability, Impacts and Mitigation. London: Routledge; 2000. [Google Scholar]
- 30.Smith EM, Gerba CP. Development of a method for detection of human rotavirus in water and sewage. Applied and Environmental Microbiology. 1982;43:1440–1450. doi: 10.1128/aem.43.6.1440-1450.1982. [DOI] [PMC free article] [PubMed] [Google Scholar]
- 31.Hejkal TW, Smith EM, Gerba CP. Seasonal occurrence of rotavirus in sewage. Applied and Environmental Microbiology. 1984;47:588–590. doi: 10.1128/aem.47.3.588-590.1984. [DOI] [PMC free article] [PubMed] [Google Scholar]
- 32.Linhares AC et al. An outbreak of rotavirus diarrhea among a nonimmune, isolated South American Indian community. American Journal of Epidemiology. 1981;113:703–710. doi: 10.1093/oxfordjournals.aje.a113151. [DOI] [PubMed] [Google Scholar]
- 33.Hung T et al. Waterborne outbreak of rotavirus diarrhoea in adults in China caused by a novel rotavirus. Lancet. 1984;1:1139–1142. [PubMed] [Google Scholar]
- 34.Hurst CJ, Gerba CP. Stability of simian rotavirus in fresh and estuarine water. Applied and Environmental Microbiology. 1980;39:1–5. doi: 10.1128/aem.39.1.1-5.1980. [DOI] [PMC free article] [PubMed] [Google Scholar]
- 35.Raphael RA, Sattar SA, Springthorpe VS. Long-term survival of human rotavirus in raw and treated river water. Canadian Journal of Microbiology. 1985;31:124–128. doi: 10.1139/m85-024. [DOI] [PubMed] [Google Scholar]
- 36.Deetz TR et al. Occurrence of rota- and enteroviruses in drinking and environmental water in a developing nation. Water Research. 1984;18:567–571. [Google Scholar]
- 37.World Health Organization. Comparative Quantification of Health Risks. Global and Regional Burden of Disease Attribution to Selected Major Risk Factors, volume 1. Geneva: WHO; 2004. [Google Scholar]
- 38.Cunliffe NA et al. Epidemiology of rotavirus diarrhoea in Africa: a review to assess the need for rotavirus immunization. Bulletin of the World Health Organization. 1998;76:525–537. [PMC free article] [PubMed] [Google Scholar]
- 39.Kane EM et al. The epidemiology of rotavirus diarrhea in Latin America. Anticipating rotavirus vaccines. Pan American Journal of Public Health. 2004;16:371–377. doi: 10.1590/s1020-49892004001200002. [DOI] [PubMed] [Google Scholar]
- 40.The Paediatric ROTavirus European CommitTee (PROTECT) The paediatric burden of rotavirus disease in Europe. Epidemiology and Infection. 2006;134:908–916. doi: 10.1017/S0950268806006091. [DOI] [PMC free article] [PubMed] [Google Scholar]