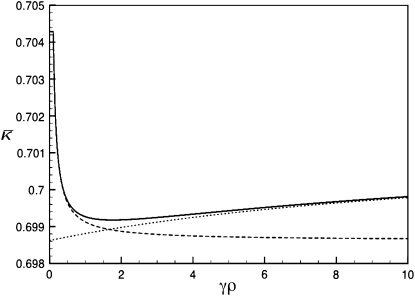
Figure 4.—
Plots of  vs. γρ for κD = 10, μ = 0.4, αv = 0.6, αc = αr = 0.2. The plot marked with the solid line was obtained by numerically solving for
  using fixed-point iteration. The dashed line was obtained by using the infinite κD, finite γρ expression for
  , while the dotted line was obtained by using the infinite κD, fixed γρ/κD expression for
  .
.

