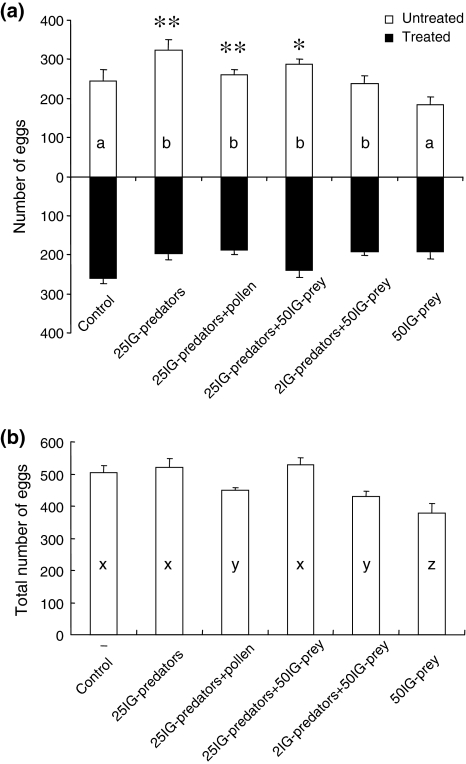
Fig. 3.
The distribution and total number of eggs laid by IG-prey during 48 h. The eggs of IG-prey were counted on two connected clean patches (control), or a clean patch connected to a patch treated with IG-predators. See legend to Fig. 2 for further explanation. a The distribution of the eggs over the two patches per treatment. Shown are the average number (+SEM) of eggs on the treated (black bars extending downwards) and untreated patch (white bars extending upwards). Asterisks indicate significant differences in the oviposition between the clean patch and the treated patch within each treatment: *P < 0.05, **P < 0.01. Differences in distribution of eggs among treatments are indicated with different letters inside the bars. b The average (+SEM) total number of eggs on both patches per treatment. Differences in total numbers of eggs among treatments are indicated with different letters inside the bars

