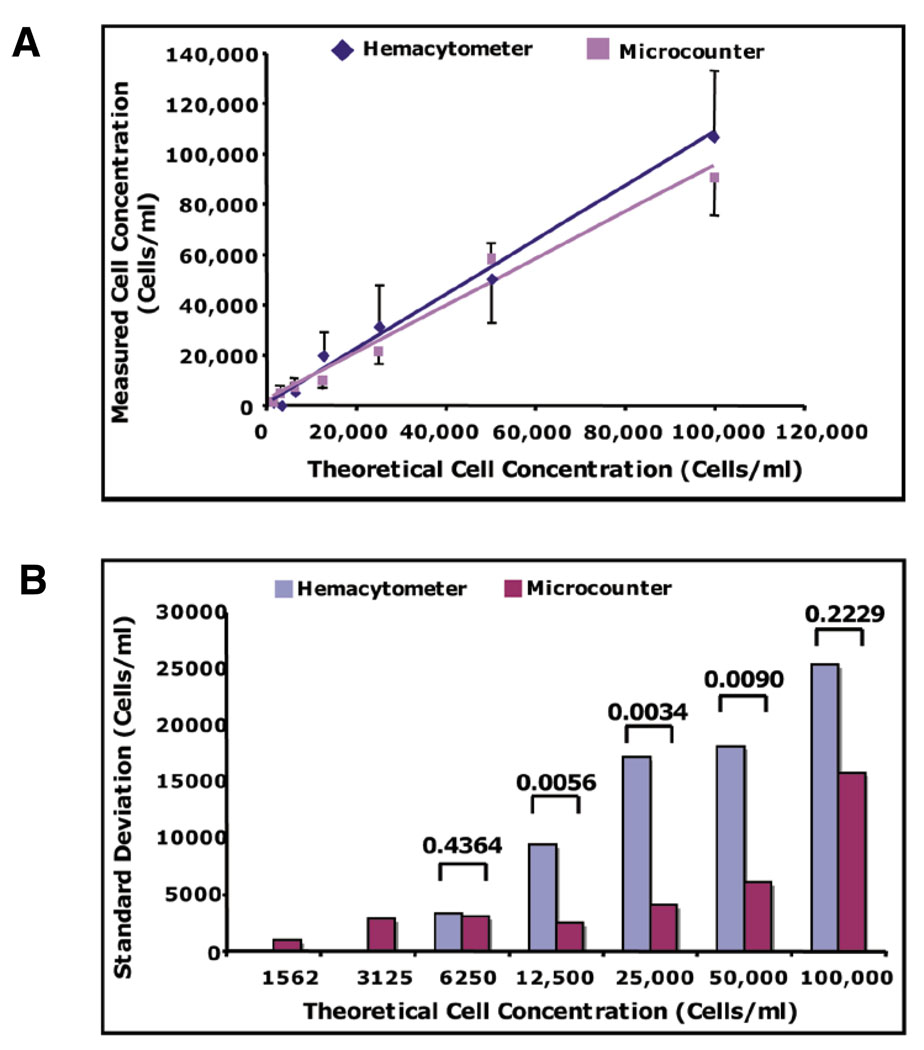
Figure 2. The microcounter device is able to detect smaller concentrations of cells with significantly less variance than a hemacytometer.
(A) Graphical depiction of the mean measured cell concentrations of 1520–100,000 cells/mL + sd (standard deviation). (B) sd of the means of each measured cell concentration for each device. The sd (cells/mL) were determined from six independent measurements of each theoretical cell concentration. P values were calculated from multiple comparison F-ratios following analysis of variance (ANOVA) for repeated measures.

