Abstract
It is common, even with new SPECT/CT systems, that the transmission data are truncated. This paper develops a method that obtains exact attenuation correction with truncated transmission data. The emission object (e.g., the heart) is assumed to have a finite, convex support, whose emission projections are not truncated. The transmission measurements over the support are available, but may be truncated outside the support (within the torso). A novel emission data reconstruction technique combines emission projections from conjugate views; a modified version of the ML-EM algorithm is used to reconstruct emission data. The attenuation map outside the support is not needed during reconstruction. The transmission measurements through the support are used to pre-scale the emission data and to reconstruct the attenuation map within the support. The attenuation map reconstruction within the support is an interior problem in which only a biased solution can be obtained using an iterative algorithm. The bias is then corrected by identifying a soft tissue region within the support and the known attenuation coefficient values of these pixels for the soft tissue. Proof of convergence of the new algorithm is provided. Computer simulations verify the accuracy of the new method.
Conclusions:
an exact attenuation map within the support can be obtained provided the attenuation coefficient is known at 1 pixel within the support. The method, which requires emission data over 360°, provides a means to perform attenuation correction in SPECT with truncated transmission data.
1. Introduction
It is a common practice to use transmission measurements to obtain an attenuation map, and use this attenuation map for attenuation correction during SPECT image reconstruction. Many transmission/emission SPECT systems have been developed over the past 20 years (Maeda et al 1981, Malko et al 1986, Bailey et al 1987, Frey et al 1992, Tan et al 1993, Jaszczak et al 1993, Ficaro et al 1994,Kemp et al 1995, Gullberg et al 1998). Recently the combined SPECT/CT systems have received much attention (Lang et al 1992, Blankespoor et al 1996, Hong et al 2006). The most worrisome problem of using the x-ray CT to measure the transmission data is the cone-beam imaging geometry, which is likely to have truncated measurements.
It is de facto to believe that a complete attenuation map must be available in order to have exact attenuation correction for the emission SPECT. This is supported by simulations that showed that truncation has an effect on image quality (Celler et al 2005). Therefore, when the transmission data are truncated, remedies such as data extrapolation (e.g., water equivalent assumption) are suggested to estimate the unmeasured data and reconstruct a complete attenuation map (Maltz et al 2007). Others have found (Gregoriou et al 1998) that truncation of the attenuation map may have little impact on accurate diagnosis for the heart. In this study the impact of truncation only became noticeable when the lateral dimension of the detector was smaller than 60% of the lateral width of the patient's thorax.
We believe that these different findings are due to the methods used to process truncated projection data. We also hypothesize that for attenuation correction in SPECT, a complete attenuation map is not needed, only the line-integrals of the attenuation map through the support of the emission distribution are needed. One pixel value of the attenuation map within the support is also needed.
2. Theory
2.1. Setting up the imaging equation with truncated transmission data
Let the attenuated Radon transform of f (x, y) be p(θ, s). That is, p(θ, s) is the non-uniformly attenuated SPECT data. Let the non-uniform attenuation map be μ(x, y) then the attenuated Radon transform of f (x, y) can be expressed as
| (1) |
Now we consider the product of p(θ, s) and p(θ+π, −s)
| (2) |
or
| (3) |
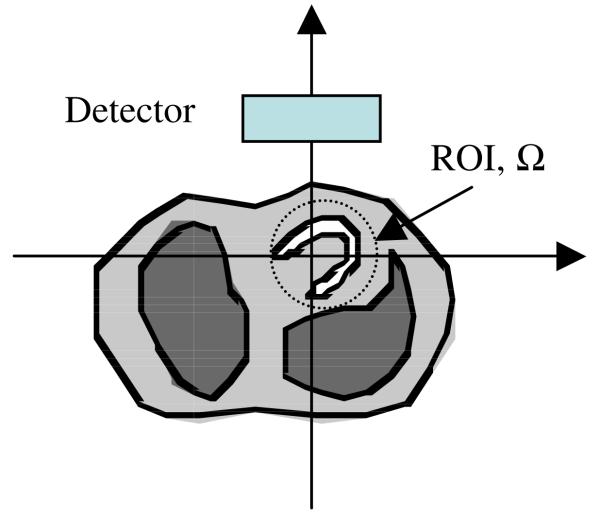
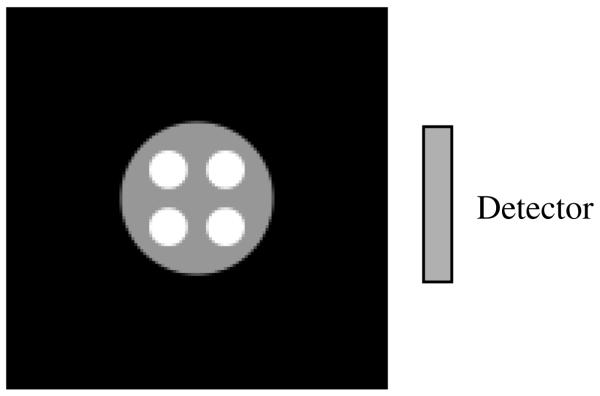
In this paper, we assume that the emission image f (x, y) has a finite support Ω, which is convex. That is, f (x, y) = 0 if (x, y) ∉ Ω. The non-uniform attenuation map is larger than Ω. The support Ω is within the field-of-view (FOV) of the emission and transmission detector. However, the transmission detector is not large enough for the attenuation map. This common situation is illustrated in figure 1.
Figure 1.
The detector is used for both transmission data and emission data acquisition. The detector is large enough to measure the entire emission data in the region-of-interest (ROI), Ω, which is the support of the emission image. However, the detector is not large enough for the transmission measurement. The transmission data are truncated due to the large attenuation map.
The transmission measurements provide the line-integrals of the attenuation map μ(x, y). Since the object has a finite support Ω and the projections are zero outside the support, the left-hand-side of equation (3) is measured and known. Hereafter we denote the left-hand-side of equation (3) as q(θ, s), that is,
| (4) |
and
| (5) |
In the special case that the attenuation map μ(x, y) is a constant μ within the support Ω, equation (4) reduces to
| (6) |
In cardiac SPECT imaging, if the radioactivity is dominantly concentrated in the heart, the imaging problem can be described by equation (6) and the constant μ is the linear attenuation coefficient of the soft tissue and is known for a given gamma-ray photon energy. The only unknown to be solved in equation (6) is the emission distribution f (x, y).
If the attenuation map is non-uniform, according to equation (5), the non-uniform attenuation map is needed only within Ω. The complete attenuation map is not required for image reconstruction using equation (5).
Solving for the non-uniform attenuation map in Ω is an ‘interior’ tomography problem. The latest results for an interior tomography problem suggest that if Ω is completely measured and the image value in a subset of Ω is known then the image within Ω is uniquely determined (Defrise et al 2006, Ye et al 2007, Kudo et al 2008). In nuclear medicine, we can always identify a soft tissue region within Ω, and we know the attenuation coefficient in this soft tissue region by the given gamma-ray photon energy. The sub-attenuation map within Ω is then obtained, for example, by a transmission ML-EM algorithm (Lange and Carson 1984) with the fixed, known image value in a soft tissue sub-region. Once the sub-attenuation map is available, the emission distribution f (x, y) can be solved from equation (5), which we will refer to as the imaging equation.
2.2. Geometric interpolation of the imaging equation (5)
Equation (1) can be discretized into a system of linear equations
| (7) |
where P is a vector of projection data, F is the object (i.e., image) written in vector form and A is the projection matrix.
The goal of image reconstruction is to solve for F from system (7). One way to solve for F is to solve the minimization problem
| (8) |
If the L2-norm is used in (8), then (8) gives the least-squares solution, which is commonly sought when the measurement noise can be modeled as Gaussian.
If the measurement noise is Poisson or the non-negativity constraint is enforced, the desired solution for F can be obtained by minimizing the following I-divergent ‘norm’:
| (9) |
where pj is the jth component in P, fi is the ith component in F and aji is the (j, i)th entry in matrix A. The I-divergent is a measure of data discrepancy, and is, to within a constant, the negative loglikelihood functional for Poisson-distributed data (Csiszár 1991). The common iterative ML-EM algorithm can be used to find the minimum of this I-divergent measure (Snyder et al 2001).
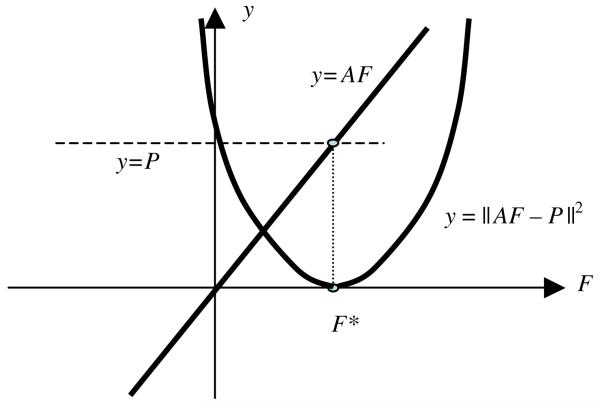
If system (7) is consistent, the solution F* for (7) and (8) can be illustrated geometrically (see figure 2).
Figure 2.
An illustration of finding the solution of AF = P being reduced to finding the minimum of ∥ AF − P ∥2.
If enough measurements are available, the matrix A is of full-rank. In practice, this is approximately achieved. This makes the ‘surface’ quadratic function ∥ AF − P ∥2 a bowl with the unique minimum, which corresponds to the solution F*. When there is noise and system (7) is not consistent, the bowl in figure 2 is elevated above zero.
Similarly, finding the solution to (5) can be reduced to a minimization problem
| (10) |
The above minimization problem is aimed to solve the two systems
| (11a) |
| (11b) |
where (11a) is a subsystem for projection angles in the range of [0,π) and (11b) is a subsystem for projection angles in the range of [π, 2π).
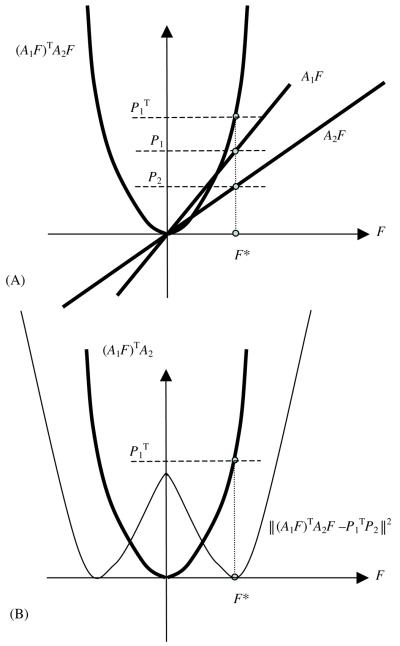
We must point out that is a quadruplicate function and has one local maximum at the origin and two minima at F* and −F* as illustrated in figure 3. If we use the constraint that the domain F must have non-negative coordinates, then the ‘surface’ function of is a convex bowl and there is a unique minimum F* in the domain of non-negative real numbers. On the edge of the domain there is a local maximum with F being identically equal to zero, and we have no interest in this local optimal of F ≡ 0.
Figure 3.
(A) An illustration of finding the solution of systems A1 F = P1 and A2 F = P2 being reduced to finding the solution of . (B) An illustration of finding the solution of being reduced to finding the minimum of .
2.3. Mathematical proof
In this section, we mathematically prove the unimodal property in section 2.2 using the L2-norm. Let
| (12) |
Evaluating the gradient of y with respect to the vector F yields
| (13) |
The necessary condition for F to be an optimum is
| (14) |
which results in
| (15) |
or
| (16) |
The Hessian of y with respect to F is the second-order gradient of the function y, and is given by
| (17) |
At the stationary point (15) F ≡ 0,
| (18) |
which is negative definite. Thus the stationary point (15) F ≡ 0 is a local maximum.
At the stationary point (16),(A1F)TA2F = Q,
| (19) |
which is positive definite. Thus the stationary point (16), , is a local minimum.
Ignoring the boundary point F ≡ 0, in the domain of non-negative entries of F, there is a unique minimum which corresponds to the solution of (A1F)TA2F = Q, or equivalently, the solution of (7): P = AF.
2.4. Solving for F from (10)
It is important to know that within the domain of non-negative entries of F, there is a unique minimum, which is the solution we are seeking. In optimization theory, this situation is the ideal unimodal optimization problem, and almost any optimization technique can be used to find the optimum.
Our remaining task is to solve for f from equation (5), or equation (6) for the case of constant μ, by finding the minimum F in the domain of non-negative entries of F. Since the non-negativity is a constraint, we will modify the conventional iterative ML-EM algorithm for this task. The proposed algorithm is stated as follows:
| (20) |
where fi represents the value of the emission object f (x, y) at the pixel with index i (i.e., the ith element of F), qj is the discrete measurement calculated in equation (3) at the detector bin with index j (i.e., the jth element of Q in (16)), aji is the geometric contribution (ignoring the attenuation effect) from the image pixel i to detector bin j and μk̂ is the attenuation map value at the pixel with index k̂. In equation (20), is the discrete version of the line-integral , which is the attenuation projection data acquired by using a virtual detector at the center of rotation and the attenuation coefficient is . Similarly, is the discrete version of the line-integral , which is the attenuated projection as if the virtual detector is at the center of rotation with the attenuation coefficient function .
Next we will establish the convergence of algorithm (20). In other words, we will show that algorithm (20) solves equation (16).
It is clear that if a solution satisfies equation (16), it is a stationary point for the algorithm in (20). In fact, the discrete version of equation (5) is
| (21) |
| (22) |
which implies that the solution {fi} is a stationary point for the algorithm.
If we re-write the multiplicative update scheme (22) as its additive equivalent, we have
| (23) |
or symbolically, this algorithm is in the gradient descent form
| (24) |
where
| (25) |
is the data discrepancy, and ETΛ−1E is the objective function to be minimized. The diagonal matrix Λ contains the weighting factors for each measurement ray, and is defined as
| (26) |
The operator B is a backprojector excluding the model for attenuation, whose elements are the summation over j: Σj aji●j. The step size matrix β is also diagonal, with
| (27) |
Equation (24) is a gradient descent algorithm to find the minimum of ETΛ−1E with the step size small enough so that the updated value is in the domain of non-negative real numbers.
3. Computer simulations
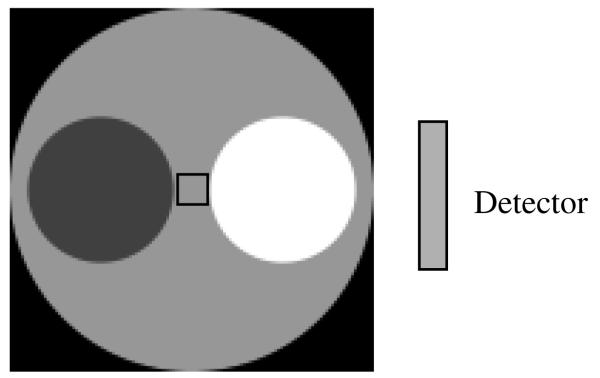
Computer simulations have been conducted to verify the proposed algorithm with truncated transmission data for exact attenuation correction. The attenuator is shown in figure 4, where the large disc has a diameter of 128 units, and the two smaller discs have a diameter of 51.2 units. The linear attenuation coefficient of the large disc is 0.01 per unit. The linear attenuation coefficient for one of the smaller discs is 0.015 per unit and for the other smaller disc is 0.005 per unit. A small (10 × 10) square is indicated in figure 5 at the center of the attenuator. We assume that the attenuation coefficient in this small square is known and will be used to assist the reconstruction of the attenuation map.
Figure 4.
The non-uniform attenuator with a diameter of 128 units. The attenuation coefficient in the 10 unit by 10 unit square at the center of the attenuator is assumed to be known.
Figure 5.
The emission object is smaller than the attenuator.
The emission object is shown in figure 5, where the four small lesions have the same diameter of 12.8 units with the intensity of 1.5. The circular background activity intensity is 1 and has a diameter of 51.2 units.
The one-dimensional detector has a size of 64 units with 64 detector bins. In other words, the ‘unit’ is the detector bin-size. The detector is barely large enough for the emission object, but is not large enough for the attenuator. We assume that the detector measures the parallel-beam emission data from the emission object, and measures the parallel-beam transmission data from the attenuator. In reality, if convergent-beam transmission data are acquired, the convergent-beam data will be rebinned into parallel-beam data, to be consistent with the emission data. If the emission data are also acquired with the same convergent geometry as the transmission data, no rebinning is necessary.
The truncated transmission data (i.e., line-integrals of the attenuator) and un-truncated emission data (i.e., attenuated Radon transform of the object) are generated analytically at 180 views uniformly distributed over 360°.
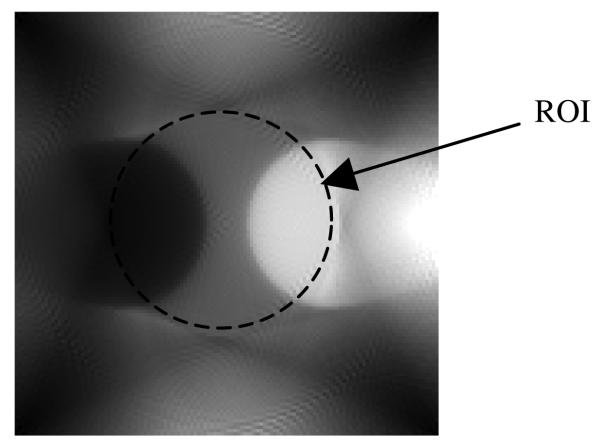
The common iterative emission ML-EM algorithm is used to reconstruct the attenuation map. This is an ‘interior tomographic’ problem with truncated data, and the ML-EM reconstruction of the attenuation map in the ROI (which is also the support of the emission object) is biased (Rohmer et al 2006a, 2006b). At each iteration of the ML-EM algorithm, we calculate the average image value in the small square as indicated in figure 5. Since the value in the small square region is assumed to be known, the calculated average value is then compared with the known values and the current estimate of the image is adjusted by adding the amount of: (true value) – (calculated average value). After 20 iterations, the resultant attenuation map is obtained and is shown in figure 6. The attenuation map is accurate only within the ROI, which is, in our case, the support of the emission object.
Figure 6.
The reconstructed attenuation map is accurate only in the central ROI. This is all that is needed to satisfy equation (5).
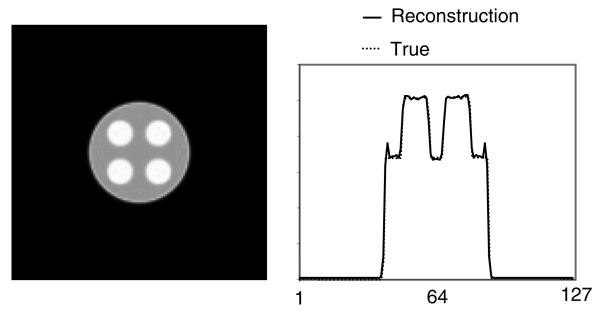
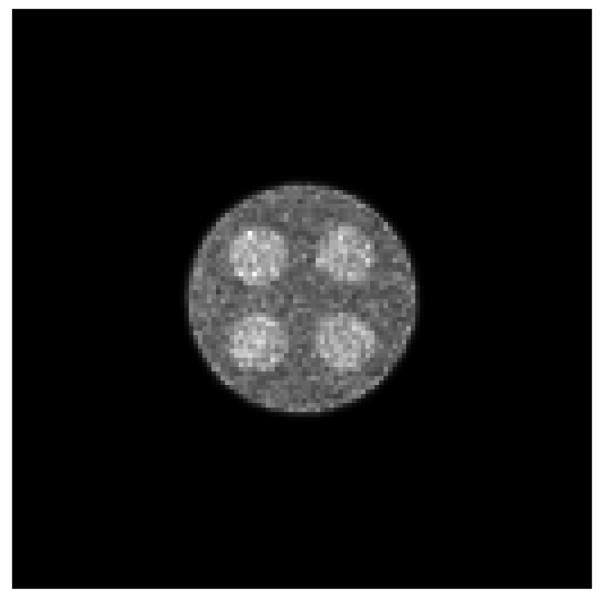
The emission image is then reconstructed iteratively using the algorithm presented in (20). After 20 iterations, the emission image is obtained, and is shown in figure 7. Figure 8 shows the same reconstruction as figure 7, except that the emission projections are corrupted with Poisson noise; there are 17 million counts in the projections for this two-dimensional study.
Figure 7.
The reconstructed emission image with attenuation correction. The profiles are drawn at row 72, passing through the top two small lesions.
Figure 8.
The reconstructed emission image with attenuation correction, using noisy projections.
Finally, we applied our algorithm to a situation that violates our assumption that there is no emission activity outside the ROI. In the example shown in figure 9 (left), a large disc of diameter of 90 units is added to the emission phantom which is 51.2 units in diameter. This large disc extends outside the ROI, which is 64 units in diameter, and has an intensity of 0.2.
Figure 9.
In this example, the assumption of no emission activity outside the ROI is violated. Left: reconstruction when the emission data are not truncated but the transmission is truncated as shown in figure 4. Right: reconstruction when the emission data are truncated in the same way as the transmission data.
If we assume that the emission data are not truncated (e.g., the emission detector is larger, or the emission data are acquired via a parallel-beam geometry) but the transmission data are truncated, the iteratively reconstructed image is shown in figure 9 (left), where no artifacts are visually detectable, however, the emission image may be slightly biased.
If we assume that the emission data are also truncated in the same way as the transmission data, the resultant reconstruction is shown in figure 9 (right), where an artificial bright ring appears on the edge of the ROI and the object of interest has no detectable artifacts but may be slightly biased.
When the emission activity is truncated, the imaging problem becomes an interior ‘problem’ for the attenuated Radon transform, which is still under investigation. It is hypothesized that if the emission image value is known in a small sub-region (e.g., outside the patient's body) within the ROI, the interior problem for the attenuated Radon transfer is solvable.
4. Conclusions
Combining the projections at opposite views was an early approach to reduce the attenuation effect in SPECT, and was investigated by Sorenson (1974), where the geometric mean of the projection data from the opposite views was used. Sorenson's method gives a good approximation for the reconstruction of attenuated data for a distributed source within a uniform attenuator. In this paper, we applied the technique where by combining emission projections from conjugate views, the attenuation map outside the ROI is not needed during reconstruction. The transmission measurements through the ROI are used to pre-scale the emission projections and are used to reconstruct the attenuation distribution within the ROI. The attenuation map outside the ROI is not needed in emission data reconstruction. Since the attenuation map reconstruction within the ROI is an ‘interior problem’, only a biased solution can be obtained using an iterative reconstruction algorithm. If we know the attenuation coefficient in a sub-region of the ROI, then the bias in the reconstructed ROI attenuation map can be corrected.
The combination of the emission projections from the conjugate views pre-scaled by the reciprocal of the transmission measurements (see equation (4)) is used in a modified ML-EM algorithm (see equation (20)) for exact emission image reconstruction.
The significance of this work is to provide a means to perform attenuation correction in SPECT with truncated transmission data. The drawback of the proposed method is that the emission projections are required over 360°.
If the emission object is larger than the ROI, which is the non-truncated region of the transmission data, the emission image outside the ROI may be slightly biased. If the emission data are also truncated, some truncation artifacts are observed on the truncation edges.
Acknowledgment
This work was supported in part by the Margolis Foundation, NIH grant R01EB00121, and by the Director, Office of Science, Office of Biological and Environmental Research, Medical Science Division of the US Department of Energy under contract no DE-AC02–05CH11231.
References
- Bailey DL, Hutton BF, Walker PJ, Zeeberg BR, Loncari S. Improved SPECT using simultaneous emission and transmission tomography. J. Nucl. Med. 1987;28:844–51. [PubMed] [Google Scholar]
- Blankespoor SC, Xu X, Kaiki K, Brown JK, Tang HR, Cann CE, Hasegawa BH. Attenuation correction of SPECT using x-ray CT on an emission-transmission CT system: myocardial perfusion assessment. IEEE Trans. Nucl. Sci. 1996;43:2263–74. [Google Scholar]
- Dixon KL, Chang Z, Blinder S, Powe J, Harrop R. Problems created in attenuation-corrected SPECT images by artifacts in attenuation maps: a simulation study. J. Nucl. Med. 2005;46:335–43. [PubMed] [Google Scholar]
- Csiszár I. Why least squares and maximum entropy? An axiomatic approach to inference for linear inverse problems. Ann. Stat. 1991;19:2032–66. [Google Scholar]
- Defrise M, Noo F, Clackdoyle R, Kudo H. Truncated Hilbert transform and image reconstruction from limited tomographic data. Inverse Problems. 2006;22:1073–53. [Google Scholar]
- Ficaro EP, Fessler JA, Rogers WL, Schwaiger M. Comparison of americium-241 and technetium-99m as transmission sources for attenuation correction of thallium-201 SPECT imaging of the heart. J. Nucl. Med. 1994;3:652–63. [PubMed] [Google Scholar]
- Frey EC, Tsui BMW, Perry JR. Simultaneous acquisition of emission and transmission data for improved TI-201 cardiac SPECT imaging using a Tc-99m transmission source. J. Nucl. Med. 1992;33:2238–45. [PubMed] [Google Scholar]
- Gregoriou GK, Tsui BMW, Gullberg GT. Effect of truncated projections on defect detection in attenuation-compensated fanbeam cardiac SPECT. J. Nucl. Med. 1998;39:166–75. [PubMed] [Google Scholar]
- Gullberg GT, Morgan HT, Zeng GL, Tung C-H, Christian PE, Maniawski PJ, Hsieh Y-L, Datz FL. The design and performance of a simultaneous transmission and emission tomography system. IEEE Trans. Nucl. Sci. 1998;45:1676–98. [Google Scholar]
- Hong KJ, Choi Y, Lee SC, Lee SY, Song TY, Min BJ, Jung JH, Choe YS, Lee KH, Kim BT. A compact SPECT/CT system for small animal imaging. IEEE Trans. Nucl. Sci. 2006;53:2601–4. [Google Scholar]
- Jaszczak RJ, Gilland DR, Hansen MW, Jang S, Greer KL, Coleman RE. Fast transmission CT for determining attenuation maps using a calibrated line source, rotatable air-copper-lead attenuators and fan beam collimation. J. Nucl. Med. 1993;34:1577–86. [PubMed] [Google Scholar]
- Kemp BJ, Prato FS, Nicholson RL, Reese L. Transmission computed tomography imaging of the head with a SPECT system and a collimated line source. J. Nucl. Med. 1995;36:328–35. [PubMed] [Google Scholar]
- Kudo H, Courdurier M, Noo F, Defrise M. Tiny a prori knowledge solves the interior problem in computed tomography. Phys. Med. Biol. 2008;53:2207–31. doi: 10.1088/0031-9155/53/9/001. [DOI] [PubMed] [Google Scholar]
- Lange K, Carson R. EM reconstruction algorithms for emission and transmission tomography. J. Comput. Assist. Tomogr. 1984;8:306–16. [PubMed] [Google Scholar]
- Lang TF, Hasegawa BH, Liew SC, Brown JK, Blankespoor SC, Reilly SM, Gingold EL, Cann CE. Description of a prototype emission transmission computed tomography imaging system. J. Nucl. Med. 1992;33:1881–7. [PubMed] [Google Scholar]
- Maeda H, et al. Determination of the pleural edge by gamma-ray transmission computed tomography. J. Nucl. Med. 1981;22:815–7. [PubMed] [Google Scholar]
- Malko JA, Van Heertum RL, Gullberg GT, Kowalsky WP. SPECT liver imaging using an iterative attenuation correction algorithm and an external flood source. J. Nucl. Med. 1986;27:701–5. [PubMed] [Google Scholar]
- Maltz JS, Bose S, Shukla HP, Bani-Hashemi AR. CT Truncation artifact removal using water-equivalent thicknesses derived from truncated projection data; Engineering in Medicine and Biology Society, 2007 (EMBS 2007) 29th Ann. Int. Conf. of the IEEE; 2007. pp. 2907–11. [DOI] [PubMed] [Google Scholar]
- Rohmer D, Eisner RL, Gullberg GT. The effect of truncation on very small cardiac SPECT camera systems. J. Nucl. Med. 2006a;47(Suppl. 1):64. [Google Scholar]
- Rohmer D, Eisner RL, Gullberg GT. Technical Report LBNL-60680. Lawrence Berkeley National Laboratory; Berkeley, CA: 2006b. [Google Scholar]
- Snyder DL, O'Sullivan JA, Whiting BR, Murphy RJ, Benac J, Cataldo JA, Politte DG, Willianmson JF. Deblurring subject to nonnegativity constraints when known functions are present with application to object-constrained computerized tomography. IEEE Trans. Med. Imaging. 2001;20:1009–17. doi: 10.1109/42.959298. [DOI] [PubMed] [Google Scholar]
- Sorenson JA. Quantitative measurement of radio-activity in vivo by whole-body counting in Hine GT. In: Sorenson JA, editor. Instrumentation of Nuclear Medicine. Vol. 2. Academic; New York: 1974. pp. 311–48. [Google Scholar]
- Tan P, Bailey DL, Meikle S, Eberl S, Fulton RR, Hutton BF. A scanning line source for simultaneous emission and transmission measurements in SPECT. J. Nucl. Med. 1993;34:1752–60. [PubMed] [Google Scholar]
- Ye Y, Yu H, Wang G. A general local reconstruction approach based on a truncated Hilbert transform. Int. J. Biomed. Imaging. 2007;2007:63634. doi: 10.1155/2007/63634. [DOI] [PMC free article] [PubMed] [Google Scholar]


