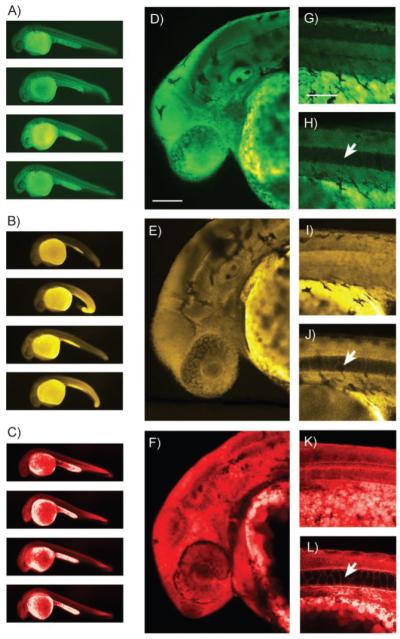
Figure 3.

Pseudocolored images of 24 hpf zebrafish embryos stained for 1 h with 25 μm 3 (A, D, G, H), 4 (B, E, I, J), or BODIPY TR methyl ester (C, F, K, L). A)–C) Examples of embryo staining. Representative instances of the slight developmental defects caused by exposure to 4 can be seen in panel (B). D)–F) 80 μm confocal Z projections of the head region. G), I), K) 80 μm Z projections of the dorsal midline (anterior to the left). H), J), L) 1 μm slices from the dorsal midline with notochord vacuoles indicated by arrows. Scale bars = 100 μm.
