

Abstract
We present a new class of polymeric ligands for quantum dot (QD) water solubilization to yield biocompatible and derivatizable QDs with compact size (~10-12 nm diameter), high quantum yields (>50%), excellent stability across a large pH range (pH 5-10.5), and low nonspecific binding. To address the fundamental problem of thiol instability in traditional ligand exchange systems, the polymers here employ a stable multidentate imidazole binding motif to the QD surface. The polymers are synthesized via reversible addition-fragmentation chain transfer (RAFT)-mediated polymerization to produce molecular weight controlled monodisperse random copolymers from three types of monomers that feature imidazole groups for QD binding, polyethylene glycol (PEG) groups for water solubilization, and either primary amines or biotin groups for derivatization. The polymer architecture can be tuned by the monomer ratios to yield aqueous QDs with targeted surface functionalities. By incorporating amino-PEG monomers, we demonstrate covalent conjugation of a dye to form a highly efficient QD-dye energy transfer pair as well as covalent conjugation to streptavidin for high-affinity single molecule imaging of biotinylated receptors on live cells with minimal non-specific binding. The small size and low serum binding of these polymer-coated QDs also allow us to demonstrate their utility for in-vivo imaging of the tumor microenvironment in live mice.
Introduction
Quantum dots (QDs) are a powerful class of fluorophores exhibiting high quantum yields (QY), large molar extinction coefficients, exceptional photo-stability, and tunable emission wavelengths across the visible and near-IR spectral window.1-4 These properties make QDs attractive candidates as biological fluorescent tags,3,5,6 especially since their brightness and stability enables single molecule tracking over extended periods of time.7-9 However, a major barrier towards the wide-spread use of QDs has been the presence of a trade-off among five desirable QD properties for fluorescence labeling in live cells and in-vivo: small size, high stability (both over time and in a wide pH range), high QY, facile derivatizabilty, and low non-specific binding. While it has been possible to achieve three or four of these criteria, achieving all five simultaneously has proven challenging for ligand design. Commercial QDs encapsulated with PEGylated amphiphilic polymer coatings are easily derivatizable and are suitable for single molecule imaging,7,10 but suffer from large hydrodynamic diameters (20 – 30 nm),11 which can limit the access of QDs to crowded regions such as the neuronal synapse, as well as potentially alter the native behavior of labeled receptors.12-14 Smaller QDs have been achieved via ligand exchange with thiol-bearing molecules, but suffer from instability due to the weak interaction of mono-thiols with the QD surface.15,16 Recently, our group and others17-20 have demonstrated increased interaction of thiol ligands with QDs by exploiting the bidentate binding motif using dihydrolipoic acid (DHLA) to furnish a new class of aqueous DHLA-PEG modified QDs that are compact, biocompatible, derivatizable, and exhibit very low non-specific binding. Notwithstanding, most thiol-based coordinating ligands are inherently unstable owing to the oxidation and dimerization of the thiol groups, causing the ligands to detach from the QD surface over time (vide infra). We now report a new class of multidentate poly-imidazole ligands that obviate the need for thiols while maintaining the attractive properties of small size, low non-specific binding, derivatizability, and high QY. Here, we use the term multidentate to indicate a polymer with pendant groups that can bind to multiple sites on the QD surface, as opposed to multiple coordination of individual surface atoms, which has been posited in the case of poly-histidine coordination,21 but is not necessarily apt to the present case.
Poly-histidine motifs have been shown to exhibit high affinity towards the Cd and Zn rich QD surface, and His6-tags have been employed for facile and efficient derivatization of QDs with short peptides, dyes, and proteins.21-24 Pendant imidazole groups in copolymer microgels have also been shown to stabilize organic soluble QDs.25 From these observations, we hypothesized that a polymer that is rich in imidazole groups along the backbone should efficiently bind to the QD surface. Poly-imidazole is resistant to degradation by oxidation and its multidentate binding motif can greatly enhance stability.26-28 To promote water solubility, prevent aggregation, and reduce non-specific binding,29 we opted to pursue a strategy to co-polymerize a PEG-derived monomer, and described herein is the synthesis of a random brush copolymer architecture displaying both PEG and imidazole groups along the polymer backbone. Adding an additional monomer featuring either amine or biotin functional groups affords a 3-component multi-functional copolymer to yield QDs that are water soluble and derivatizable. Copolymer based ligands with multidentate pendant binding groups to the QD surface have been previously reported, but suffered from either limited water solubility, aggregation, low QY, and/or a lack of a functional handle for further covalent derivatization, or do not demonstrate the low non-specific binding to cells or to serum proteins that are required for the most interesting biological applications.25,26,30-32 In this report we seek to extend the previous work by optimizing our polymer system for biological compatibility as per the previously outlined desired properties for in-vivo and in-vitro applications. In order to achieve molecular weight control and narrow polydispersity of the proposed copolymer, we employed RAFT (radical addition fragmentation chain transfer) polymerization chemistry, which offers the further ability to mediate the controlled co-polymerization of a wide library of monomers.33 By varying the ratio and composition of monomers, complex copolymers can be assembled to give compact, water-soluble QDs with tunable surface properties. QDs prepared with these new ligands exhibit extremely low non-specific binding to serum and greatly enhanced stability and long-term shelf-life, making them optimal for live cell and in-vivo imaging.
Results and Discussion
The design and synthesis of multidentate polymeric imidazole ligands (PILs) was undertaken to overcome the long-term instability of DHLA based ligands. Figure 1 shows the gel electrophoresis of various DHLA based carboxyPEG (Figure S1) coated QDs. When initially prepared, DHLA-carboxyPEG QDs exhibit sharp bands by gel electrophoresis, and a titration of increasing amounts of His6-tagged monovalent streptavidin (mSA) produced discrete bands.22 As reported, high-affinity cell labeling with low non-specific binding is achieved upon prompt use of the QD-mSA conjugates. However, the same conjugation experiment conducted on DHLA-carboxyPEG QDs stored for ~1 week in the dark at 4 °C exhibits broadened bands, indicating a fluctuation in charge owing to a heterogeneous distribution of ligand density, most likely due to ligand detachment from the QD surface. Along with band broadening by gel electrophoresis, we observed a concomitant increase in non-specific binding to HeLa cells (data not shown), consistent with loss of ligand binding to the QDs. These deficiencies are ameliorated by the replacement of the thiol ligand with that of a polymeric imidazole ligand described below.
Figure 1.
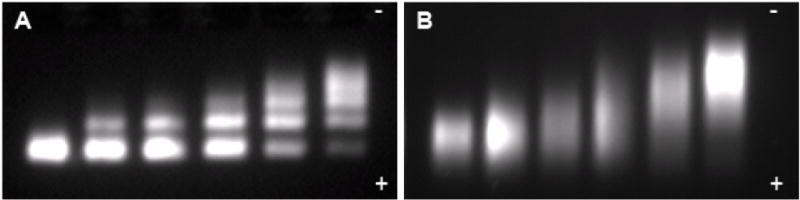
Instability of DHLA-PEG derived ligands over time. Gel electrophoresis of DHLA-carboxyPEG QDs (A) after initial ligand exchange and (B) after 1 week storage at 4 °C in the dark, with increasing titration of His6-Tagged monovalent streptavidin from left to right showing sharp and discrete bands in the initially prepared sample, but loss of fidelity after storage. QDs in (B) also exhibit increased non-specific binding to cells (data not shown).
Monomer Synthesis and Polymerization
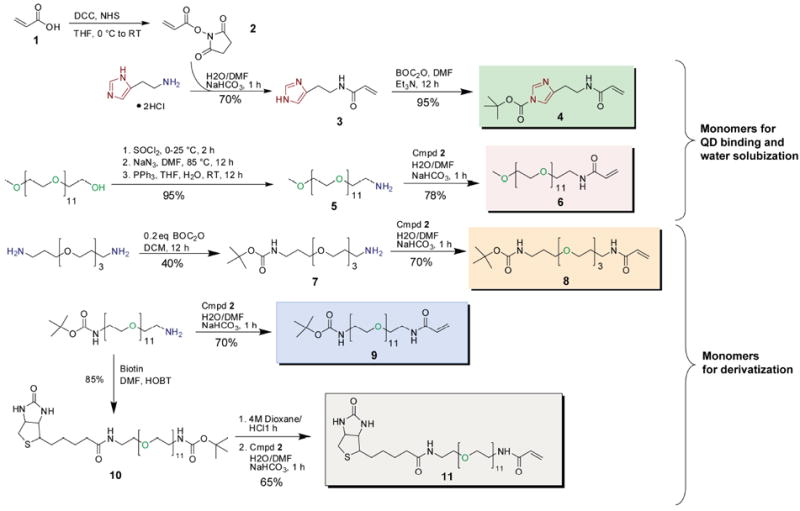
Scheme 1 presents the synthetic strategy that was pursued to deliver the monomers for polymerization. Acrylic acid is coupled to primary amine bearing moieties via an amide bond forming reaction. Conjugate addition to the vinyl group was minimized by first preparing the NHS-ester of acrylic acid (2), and allowing the coupling reaction to proceed at 4 °C for only 30 min, upon which complete consumption of the starting materials was confirmed by TLC. Monomer 3 containing the imidazole group for QD binding was obtained from the reaction of histamine with 2. Since the trithiocarbonate RAFT agent 12 used in subsequent polymerization reactions34 is highly sensitive towards degradation by aminolysis, the imidazole nitrogen was BOC protected to yield the final monomer 4. Likewise, monomer 6 containing a PEG11 group for water solubility was obtained first via the conversion of the terminal hydroxyl group of mono-methoxy PEG to a primary amine 5, followed by reaction with 2. Monomers 8 and 9 with BOC-protected terminal amines were also synthesized in order to afford polymers bearing primary amine groups for derivatization with FRET dyes or proteins. Finally, to demonstrate the scope of monomer incorporation in the polymerization reaction scheme, monomer 11 was synthesized to give polymers functionalized with biotin for binding assays. For each of the monomers, formation of an amide bond, as opposed to an ester bond, was necessary in order to circumvent the possibility of ester hydrolysis under the acidic BOC deprotection conditions following polymerization, and also to afford higher stability in the presence of hydrolytic enzymes for in-vivo and in-vitro applications.
Scheme 1.
The reaction of monomers 4, 6, and 8 shown in Scheme 2 is representative of all polymerization reactions used in this study. The monomer mixture typically consists of 50% mole fraction of monomer 4 to ensure that there are enough imidazole groups for effective binding to the QD surface, with the remaining 50% mole fraction consisting of some mixture of monomer 6 (for water solubility), along with one of monomers 8, 9, or 11 (for derivatizability). In order to minimize the potential of long polymer chains cross-linking and aggregating QDs during ligand exchange, the polymer MW was kept low, with a targeted degree of polymerization (DP) below 30. RAFT polymerization can be carried out with any number of conventional radical initiators. These are typically thermally activated and include AIBN, azobis(2-cyanopentanoic acid), and K2S2O8.35 In our case, AIBN was used as the initiator in the presence of the RAFT agent 12 to afford a controlled living polymerization.34 Using an [AIBN] : [RAFT]:[Monomer] ratio of 0.25:1:28 and an equimolar mixture of monomers 4 and 6 (polymer 13a), the overall polymer conversion over time as monitored by 1H-NMR spectroscopy (Figure S2) followed a linear relationship, achieving >80% conversion after 10 h (Figure S3A). Increasing the [AIBN] : [RAFT] ratio to 1:1 resulted in a non-linear conversion efficiency versus time, yielding >90% conversion after 2 h (Figure S3B); interestingly, a low PDI and good molecular weight control was maintained (vide infra). The plot of [Monomer] : [RAFT] ratio versus measured polymer DP using GPC followed a linear relationship, showing good MW control (Figure 2A), and a narrow PDI <1.2 (Figure 2B) was observed. Figure 2A shows that the targeted DP of <30 for copolymer 13a was achieved using [Monomer]:[RAFT] ratios between 20 to 33:1, as measured by GPC. The same polymerization carried out in the absence of RAFT agent yielded a poorly controlled polymer (PDI > 3), confirming that the RAFT agent is responsible for mediating polymerization even under high relative initiator concentrations (Figure 2B). Because controlled polymerizations could be performed even under the relatively high [AIBN]/[RAFT] ratio of 1:1, new polymers could be rapidly prototyped due to the short reaction times required for near-complete polymer conversion.
Scheme 2.
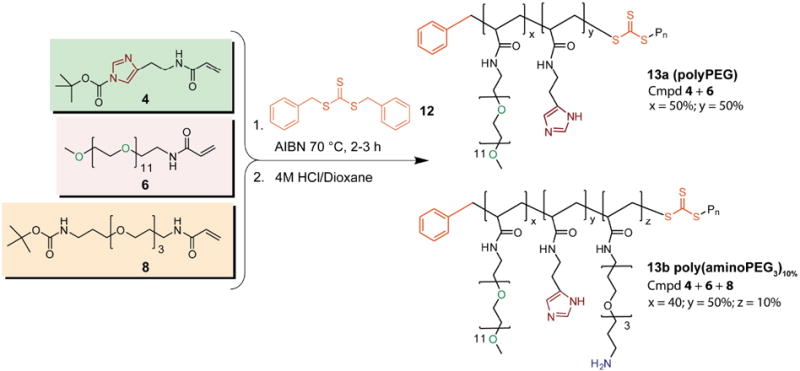
Figure 2.

RAFT polymerization of 13a showing (A) tunable polymer DP as a function of [Monomer] to [RAFT] ratio. (B) GPC of polyPEG in DMF, showing narrow polydispersity with a [Monomer]:[RAFT] ratio of 30:1 and [AIBN]:[RAFT] ratio of 1:1 (—, black), and poor MW distribution without RAFT agent ( , red).
The nomenclature of copolymer ligands used in this study is outlined in Table 1. For QD water solubilization, all polymer MWs were typically ~14 kDa with PDI <1.2 as measured by GPC calibrated using polystyrene MW standards. Since the relative reaction rates of the monomers within the co-polymerization mixture could not be determined due to overlapping NMR signals of the monomers, polymerizations were performed to >90% conversion efficiency to ensure the incorporation of all monomers in the mixture. It is not known whether the monomers are incorporated in a statistical fashion, or if there is some local ordering of monomer units in the polymer microstructure. An advantage of the class of polymers presented here for QD ligand exchange is that these ligands are amenable to long-term storage under ambient conditions without special precautions against degradation, unlike DHLA based ligands, which slowly oxidize over time and often need to be carefully stored in the dark at 4 °C.
Table 1.
Nomenclature of compounds used in this report.
| Nomenclature for PILs | Polymer ligand composition by mole % |
|---|---|
| Poly(PEG) | 50% Cmpd 6 / 50% Cmpd 4 |
| Poly(aminoPEG3)10% | 10% Cmpd 8 / 40% Cmpd 6 / 50% Cmpd 4 |
| Poly(aminoPEG11)25% | 25% Cmpd 9/ 25% Cmpd 6/ 50% Cmpd 4 |
| Poly(biotinPEG)25% | 25% Cmpd 11/ 25% Cmpd 6/ 50% Cmpd 4 |
| Nomenclature for DHLA-based ligands* | |
| hydroxyPEG | DHLA-PEG8-OH |
| carboxyPEG | DHLA-PEG8-COOH |
| aminoPEG | DHLA-PEG8-NH2 |
Chemical structures can be found in Figure S1.
Ligand Exchange and Characterization of Aqueous QDs
Ligand exchange of 605 nm emitting CdSe(CdZnS) core(shell) QDs20 using poly(PEG)-PILs was performed by displacing the native hydrophobic ligands with the imidazole groups along the polymer backbone, which can participate in multiple binding interactions with the Cd and Zn rich QD surface. Ligand exchange conditions were relatively mild, and involved stirring a mixture of QDs and poly(PEG)-PILs in a solution of chloroform at RT, followed by addition of methanol and precipitation using chloroform and hexanes. The QDs were dispersed in water and then purified by dialysis. Complete ligand displacement was achieved within 1 h, and was confirmed by 1H NMR spectroscopy (Figure S4), which signaled the disappearance of the original aliphatic protons of TOP/TOPO coated QDs after ligand exchange with poly(PEG)-PILs, and the appearance of PEG protons from the polymer bound to the QD surface. A control experiment using a polymer of 6 alone did not yield water soluble QDs (data not shown). The emission peak of QDs after ligand-exchange with PILs exhibited a slight red-shift, while the line-width remained fairly constant (Table S1).
Ligand exchange of CdSe(CdS) core(shell) QDs with PEG)-PILs also proceeded smoothly. The presence of a high quality CdS shell applied using a modified selective ion layer adsorption and reaction (SILAR) approach36,37 contributes significantly to the absorbance cross-section of QDs blue of 450 nm and is advantageous for increased brightness in single molecule imaging applications. In addition, a robust shell can greatly improve the QY of QDs after phase transfer to water. Indeed, the QY of CdSe(CdS) QDs ligand exchanged with poly(PEG)-PILs were in excess of 65% in water, a modest drop from a QY of 90% in octane (Figure 3A). The high QY of poly(PEG)-PIL QDs is maintained in buffers ranging from pH 5 to pH 10.5 after incubation at room temperature for 4 h (Figure 3B). Previous studies on the pH dependence of His6-tag binding to Ni-NTA media show that the interaction is stable between pH 7-11,21,38 and becomes disrupted below pH 5 due to the protonation of the imidazole group. This is consistent with the binding of poly(PEG)-PILs to the surface of QDs via metal-affinity interactions. Below pH 5, the fluorescence intensity of QDs drops rapidly, but the QDs remain well dispersed in solution without any visible formation of macroscopic aggregation. In addition, a photobrightening effect was observed with poly(PEG)-PIL QDs. Photoannealing by illumination with 365 nm UV for 5 min increased the fluorescence intensity of poly(PEG)-PIL QDs by as much as 30%. Furthermore, this increase in fluorescence was retained for at least 24 h after the photoannealing treatment. This observation is consistent with previous studies of QD photobrightening upon conjugation with His6-tagged proteins,39 as the polymer in this case is binding to the QD surface via the same imidazole moiety. TEM analysis of QDs dropcast from water after ligand exchange with poly(PEG)-PILs shows that the QDs are well dispersed (Figure 4A), and dynamic light scattering analysis shows a single narrowly distributed population centered at ~11.5 nm hydrodynamic diameter for 605 nm emitting CdSe(ZnCdS) QDs (Figure 4B). This size is comparable to the hydrodynamic diameter of the same QDs ligand exchanged with DHLA-hydroxyPEG, likely due to the compact nature of the imidazole binding group, which is only a few carbons away from the polymer backbone. In addition, we observed that the multidentate binding motif employed in poly(PEG)-PILs results in an aqueous solution that is far more stable than DHLA-hydroxyPEG QDs. For instance, dilute DHLA-hydroxyPEG QDs and poly(PEG)-PIL QDs (<100 nM) were stored at RT under ambient room lighting. Both samples had been dialyzed to remove excess ligand in the solution. Within 15 h, the DHLA-hydroxyPEG QDs precipitated from the solution presumably due to photooxidation of the dithiol group, while poly(PEG)-PIL coated QDs remained stable under ambient conditions for at least 2 months (Figure S5D).
Figure 3.
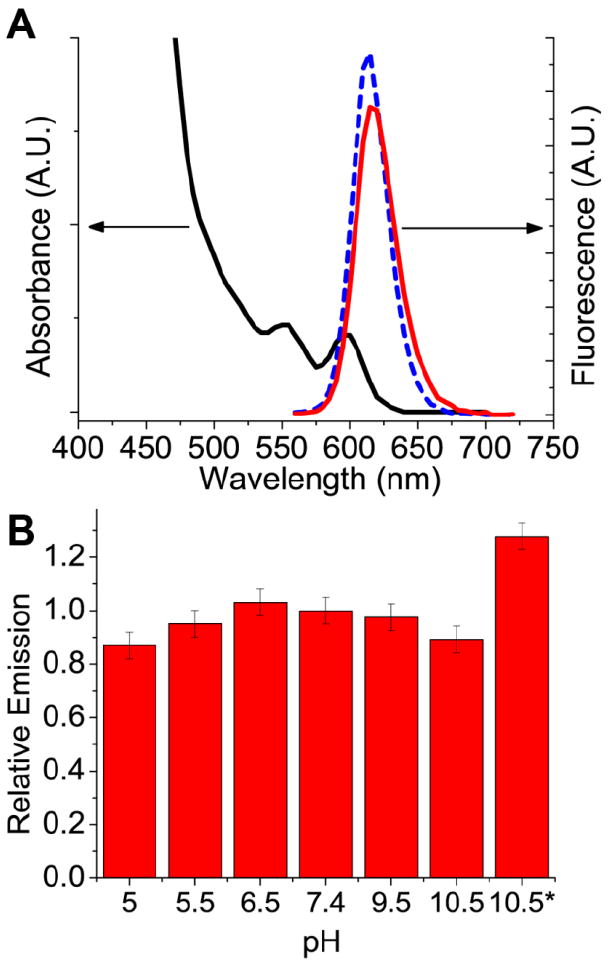
(A) Absorption spectra (—, black) and emission spectra of QDs before ligand exchange in octane ( , blue), and after ligand exchange in PBS (
 , red), showing a slight decrease in fluorescence intensity with a final QY in water of >60%. (B) Stability of polyPEG QDs in various pH buffers after incubation at RT for 4 h. pH 10.5* refers to emission intensity after 5 minutes irradiation under 365nm UV light, showing ~20% photobrightening.
Figure 4.
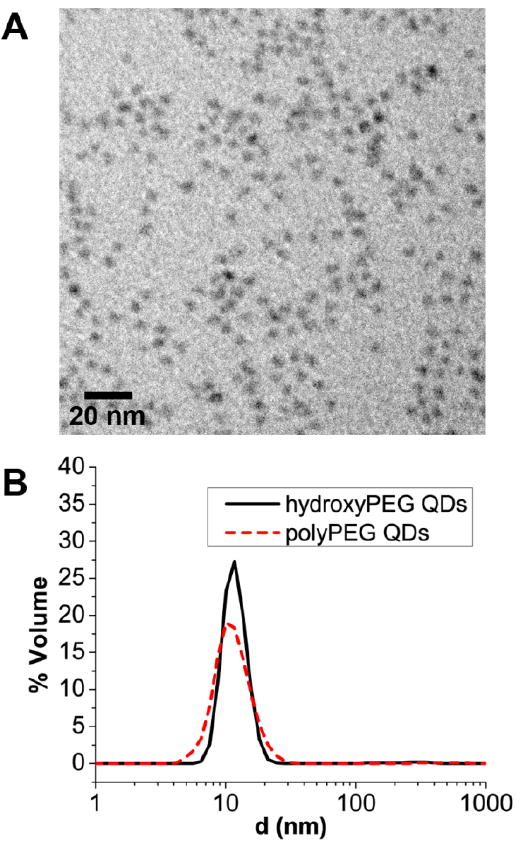
Size analysis of poly(PEG) QDs. (A) TEM of QDs ligand exchanged with polyPEG, showing non-aggregated mono-disperse samples. (B) Dynamic light scattering measurement of QDs ligand exchanged with hydroxyPEG (—, black) and QDs ligand exchanged with polyPEG (, red), both showing an HD of ~11.5 nm.
Three-component Random Copolymers for Functionalized Biocompatible QDs
With robustness and compactness of poly(PEG)-PIL coated QDs established, we turned our attention to incorporating chemical functionality into the polymer so that the QDs can be subsequently derivatized for targeting and sensing applications. Multi-functional polymers can be synthesized from monomers 4 and 6, along with one of monomers 8, 9, or 11, to give functionalized QDs with primary amine or biotin groups upon water solubilization. Copolymerization with three monomers proceeded smoothly, with good size control and low polydispersity (Figure S6), and functional monomers were incorporated at mole fractions ranging from 10-25%. As mentioned previously, the incorporation of all monomers was maximized by running the polymerization to >90% conversion, as overlapping 1H signals made it difficult to determine the final polymer composition by NMR. Using the short aminoPEG3 monomer 8, polymers with amine functionalities were synthesized with the functional group close to the surface of the QD after ligand exchange, making this system ideal for dye conjugation and energy transfer sensing applications, as detailed below. Polymers with amine functionalities tethered by longer linkers were synthesized using the aminoPEG11 monomer 9. These polymers were found to be more suitable for the conjugation of QDs to larger biomolecules such as proteins and antibodies, as the longer PEG11 linker makes the terminal amino groups more sterically accessible. Using the monomer 11, polymers bearing a biotin functionality were also synthesized, giving water soluble QDs that bind readily to streptavidin coated plates (Figure S7). The synthesis of functional three-component copolymers affords a versatile and facile way of tuning the QD surface functionality for a wide range of potential applications.
Conjugation to an Energy Transfer Dye
A salient feature of the copolymer ligand strategy is the ability to incorporate side-chains that can be readily derivatized in aqueous solution. To demonstrate covalent derivatization, we conjugated 5-carboxy-X-rhodamine (ROX), a red-emitting fluorescent dye, to QDs ligand exchanged with poly(aminoPEG3)10%-PILs via an amide linkage. The dye absorbance offers a convenient indication of the coupling yield. Additionally, the typical radial distance from the QD to the derivatization site may be determined from a Förster resonance energy transfer (FRET) analysis of the QD-dye pair.40,41
To form conjugates, an aliquot of the amine-reactive succinimidyl ester of 5-ROX (either obtained commercially, or prepared from the 5-ROX free acid and N-hydroxysuccinimide with dicyclohexylcarbodiimide) in dimethyformamide was added to a solution of the QDs in phosphate buffer at pH 7.6. Following the coupling reaction, the QDs were separated from unbound dye and NHS byproduct via size exclusion chromatography. Figure 5 shows theabsorption and emission spectra of a purified QD-ROX conjugate made using 562 nm-emitting CdSe(CdS) QDs and 27 equivalents of the activated dye. The dye contribution to the sample absorbance is clearly visible in Figure 5A as a shoulder on the red side of the lowest energy exciton peak. A fit of the spectrum as a sum of QD and dye components reveals an average dye:QD ratio of 1.78:1. Figure 5B shows the photoluminescence (PL) spectrum of the conjugate under 450 nm excitation. At this wavelength, ROX dye has minimal absorbance, allowing for the selective excitation of the QD. The QD PL peak is significantly quenched versus that of a control sample that was processed similarly but not modified with the ROX dye, while the ROX emission centered at 610 nm is significantly enhanced versus that of the free dye when normalized for the sample concentrations. These observations are consistent with energy transfer; a fit of the emission spectrum reveals an energy transfer efficiency of 88%.
Figure 5.
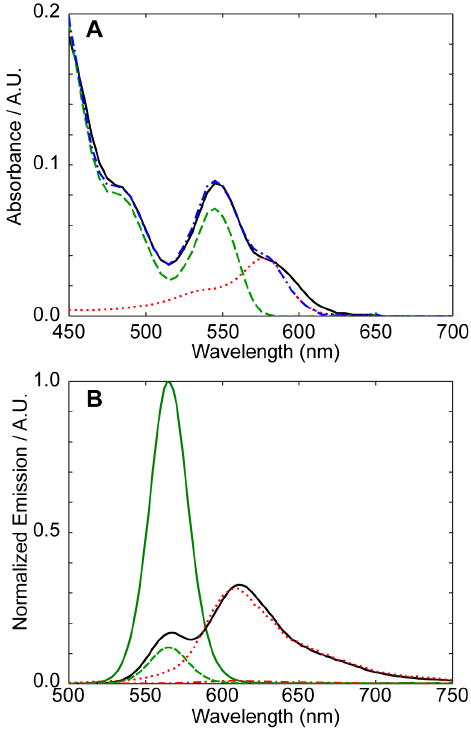
Covalent derivatization of poly(aminoPEG3)10% with ROX dye molecules. (A) Absorption spectrum of purified conjugate (—, black), least-squares fit of conjugate spectrum ( , blue), as sum of QD (
 , green) and free ROX (
 , red) contributions. (B) Photoluminescence spectrum of conjugate (—, black) and of control QD (
 , green) and free dye (
 , red), normalized to reflect the QD and ROX concentrations, respectively, present in the conjugate sample. Contributions of QD (, green) and free ROX (, red) to conjugate emission spectrum as obtained from a least-squares fit are also shown. All samples are excited at 450 nm, with dye emission showing 31 fold enhancement from the free dye vs. the conjugate.
The high energy transfer efficiency suggests that the copolymer ligand system is able to poise small-molecule substituents in proximity to the QD core. Indeed, analysis of the observed efficiency and spectral overlap according to the Forster model (Figure S8) suggests a characteristic separation distance of no more than 4.5 nm, which is consistent with observations of a small hydrodynamic radius for the ligand-exchanged QDs. The limited coupling yield observed here may indicate saturation of the available primary amine binding sites, suggesting that not all amine side-chains on the polymer are sufficiently accessible from the solvent, possibly due to the affinity of amines for the QD surface.
In order to gauge the number of free amines that are solution accessible, we probed the PIL-coated QDs with Fluorescamine, an amine-reactive fluorogenic probe (Figure S9). For QDs coated with poly(aminoPEG3)5%, the average number of measured free amines exposed to solution per QD was only ~1. This low number suggests that most of the amines are in fact bound to the QD surface and are inaccessible to the solvent. Increasing the mole fraction of compound 8 from 5% to 20% (i.e. poly(aminoPEG3)20%) increased the average amine:QD ratio to ~8:1. Indeed, using poly(aminoPEG3)25% coated QDs for dye conjugation yielded ~4 dyes/QD (Figure S10).
Taken together, these results show that although some degree of amine binding is present, the incorporation of compound 8 into the polymer as a functional site for derivatization proved to be successful, and these initial results bode well for the derivatization of these QDs with dyes and other small molecules for applications in targeted biological imaging and sensing.
Nonspecific Binding to HeLa Cells
An absence of non-specific binding is essential to reliable targeting and/or sensing applications involving QDs. To test the non-specific binding of poly(PEG)-PIL based QDs, we incubated HeLa cells with QDs of various surface compositions and subsequently washed the cells 4x with phosphate-buffered saline (PBS). Since the level of non-specific binding is inherently low for such PEGylated QDs, the cells were incubated at high QD concentrations (~500 nM) in order to highlight the differences between the coatings. Fluorescence and phase contrast images of cells after washing are shown in Figure 6. As expected, DHLA coated QDs produced a high degree of nonspecific binding to both cells and glass.22 DHLA-hydroxyPEG coated QDs exhibited minimal non-specific binding, but some QD stickiness could be observed with enhanced contrast of the fluorescence images. Poly(PEG)-PIL QDs, when viewed under the same enhanced contrast, show virtually no non-specific binding, which may be attributed to several factors. First, the PEG chains of poly(PEG)-PILs are terminated in methoxy groups, which can further reduce non-specific binding versus PEG terminated with hydroxyl groups.29,42 Second, the PEG length of poly(PEG)-PILs is slightly longer versus that of DHLA-hydroxyPEG, and third, the methoxyPEG along the polymer backbone may offer a denser coverage of PEG groups to better passivate the QD surface. When amine groups are introduced in a three-component polymer (Figures 6D and 6E), we observe increasing levels of non-specific binding. Poly(aminoPEG3)10%-PIL QDs show slightly more non-specific binding versus DHLA-hydroxyPEG QDs, and poly(aminoPEG11)25%-PIL QDs exhibit even more non-specific binding, consisting with an increase in the amount of amines on the QD surface. Although the non-specific binding for poly(aminoPEG11)25%-PIL QDs appears to be non-trivial, the incubation for this particular experiment was performed at high QD concentration (500 nM). We demonstrate below that the covalent conjugation of streptavidin to poly(aminoPEG11)25%-PIL QDs and their subsequent targeting to cells at low QD concentrations resulted in labeling with good signal to noise and allowed for single molecule tracking of QDs with minimal background.
Figure 6.

Non-specific binding of QDs on HeLa cells as a function of ligand coating, with incubation at 500 nM QD concentration for 5 min at 4 °C , followed by 4x wash with PBS buffer before imaging. Top: QD fluorescence at 565 nm with excitation at 488 nm. All images are scaled to the same contrast with the exception of (B) and (C), for which the left section has the same contrast as the other images, while the contrast has been boosted in the right section to highlight the difference between (B) and (C). Bottom: corresponding DIC image. QDs were ligand exchanged with (A) DHLA, (B) hydroxyPEG, (C) poly(PEG), (D) poly(aminoPEG3)10%, and (E) poly(aminoPEG11)25%.
Conjugation to Streptavidin for Specific Targeting
In order to demonstrate the capability of PIL-based QDs for targeted single molecule imaging in live cells, poly(aminoPEG11)25%-PIL QDs were conjugated to streptavidin (SA) via 1-ethyl-3-(3-dimethylaminopropyl) carbodiimide (EDC) coupling chemistry. For targeting, HeLa cells were transfected with a plasmid for yellow fluorescent protein (YFP), fused to an extracellular acceptor peptide (AP) tag13 and a transmembrane domain (TM) for cell surface targeting (AP-YFP-TM), as well as with a plasmid for endoplasmic reticulum-localized biotin ligase (BirA).22,43 The AP tag is specifically biotinylated by the co-expressed BirA and displayed on the cell surface along with YFP via the TM domain. The QD-SA conjugates were then added for labeling. At a high QD labeling concentration of 100 nM, excellent co-localization was observed between the YFP and QD channels, with very low levels of non-specific binding to non-transfected cells and glass (Figure 7A). A control experiment in which the QD-SA construct was pre-incubated with biotin showed no binding, confirming that the binding interaction was indeed between the QD-SA and biotin on the cell surface (Figure 7B). By reducing the QD labeling concentration to 10 nM, single QDs could be readily observed (Figure 7C), as identified by their fluorescence intermittency behavior (Figure S11). As previously discussed, DHLA-PEG based QDs are subject to degradation via loss of ligand coating after ~1 week and become increasingly sticky to cells. By contrast, in our experience, PIL-based QDs remain non-sticky and functional on the timescale of months.
Figure 7.

Targeting of poly(aminoPEG11)25% QD-SA conjugates to live HeLa cells transfected with AP-YFP-TM. (A) Ensemble labeling with 100 nM QDs. (B) Same as in (A), but with QDs pre-incubated with biotin. (C) Low-density labeling with 10 nM QD-SA reveals single QDs.
Non-specific Binding in Serum Proteins for in-vivo Applications
PEG11 monomer 6 is always present in a significant mole fraction within the polymer not only to provide water solubility, but also to mitigate nonspecific binding and prevent biofouling of QDs. To illustrate the stability of these QDs for in-vivo applications, we incubated various polymer-coated CdSe(CdZnS) 565-nm emitting QDs with mouse bovine serum at 37 °C for 4 h and analyzed the samples by size exclusion chromatography with fluorescence detection to determine the extent of non-specific binding to serum protein. In the case of QDs coated with DHLA-hydroxyPEG, significant serum protein binding was observed, as indicated by the formation of a large broad peak eluting at earlier times after serum incubation versus control (Figure 8A). Previous serum binding experiments using DHLA-hydroxyPEG on InAs(ZnSe) QDs revealed low levels of non-specific binding to serum protein.2 The discrepancy is likely due to the relative size of the QD cores. In the InAs(ZnSe) case, the inorganic cores were on the order of 2 nm in diameter, and the PEG8 group of DHLA-hydroxyPEG provided sufficient passivation against non-specific binding. The CdSe(CdZnS) QDs used in this study are approximately twice the diameter and the relatively short PEG8 chains of DHLA-hydroxyPEG are less able to provide full surface passivation. By contrast, QDs coated with poly(PEG)-PIL, exhibited negligible non-specific
Figure 8.

Non-specific binding of QDs with serum proteins after incubation with 95% mouse bovine serum for 4 h at 37 °C. QDs before incubation ( , red) and after incubation (—, black) for (A) hydroxyPEG QDs, (B) poly(PEG) QDs, and (C) poly(aminoPEG3)10% QDs. Insets show fluorescence spectrum of eluent at time indicated by the black arrow, showing QD emission.
Probing the Tumor Microenvironment using poly(PEG)-PIL QDs as a Diffusion Tracer
Taking advantage of the low serum binding of poly(PEG)-PIL QDs, we observed the distribution present on the surface of the vascular endothelial cells.44 CdSe(CdS) poly(PEG)-PILs QDs emitting at 605 nm were injected retro-orbitally, and the tumor vasculature was imaged over 6 h. Initially, the QDs are confined within the vessel lumen. At 3 h, we observed clearance from the vasculature and the simultaneous appearance of QDs in the tumor tissue. After 6 h, the QDs had extravasated into the tumor tissue, appearing as a uniform signal spread throughout the field of view. The QDs appeared stable, and there was no indication of stickiness or aggregation on the lumen wall or in the tumor tissues. Having a stable, small, biocompatible QD scaffold should enable the use of these QDs as robust in-vivo sensors.41
Conclusion
We have synthesized a new class of coordinating polymers that produce aqueous QDs with greater stability and shelf-life compared with previously reported DHLA-derived ligands, while maintaining the desirable QD properties of low non-specific binding, small size, facile derivatizability, and high QY. By using a three-monomer co-polymerization scheme, we were able to produce multi-functional aqueous QDs featuring imidazole groups for multidentate binding to the QD surface, PEG groups for water solubility and mitigation of non-specific binding, and either amine groups or biotin groups on the surface for derivatization. The monomer synthesis is facile and can be scaled to multi-gram quantities, and by utilizing RAFT polymerization, a wide variety of monomers were used to produce aqueous QDs with controllable surface properties and compositions. The enhanced QD stability enabled by these new polymers is crucial for cellular/in-vivo targeting and imaging/sensing applications in which the QDs must survive conjugation with dyes or proteins and subsequent purification steps in order to arrive at functional probes. Our poly-imidazole binding motif relieves the necessity to perform these steps in prompt succession. Often, weeks or months of time are needed to properly culture cells or raise animals for QD imaging studies, and these new QDs enable the long-term storage of functional sensing/targeting constructs for such studies. Furthermore, we demonstrate the utility of small non-sticky poly(PEG)-PIL QDs for achieving extravasation from the tumor vasculature in mice with uniform distribution, paving the way for studies of the tumor microenvironment. The modularity of the PIL system can potentially accommodate an even wider diversity of monomers, expanding the scope of functionalities achievable on QD surfaces well beyond the examples provided in this study.
Experimental
Materials and Instrumentation
All chemicals unless indicated were obtained from Sigma Aldrich and used as received. Air sensitive materials were handled in an Omni-Lab VAC glove box under dry nitrogen atmosphere with oxygen levels <0.2 ppm. All solvents were spectrophotometric grade and purchased from EMD Biosciences. Amine-bearing compounds were visualized on thin layer chromatography (TLC) plates using a ninhydrin solution. Acrylate compounds bearing terminal vinyl groups were visualized on TLC using KMnO4. All other TLC plates were visualized by iodine staining. Flash column chromatography was performed on a Teledyne Isco CombiFlash Companion. 1H NMR spectra were recorded on a Bruker DRX 401 NMR Spectrometer. UV-Vis absorbance spectra were taken using an HP 8453 diode array spectrophotometer. Photoluminescence and absorbance spectra were recorded with a BioTek Synergy 4 Microplate Reader. Dynamic light scattering analysis was performed on a Malvern Instruments ZetaSizer ZS90 in a low volume 12 μL quartz cuvette, with QD concentrations between 1-3 μM. Polymer molecular weights were determined in DMF solutions on an Agilent 1100 series HPLC/GPC system with three PLgel columns (103, 104, 105 Å) in series against narrow polystyrene standards.
Compound 2
To a stirred solution of acrylic acid (1.00 g, 13.88 mmol) and N-hydroxysuccinimide (NHS) (1.91 g, 16.65 mmol) in 40 mL of dry THF was added dropwise a solution of dicyclohexylcarbodiimide (DCC) (3.43g, 16.65 mmol) in 10 mL dry THF with stirring at 4 °C. The solution was warmed to room temperature and stirred for 2 h. Precipitates were removed by filtration, and the solvent was evaporated in vacuo. Ethylacetate (50 mL) was added to facilitate further precipitation of reaction byproducts, and the solution was filtered once more. The solvent was evaporated and the product dissolved in either 10 mL of anhydrous DMF or dry THF to create a stock solution, which was used in later reaction steps without further purification.
Compound 4
To an aqueous solution of sodium bicarbonate (50 mL, 0.3 M) was added DMF (50 mL) and histamine dihydrochloride (2.50 g, 13.59 mmol). To this solution was added compound 2 (2.75 g, 16.3mmol) in a solution of DMF, with stirring at 4 °C. The reaction was monitored via TLC by ninhydrin stain for primary amines, and confirmed to be complete after 30 min to give the crude compound 3. The solvent was removed in vacuo, and the product redissolved in DMF (50 mL). The solution was filtered, and triethylamine was introduced (2.27 mL, 16.30 mmol). Di-tert-butyl dicarbonate was added dropwise at 4 °C, and the solution was stirred overnight at RT. Water was added and the solution extracted with CHCl3 (3 × 25 mL). The organics were combined and dried over sodium sulfate, and the solvent removed in vacuo. The crude product was purified by silica column (ethyl acetate/hexanes gradient 50:50 to 100:0, v/v) to give the pure product as a clear oil (2.59 g, 72% yield). 1H NMR (400 MHz, CDCl3): δ (ppm) 7.95 (s, 1H), 7.10 (s, 1H), 6.19 (dd, J1 = 1.8 Hz, J2 = 17.0 Hz, 1H), 6.07 (dd, J1 = 9.8 Hz, J2 = 17.0 Hz, 1H), 5.53 (dd, J1 = 1.8 Hz, J2 = 10.0 Hz, 1H), 3.53 (dt, 2H), 2.72 (t, 2H), 1.54 (s, 9H).
Compound 5
Neat methoxy poly(ethylene glycol) (10 g, 18.18 mmol, average MW 550 g/mol) was degassed at 80 °C for 1 h with stirring to remove traces of water. The flask was back-filled with N2 and cooled on an ice bath before thionyl chloride (1.98 mL, 27.27 mmol) was slowly added. The solution was warmed to 25 °C and stirred for 2 h. The conversion was monitored by the disappearance of the broad O–H stretch at 3,500 cm−1 and the appearance of a C–Cl stretch at 730 cm−1 in the IR spectrum. The product was diluted with DMF (20 mL) and the solvent removed under reduced pressure. This was repeated three times to remove all residual traces of thionyl chloride. The sample was dissolved in a solution of sodium azide (1.77 g, 27.27 mmol) in 100 mL DMF and stirred overnight at 85 °C. The solvent was removed under reduced pressure and 200 mL of dichloromethane was added. The precipitate was removed by vacuum filtration and the solvent evaporated in vacuo to yield the intermediate mono-azide. The sample was dissolved in 150 mL of tetrahydrofuran (THF), and triphenylphosphine (7.15 g, 27.27 mmol) was added. The solution was stirred at 25 °C for 4 h before adding 1 mL of water and stirring overnight. The THF was removed in vacuo and 100 mL of water was added. The precipitate was removed by vacuum filtration and the filtrate washed with toluene (3 × 50 mL). The water was removed in vacuo to yield the pure product as light yellow oil (9.67 g, 95%). 1H NMR (400 MHz, CDCl3): δ (ppm) 3.69 – 3.46 (m, 46H), 3.37 (s, 3H), 2.85 (t, 2H).
Compound 6
To a solution of compound 5 (2.20 g, 3.94 mmol) in dry THF was added compound 2 (1.00 g, 5.92 mmol) in a solution of dry THF, with stirring at 4 °C. The reaction was monitored via TLC by ninhydrin stain for primary amines, and confirmed to be complete after 30 min. The solution was filtered and the solvent evaporated in vacuo. The crude product was purified by silica column (methanol/ethyl acetate gradient 0:100 to 5:95, v/v) to give the pure product as a pale yellow oil (1.88 g, 78% yield). 1H NMR (400 MHz, CDCl3): δ (ppm) 6.68, 6.19 (dd, J1 = 2.0 Hz, J2 = 17.0 Hz, 1H), 6.08 (dd, J1 = 9.8 Hz, J2 = 17.0 Hz, 1H), 5.52 (dd, J1 = 2.0 Hz, J2 = 9.8 Hz, 1H), 3.56 – 3.37 (m, 48H), 3.27 (s, 3H).
Compound 8
To a solution of 4,7,10-trioxa-1,13-tridecanediamine (10.00 g, 45.45 mmol) in DCM (25 mL) was added dropwise di-tert-butyl dicarbonate (1.98 g, 9.09 mmol) at 4 °C. The solution was allowed to warm to RT and stirred overnight. The solution was washed with water (3 × 20 mL) to remove unreacted starting material. TLC analysis with ninhydrin staining shows mostly mono-substituted product in the organic phase. The organics were dried over sodium sulfate and solvent removed in vacuo. The crude product (3.80 g, 17.27 mmol) was dissolved in a mixture of aqueous sodium bicarbonate buffer (20 mL, 0.3 M), and DMF (20 mL), to which compound 2 (3.38 g, 20.00 mmol) was added dropwise in a solution of DMF with stirring at 4 °C. The reaction was monitored via TLC by ninhydrin stain for primary amines, and confirmed to be complete after 30 min. Water was added and the solution extracted with CHCl3 (3 × 25 mL). The organics were combined and dried over sodium sulfate, and the solvent removed in vacuo. The crude product was purified by silica column (ethyl acetate/methanol gradient 100:0 to 95:5, v/v) to give the pure product as a clear oil (4.52 g, 27% yield). 1H NMR (400 MHz, CDCl3): δ (ppm) 6.23 (dd, J1 = 2.0 Hz, J2 = 17.0 Hz, 1H), 6.08 (dd, J1 = 9.8 Hz, J2 = 17.0 Hz, 1H), 5.56 (dd, J1 = 2.0 Hz, J2 = 9.8 Hz, 1H), 3.65 – 3.44 (m, 14H), 3.17 (t, 2H), 1.83 – 1.65 (m, 4H), 1.39 (s, 12H).
Compound 9
To a solution of O-(2-Aminoethyl)-O′-[2-(Boc-amino)ethyl]decaethylene glycol (0.50 g, 0.78 mmol) in dry THF (25 mL) was added triethylamine (0.086 g, 0.85 mmol) and compound 2 (0.20 g, 1.16 mmol) dropwise in a solution of THF with stirring at 4 °C. The reaction was monitored via TLC by ninhydrin stain for primary amines, and confirmed to be complete after 30 min. The solution was filtered and the solvent removed in vacuo. The crude product was purified by silica column (DCM/MeOH gradient 100:0 to 95:5, v/v) to give the pure product as a clear oil (0.38 g, 70% yield). 1H NMR (400 MHz, CDCl3): δ (ppm) 6.28 (dd, J1 = 2.0 Hz, J2 = 17.0 Hz, 1H), 6.16 (dd, J1 = 9.8 Hz, J2 = 17.0 Hz, 1H), 5.59 (dd, J1 = 2.0 Hz, J2 = 9.8 Hz, 1H), 3.70 – 3.50 (m, 46H), 3.30 (q, 2H), 1.42 (s, 9H).
Compound 10
To a solution of O-(2-Aminoethyl)-O′-[2-(Boc-amino)ethyl] decaethylene glycol (0.50 g, 0.78 mmol) in DMF (150 mL) was added biotin (0.21 g, 0.86 mmol) and EDC (0.13 g, 0.86 mmol). The solution was stirred overnight, and the solvent removed in-vacuo. The crude product was purified by silica column (DCM/MeOH 98:2, v/v) to give the pure product as a colorless oil (0.63 g, 85% yield). 1H NMR (400 MHz, CDCl3): δ (ppm) 4.23 (m, 1H), 4.43 (m, 1H), 3.48 (m, 4H), 3.52-3.61 (m, 40H), 3.24 (m, 2H), 3.35 (m, 2H), 2.82 (dd, J1 = 12.8 Hz, J2 = 4.9 Hz, 1H), 3.06 (m, 1H), 1.37 (s, 9H), 2.68 (d, J = 12.8 Hz, 1H), 2.16 (t, J = 7.5 Hz, 2H), 1.60 (m, 4H), 1.40 – 1.32 (m, 2H).
Compound 11
To compound 10 (0.50 g, 0.57 mmol) was added 4 M HCl in dioxane, and stirred for 1 h at room temperature. The solvent was removed in vacuo, and the crude product dissolved into a solution of 0.25 M aqueous sodium bicarbonate with DMF. To this solution was added dropwise a solution of compound 2. The reaction was monitored via TLC by ninhydrin stain for primary amines and confirmed to be complete after 30 min. The solvent was removed in vacuo, and the crude product was purified by silica column chromatography (DCM:MeOH 98:2, v/v) to give the product as a colorless oil (0.31 g, 65% yield). 1H NMR (400 MHz, CDCl3): δ (ppm) 6.28 (dd, J1 = 2.0 Hz, J2 = 17.0 Hz, 1H), 6.17 (dd, J1 = 9.8 Hz, J2 = 17.0 Hz, 1H), 5.61 (dd, J1 = 2.0 Hz, J2 = 9.8 Hz, 1H), 4.49 (m, 1H), 4.30 (m, 1H), 3.48-3.72 (m, 44H), 3.42 (m, 2H), 3.13 (m, 1H), 2.89 (dd, J1 = 12.8 Hz, J2 = 4.9 Hz, 1H), 2.74 (d, J = 12.8 Hz, 1H), 2.22 (t, J = 7.4 Hz, 2H), 1.66 (m, 4H), 1.43 (m, 2H).
Typical PIL Polymerization
All monomers were kept as dilute stock solutions between 30-100 mg/mL in either ethylacetate or methanol. Stock solutions of RAFT agent 12 were prepared at 220 mg/mL in DMF, and AIBN was prepared at 50 mg/mL in DMF. All reagents were weighed out volumetrically. In a typical polymerization, monomers 4 (33 mg, 0.13 mmol) and 6 (77 mg, 0.13 mmol) were added to an 8 mL vial. The solvent was removed in vacuo and 50 μL of dry DMF along with RAFT agent 12 (2.53 mg, 0.0088 mmol), and AIBN (1.43 mg, 0.0088 mmol) were added. The contents of the vial were mixed, centrifuged at 5000 g for 2 min, and then transferred to a 1 mL ampoule. The ampoule was subjected to 4 cycles of freeze-pump-thaw, and sealed under vacuum using a butane torch. The vial was heated to 70 °C on an oil bath for 1.5-3 h, after which 0.5 mL of a 4 M HCl in dioxane solution was added to cleave the BOC protecting groups. After 1 h at RT, the HCl was removed in vacuo. The deprotected polymer was dissolved in MeOH, to which a solution of NaOH in MeOH (1M) was added dropwise to adjust the pH to be between 8-9. The solvent was removed in vacuo, and then CHCl3 was added to precipitate the salts. The solution was filtered through a 0.45 μm PTFE filter and the solvent removed in vacuo to yield the final polymer for QD ligand exchange.
Quantum Dot Synthesis
CdSe cores were synthesized according to previously reported procedures,20,48,49 and were overcoated with either Zn0.8Cd0.2S alloy shells or pure CdS shells. The alloy shell overcoating procedure has been described previously,20,49 and was used here to obtain QDs emitting at 565 and 605 nm with QYs of ~80% when diluted in hexane. For pure CdS shells, we developed a successive ion layer adsorption and reaction (SILAR) procedure that is modified from those reported by Peng et al and Mews et al (Xie JACS).36,37 Briefly, CdSe cores with a first exciton feature at 491 nm were synthesized by heating a mixture of trioctylphosphine (TOP), trioctylphosphine oxide (TOPO), CdO (0.9 mmol), and tetradecylphosphonic acid (TDPA, 2.0 mmol) to 340 °C under nitrogen, removing evolved water in vacuo at 160 °C, re-heating to 360 °C under nitrogen, and rapidly introducing trioctylphosphine selenide (TOPSe, 3.4 mmol) in trioctylphosphine (TOP), followed by cooling to room temperature. Cores isolated by repeated precipitations from hexane with acetone were brought to 180 °C in a solvent mixture of oleylamine (3 mL) and octadecene (6 mL). Aliquots of Cd and S precursor solutions were then introduced alternately starting with the metal (Cd), waiting 15 min between the start of each addition. The Cd precursor consisted of 0.6 mmol Cd-oleate and 1.2 mmol decylamine in a solvent mixture of octadecene (3 mL) and TOP (3 mL). The S precursor consisted of 0.6 mmol hexamethyldisilathiane [(TMS)2S] in 6 mL TOP. The dose of each overcoating precursor aliquot was calculated to provide a single monolayer of ions to the QD surface. Addition of a total of 4 aliquots each of Cd and S yielded QDs with emission at 562 nm and a QY close to unity when diluted in hexane. A similar procedure was performed on larger CdSe cores to obtain CdSe(CdS) QDs emitting at 610 nm.
Ligand Exchange with poly(PEG)-PIL
QDs (2 nmol) were precipitated using MeOH and brought into 50 μL of CHCl3. The QD stock solution was mixed with solution of poly(PEG) (5 mg) in CHCl3 (30 μL), and stirred for 10 min at RT, after which 30 μL of MeOH was added followed by stirring for an additional 20 min. QD samples were precipitated by the addition of EtOH (30 μL), CHCl3 (30 μL), and excess hexanes. The sample was centrifuged at 4000 g for 2 min. The clear supernatant was discarded, and the pellet dried in vacuo, followed by the addition of PBS (500 μL, pH 7.4) was added. The aqueous sample was then filtered through a 0.2 μm filter syringe filter before use.
Fluorescamine assay of amines on surface of PIL-QDs
QDs emitting at 543 nm ligand-exchanged with various PILs were purified by dialysis 3x through a 50kDa MW cut-off spin concentrator. The QDs were adjusted to 1-2 μM concentration and placed into an eppendorf tube (240 uL). To the tube was added a solution of fluorescamine in acetone (10 uL, 28 mg/mL) followed by vigorous vortexing. The samples were incubated for 10 min at RT and the photoluminescence intensity of Fluorescamine was recorded at 480 nm with an excitation at 380 nm. The amine concentration versus fluorescence count was obtained via a calibration curve generated by performing the same assay on a serial dilution of a known concentration of compound 5.
Covalent Conjugation of Streptavidin to poly(aminoPEG11)25%-PIL QDs
Stretpavidin (50 μL, 10 mg/mL; Sigma Aldrich) was activated in MES buffer (pH 6.5) using Sulfo-NHS and EDC (20 eq) for 20 min at RT. The activated SA was mixed with poly(aminoPEG11)25%-PIL QDs in sodium bicarbonate buffer at pH 8.4 at a SA:QD ratio of 5:1 and allowed to react for 1 h. The samples were dialyzed 2x through a 50 kDa MW cut-off spin concentrator and then used for labeling experiments.
Quantum Yield Measurement
QY of 605 nm emitting QDs was measured relative to Rhodamine 640 (λex = 535 nm). Solutions of QDs in PBS and dye in ethanol were optically matched at the excitation wavelength. Fluorescence spectra of QD and dye were taken under identical spectrometer conditions in triplicate and averaged. The optical density was kept below 0.1 between 300-800 nm, and the integrated intensities of the emission spectra, corrected for differences in index of refraction and concentration, were used to calculate the QYs using the expression QYQD = QYDye × (Absorbancedye/AbsorbanceQD) × (Peak AreaQD/Peak AreaDye) × (nQD solvent)2/(nDye solvent)2.50
Gel Filtration Apparatus
GFC was performed using an ÄKTAprime Plus chromatography system from Amersham Biosciences equipped with a self-packed Superdex 200 10/100 glass column. PBS (pH 7.4) was used as the mobile phase with a flow rate of 1.0 mL/min. For amine functionalized polymers, the PBS buffer was supplemented with 50 mM of 2-(2-aminoethoxy)ethanol. Typical injection volumes were 100 μL. Detection was achieved by measuring the absorption at 280 nm.
Fluorescamine Assay of Amine Reactivity
Stock solutions of either amine-containing polymers were made at 20 mg/mL concentration. A serial dilution was made using 1, 2, and 4 uL of polymer stock into 240 uL of PBS buffer, followed by addition of 10 uL of a 30 mg/mL solution of fluorescamine. This mixture was vortexed and incubated at room temperature for 10 min before fluorescence analysis on a BioTek plate reader with excitation at 380 nm and detection at 480 nm. The recorded fluorescence intensity signals were calibrated against solutions of known concentrations of compound 5 (methoxyPEG-NH2).
Cell Culture
HeLa cells were grown in DMEM (Mediatech) with 10% Fetal Bovine Serum (Invitrogen), 50 U/mL penicillin and 50 μg /mL streptomycin (Invitrogen). The cells were transfected using 1 μL Lipofectamine 2000 (Invitrogen), 0.2 μg of BirA-ER plasmid22,43 and 0.2 μg of AP-YFP-TM plasmid per well of an 8-well chamber slide (LabTek). 1 mM biotin was added to the media during plasmid expression. Cells were imaged under 4 °C PBS the day after transfection. 1% Bovine Serum Albumin (Sigma) was added to block non-specific binding during specific binding studies of ligand-coated quantum dots. Commercial BSA is known to contain biotin, and the stock BSA solution was dialyzed with a 3 kDa cutoff dialysis tube three times for 8 h in PBS pH 7.4, in 4 °C.
Non-specific binding of QDs to serum
565 nm emitting CdSe(CdZnS) QDs (5 μL) of various surface coatings were mixed with fetal bovine serum (95 μL) to a final concentration of ~0.5 μM. The mixture was incubated for 4 h at 37 °C with gentle mixing. The resultant QD size distribution was then measured using gel filtration chromatography. The mixture was injected into a Superose 6 GL10/300 column (GE Healthcare, Piscataway, NJ) on an Agilient 1100 series HPLC with an in-line degasser, autosampler, diode array detector, and fluorescence detector (Roseville, CA). PBS (pH 7.4) was used as the mobile phase with a flow rate of 0.5 mL/min and an injection volume of 50 μL. In order to selectively measure the signal from the QD rather than FBS, the fluorescence detection at 565 nm with 250 nm excitation was chosen.
Fluroescence and Phase Contrast Microscopy
Cells were imaged live using a Nikon TE2000-U inverted microscope with a 60x water-immersion lens and a Princeton Instruments MicroMAX Camera with an additional 1.5x magnification tube lens. Bright field images were collected using differential interference contrast and 10 ms exposure. Fluorescence images were collected with epifluorescent excitation provided by the 488 nm line of an Argon-Ion laser with the appropriate dichroic (Chroma, Z488RDC) and emission filters (QD605: D605/30M, YFP: D565/30m). Images were collected and analyzed using Image J version 1.41o. Typical exposure times were 0.1-0.5 s and fluorescence images were background-corrected.
Animal and tumor models
Orthotopic P008 mammary carcinoma models were prepared by implanting a small piece (1 mm3) of viable tumor tissue from the source tumor animal into the mammary fat pad chamber44 of 10 – 12 weeks old female Tie2-GFP/FVB mice. The tumors were allowed to grow up to 5 mm in diameter. All animal procedures were carried out following the Public Health Service Policy on Humane Care of Laboratory Animals and approved by the Institutional Animal Care and Use Committee of Massachusetts General Hospital.
Intravital Multiphoton Imaging
To study tumor vasculature using QDs and their distribution dynamic in live animals, 150 μL poly(PEG)-PIL QD600 at a concentration of 5 μM were injected retro-orbitally into the tumor bearing mice and imaged with multiphoton laser scanning microscope.51 The images were recorded as 3D stacks (200 μm thickness, 1 μm step size) at 0 hour, 3 h and 6 h interval respectively and processed using the NIH ImageJ software. For the GFP channel, the emission filter used was 535±20 nm, and for QD600, the emission filter was 625±75 nm. All images were captured with a 20x water emersion lens (N.A. 0.95) and an excitation wavelength of 880 nm (500 mW).
Supplementary Material
Figure 9.
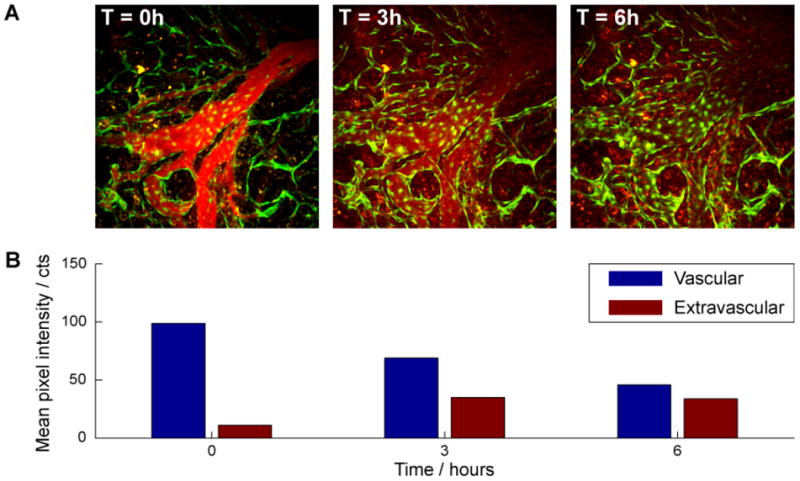
(A) Time lapsed live QDs imaging of P008 tumor vasculature in Tie2-GFP/FVB mice. Red fluorescence corresponds to the signal from QDs within the vessel lumen (0 and 3h), or extravascular space in tumors (3 and 6h), while the green fluorescence is from the GFP in vascular endothelial cells that line the vessel wall. B, Mean QD (red channel) intensities within and outside of the blood vessels over time. Vessel regions are assigned by thresholding of the T=0h image. The QDs are initially confined within the vessels at T= 0. Images at later times reveal decreased vascular and increased extravascular fluorescence, indicative of clearance from the vessels and extravasation into tumor tissue, respectively.
Acknowledgments
This research was supported by the US National Cancer Institute grants R01-CA126642 (R.K.J, M.G.B, and D.G.N), R01-CA085140, R01-CA115767 (R.K.J), P01-CA080124 (R.K.J and D.F), R01-CA096915 (D.F); by the MIT-Harvard NIH Center for Cancer Nanotechnology Excellence (1U54-CA119349) (M.G.B.); by the MIT DCIF (CHE-980806, DBI-9729592); by the ISN (W911NF-07-D-0004) (M.G.B and D.G.N); by the NSF-MRSEC program (DMR-0117795) via the use of its shared user facilities; and by the Army Research Office (W911NF-06-1-0101) (D.G.N). W.L. was supported by a National Science Foundation Graduate Research Fellowship. A.B.G. was a Novartis fellow of the Life Sciences Research Foundation. We would like to thank Dan Liu and Peng Zou for valuable assistance with cells, plasmids, and cell culture protocols.
Footnotes
Supporting Information Available Supporting material contains 1H NMR characterization of monomers and polymers, Forster energy transfer calculations for QD-dye conjugates, GPC polymer sizing data, and optical characterization of QDs. This information is available free of charge via the Internet at http://pubs.acs.org/.
References
- 1.Dabbousi BO, Rodriguez-Viejo J, Mikulec FV, Heine JR, Mattoussi H, Ober R, Jensen KF, Bawendi MG. J Phys Chem B. 1997;101:9463–9475. [Google Scholar]
- 2.Zimmer JP, Kim S-W, Ohnishi S, Tanaka E, Frangioni JV, Bawendi MG. J Am Chem Soc. 2006;128:2526–2527. doi: 10.1021/ja0579816. [DOI] [PMC free article] [PubMed] [Google Scholar]
- 3.Bruchez M, Jr, Moronne M, Gin P, Weiss S, Alivisatos AP. Science. 1998;281:2013–2016. doi: 10.1126/science.281.5385.2013. [DOI] [PubMed] [Google Scholar]
- 4.Peng ZA, Peng X. J Am Chem Soc. 2001;123:183–184. doi: 10.1021/ja003633m. [DOI] [PubMed] [Google Scholar]
- 5.Michalet X, Pinaud FF, Bentolila LA, Tsay JM, Doose S, Li JJ, Sundaresan G, Wu AM, Gambhir SS, Weiss S. Science. 2005;307:538–544. doi: 10.1126/science.1104274. [DOI] [PMC free article] [PubMed] [Google Scholar]
- 6.Ballou B, Lagerholm BC, Ernst LA, Bruchez MP, Waggoner AS. Bioconjug Chem. 2004;15:79–86. doi: 10.1021/bc034153y. [DOI] [PubMed] [Google Scholar]
- 7.Dahan M, Levi S, Luccardini C, Rostaing P, Riveau B, Triller A. Science. 2003;302:442–445. doi: 10.1126/science.1088525. [DOI] [PubMed] [Google Scholar]
- 8.Michaluk P, Mikasova L, Groc L, Frischknecht R, Choquet D, Kaczmarek L. J Neurosci. 2009;29:6007–6012. doi: 10.1523/JNEUROSCI.5346-08.2009. [DOI] [PMC free article] [PubMed] [Google Scholar]
- 9.Iyer G, Michalet X, Chang YP, Pinaud FF, Matyas SE, Payne G, Weiss S. Nano Letters. 2008;8:4618–4623. doi: 10.1021/nl8032284. [DOI] [PMC free article] [PubMed] [Google Scholar]
- 10.Wu X, Liu H, Liu J, Haley KN, Treadway JA, Larson JP, Ge N, Peale F, Bruchez MP. Nat Biotechnol. 2003;21:41–46. doi: 10.1038/nbt764. [DOI] [PubMed] [Google Scholar]
- 11.Smith AM, Duan H, Rhyner MN, Ruan G, Nie S. Phys Chem Chem Phys. 2006;8:3895–3903. doi: 10.1039/b606572b. [DOI] [PubMed] [Google Scholar]
- 12.Howarth M, Chinnapen DJF, Gerrow K, Dorrestein PC, Grandy MR, Kelleher NL, El-Husseini A, Ting AY. Nat Meth. 2006;3:267–273. doi: 10.1038/NMETHXXX. [DOI] [PMC free article] [PubMed] [Google Scholar]
- 13.Howarth M, Takao K, Hayashi Y, Ting AY. Proc Natl Acad Sci USA. 2005;102:7583–7588. doi: 10.1073/pnas.0503125102. [DOI] [PMC free article] [PubMed] [Google Scholar]
- 14.Groc L, Heine M, Cognet L, Brickley K, Stephenson FA, Lounis B, Choquet D. Nat Neurosci. 2004;7:695–696. doi: 10.1038/nn1270. [DOI] [PubMed] [Google Scholar]
- 15.Aldana J, Wang YA, Peng X. J Am Chem Soc. 2001;123:8844–8850. doi: 10.1021/ja016424q. [DOI] [PubMed] [Google Scholar]
- 16.Algar WR, Krull UJ. Langmuir. 2006;22:11346–11352. doi: 10.1021/la062217y. [DOI] [PubMed] [Google Scholar]
- 17.Mattoussi H, Mauro JM, Goldman ER, Anderson GP, Sundar VC, Mikulec FV, Bawendi MG. J Am Chem Soc. 2000;122:12142–12150. [Google Scholar]
- 18.Uyeda HT, Medintz IL, Jaiswal JK, Simon SM, Mattoussi H. J Am Chem Soc. 2005;127:3870–3878. doi: 10.1021/ja044031w. [DOI] [PubMed] [Google Scholar]
- 19.Susumu K, Uyeda HT, Medintz IL, Pons T, Delehanty JB, Mattoussi H. J Am Chem Soc. 2007;129:13987–13996. doi: 10.1021/ja0749744. [DOI] [PubMed] [Google Scholar]
- 20.Liu W, Howarth M, Greytak AB, Zheng Y, Nocera DG, Ting AY, Bawendi MG. J Am Chem Soc. 2008;130:1274–1284. doi: 10.1021/ja076069p. [DOI] [PMC free article] [PubMed] [Google Scholar]
- 21.Sapsford KE, Pons T, Medintz IL, Higashiya S, Brunel FM, Dawson PE, Mattoussi H. J Phys Chem C. 2007;111 [Google Scholar]
- 22.Howarth M, Liu W, Puthenveetil S, Zheng Y, Marshall LF, Schmidt MM, Wittrup KD, Bawendi MG, Ting AY. Nat Methods. 2008;5:397–399. doi: 10.1038/nmeth.1206. [DOI] [PMC free article] [PubMed] [Google Scholar]
- 23.Medintz IL, Pons T, Delehanty JB, Susumu K, Brunel FM, Dawson PE, Mattoussi H. Bioconjugate Chem. 2008;19:1785–1795. doi: 10.1021/bc800089r. [DOI] [PubMed] [Google Scholar]
- 24.Medintz IL, Clapp AR, Brunel FM, Tiefenbrunn T, Uyeda HT, Chang EL, Deschamps JR, Dawson PE, Mattoussi H. Nat Mater. 2006;5:581–589. doi: 10.1038/nmat1676. [DOI] [PubMed] [Google Scholar]
- 25.Shen L, Pich A, Fava D, Wang M, Kumar S, Wu C, Scholes GD, Winnik MA. Journal of Materials Chemistry. 2008;18:763–770. [Google Scholar]
- 26.Yildiz I, McCaughan B, Cruickshank SF, Callan JF, Raymo FiM. Langmuir. 2009;25:7090–7096. doi: 10.1021/la900148m. [DOI] [PubMed] [Google Scholar]
- 27.Smith AM, Nie S. J Am Chem Soc. 2008;130:11278–11279. doi: 10.1021/ja804306c. [DOI] [PMC free article] [PubMed] [Google Scholar]
- 28.Kim S, Bawendi MG. J Am Chem Soc. 2003;125:14652–14653. doi: 10.1021/ja0368094. [DOI] [PubMed] [Google Scholar]
- 29.Bentzen EL, Tomlinson ID, Mason J, Gresch P, Warnement MR, Wright D, Sanders-Bush E, Blakely R, Rosenthal SJ. Bioconjugate Chemistry. 2005;16:1488–1494. doi: 10.1021/bc0502006. [DOI] [PubMed] [Google Scholar]
- 30.Wang M, Felorzabihi N, Guerin G, Haley JC, Scholes GD, Winnik MA. Macromolecules. 2007;40:6377–6384. [Google Scholar]
- 31.Wang M, Oh JK, Dykstra TE, Lou X, Scholes GD, Winnik MA. Macromolecules. 2006;39:3664–3672. [Google Scholar]
- 32.Fang C, Qi X-Y, Fan Q-L, Wang L-H, Huang W. Nanotechnology. 2007;18:035704–035704. doi: 10.1088/0957-4484/18/3/035704. [DOI] [PubMed] [Google Scholar]
- 33.Chiefari J, Chong YK, Ercole F, Krstina J, Jeffery J, Le TPT, Mayadunne RTA, Meijs GF, Moad CL, Moad G, Rizzardo E, Thang SH. Macromolecules. 1998;31:5559–5562. [Google Scholar]
- 34.Naoto A, Bungo O, Hideharu M, Takeshi E. Syn Lett. 2006;4:636–638. [Google Scholar]
- 35.Barner-Kowollik C. Handbook of RAFT Polymerization. Wiley-VCH; 2008. [Google Scholar]
- 36.Li JJ, Wang YA, Guo WZ, Keay JC, Mishima TD, Johnson MB, Peng XG. J Am Chem Soc. 2003;125:12567–12575. doi: 10.1021/ja0363563. [DOI] [PubMed] [Google Scholar]
- 37.Xie R, Kolb U, Li J, Basche T, Mews A. J Am Chem Soc. 2005;127:7480–7488. doi: 10.1021/ja042939g. [DOI] [PubMed] [Google Scholar]
- 38.Ueda EKM, Gout PW, Morganti L. J Chromatogr A. 2003;988:1–23. doi: 10.1016/s0021-9673(02)02057-5. [DOI] [PubMed] [Google Scholar]
- 39.Medintz IL, Clapp AR, Mattoussi H, Goldman ER, Fisher B, Mauro JM. Nat Mater. 2003;2:630–638. doi: 10.1038/nmat961. [DOI] [PubMed] [Google Scholar]
- 40.Snee PT, Somers RC, Nair G, Zimmer JP, Bawendi MG, Nocera DG. J Am Chem Soc. 2006;128:13320–13321. doi: 10.1021/ja0618999. [DOI] [PubMed] [Google Scholar]
- 41.Somers RC, Bawendi MG, Nocera DG. Chem Soc Rev. 2007;36:579–591. doi: 10.1039/b517613c. [DOI] [PubMed] [Google Scholar]
- 42.Mei BC, Susumu K, Medintz IL, Delehanty JB, Mountziaris TJ, Mattoussi H. J Mater Chem. 2008;18:4949–4958. [Google Scholar]
- 43.Howarth M, Ting AY. Nat Protoc. 2008;3:534–545. doi: 10.1038/nprot.2008.20. [DOI] [PMC free article] [PubMed] [Google Scholar]
- 44.Duda DG, Fukumura D, Munn LL, Booth MF, Brown EB, Huang PG, Seed B, Jain RK. Cancer Res. 2004;64:5920–5924. doi: 10.1158/0008-5472.CAN-04-1268. [DOI] [PubMed] [Google Scholar]
- 45.Jain RK, Munn LL, Fukumura D. Nat Rev Cancer. 2002;2:266–76. doi: 10.1038/nrc778. [DOI] [PubMed] [Google Scholar]
- 46.Jain RK, Brown EB, Munn LL, Fukumura D. Live Cell Imaging: A Laboratory Manual. Cold Spring Harbor Laboratory Press; Cold Spring Harbor, NY: 2004. pp. 435–66. [Google Scholar]
- 47.Huang P, Dawson M, Lanning R, Jain RK, Fukumura D. Journal of the American Association for Laboratory Animal Science. 2008;47:170–170. [Google Scholar]
- 48.Murray CB, Norris DJ, Bawendi MG. J Am Chem Soc. 1993;115:8706–8715. [Google Scholar]
- 49.Snee PT, Chan Y, Nocera DG, Bawendi MG. Adv Mater. 2005;17:1131–1136. [Google Scholar]
- 50.Eaton D. Pure Appl Chem. 1988;60:1107–1114. [Google Scholar]
- 51.Brown EB, Campbell RB, Tsuzuki Y, Xu L, Carmeliet P, Fukumura D, Jain RK. Nature Medicine. 2001;7:864–868. doi: 10.1038/89997. [DOI] [PubMed] [Google Scholar]
Associated Data
This section collects any data citations, data availability statements, or supplementary materials included in this article.