

Abstract
A mechanistic understanding of animal navigation requires quantitative assessment of the sensorimotor strategies used during navigation and quantitative assessment of how these strategies are regulated by cellular sensors. Here, we examine thermotactic behavior of the Drosophila melanogaster larva using a tracking microscope to study individual larval movements on defined temperature gradients. We discover that larval thermotaxis involves a larger repertoire of strategies than navigation in smaller organisms such as motile bacteria and Caenorhabditis elegans. Beyond regulating run length (i.e., biasing a random walk), the Drosophila melanogaster larva also regulates the size and direction of turns to achieve and maintain favorable orientations. Thus, the sharp turns in a larva's trajectory represent decision points for selecting new directions of forward movement. The larva uses the same strategies to move up temperature gradients during positive thermotaxis and to move down temperature gradients during negative thermotaxis. Disrupting positive thermotaxis by inactivating cold-sensitive neurons in the larva's terminal organ weakens all regulation of turning decisions, suggesting that information from one set of temperature sensors is used to regulate all aspects of turning decisions. The Drosophila melanogaster larva performs thermotaxis by biasing stochastic turning decisions on the basis of temporal variations in thermosensory input, thereby augmenting the likelihood of heading toward favorable temperatures at all times.
Introduction
Animals achieve behavioral goals by breaking down complex tasks into a sequence of steps and resolving each step by the systematic application of behavioral strategies. In the case of navigational behavior, the task is to translocate to preferred surroundings. As animals explore their environments, navigational strategies are used at sequential points along their trajectories. Navigational strategies allow the animal to assess its own position relative to preferred locations and to calculate movement decisions in a way that carries the animal toward its navigational goals.
Here, we study thermotactic navigation in Drosophila melanogaster larva. Flies, like all animals, show strong behavioral preferences for environmental temperatures favorable to survival and reproduction. When exposed to a range of temperatures, the larva crawls down temperature gradients away from excessive warmth (negative thermotaxis) or up temperature gradients away from excessive cold (positive thermotaxis) to occupy an intervening preferred temperature range (Liu et al., 2003; Rosenzweig et al., 2005, 2008; Kwon et al., 2008). Despite progress toward identifying molecules and neurons involved in larval thermosensation, the strategies that constitute thermotactic behavior and how temperature sensors contribute to these strategies have not been examined. Prior assays of thermotaxis in Drosophila melanogaster quantify the aggregation of animals near preferred temperatures (Sayeed and Benzer, 1996). However, it is the navigational strategy that the animal uses as it moves toward preferred temperatures that is implemented by underlying thermosensory circuits. Aggregation only indicates that some strategy was used.
To uncover the larva's strategies for thermotaxis, we built a tracking microscope that automatically follows individual animals as they explore temperature gradients. Our tracking microscope captures high-resolution images of individual larvae and allows quantification of head and body postures during locomotion that was not possible using previous lower-resolution tracking methods where larvae appear as single points (Clark et al., 2007; Louis et al., 2008). Our results show, with high resolution and mechanistic detail, how navigational behavior emerges from a small set of rules that regulate stochastic patterns in locomotion on the basis of sensory inputs.
Materials and Methods
Fly strains.
White;Canton S was the control strain. Larvae for behavioral assays were raised on molasses plates at room temperature (20–23°C). Individual first instar larvae were removed from the molasses plates and rinsed in distilled water before being placed in the tracking microscope. To inactivate cold-sensitive neurons in the larval terminal organ [thermosensory neurons previously identified by Liu et al. (2003)], we used GH86-Gal4 and UAS-TNTE strains to drive expression of tetanus toxin in GH86-Gal4-expressing cells. In first and second instar larvae, GH86-Gal4 expression is restricted to a subset of terminal organ and dorsal organ neurons, several pharyngeal chemosensory neurons, a single peripheral neuron in each body segment and the oenocytes, non-neuronal cells involved in lipid metabolism (Heimbeck et al., 1999; Gutierrez et al., 2007).
Tracking.
Our tracking microscope is similar to one used for Caenorhabditis elegans (Stephens et al., 2008). Individual first instar larvae were placed on agar surfaces (1% agarose in distilled water) in the center of 9 cm plates, and obliquely illuminated using a ring of superbright infrared light-emitting diodes (880 nm wavelength; Superbright LEDs). Except for the infrared illumination, experiments were conducted in complete darkness. Each larva was continuously tracked until it neared the edge of the plate. Images were captured using a USB Monochrome CCD Camera (Imaging Source), which was mounted to a two-axis linear motion rail system (K2 Devices). The x–y position of the camera was controlled by driving each axis of the rail system with custom code written in LabVIEW, NEMA 23 stepper motors, and drivers (National Instruments). Image acquisition at 2.5 Hz was done using NI-IMAQ (National Instruments). In each video frame, the difference between the center of mass of the larva's body and the center of the field of view was measured. This difference was used as an error signal driving the stepper motors to keep the larva in the center of the field of view of the camera. Records of the camera trajectory as it followed each larva, as well as all video images, were continuously streamed to disk throughout each experiment.
Spatial and temporal temperature gradients.
Linear thermal gradients were established on agar surfaces (1% agarose in distilled water) by placing 9 cm Petri dishes in the middle of a rectangular aluminum plate, the ends of which were fixed at different temperatures to within 0.1°C under thermoelectric control (Oven Industries). Gradual temporal thermal ramps were produced by controlling the temperature of a brass plate under thermoelectric control interfaced to LabVIEW (National Instruments). For these experiments, spatial temperature variation across the agar surface was negligible, verified using a T-type thermocouple embedded in the agar surface. The body temperature of a larva that is placed on these agar surfaces rapidly equilibrates to the surface temperature: a first instar larva is ∼0.1 mm thick, the thermal diffusivity of water is ∼0.1 mm2 · s−1, so the time scale of equilibration is ∼0.1 s.
Infrared laser spotlight to modulate positive thermotaxis.
An infrared laser diode (230 mW 1480 nm; FITEL) was mounted on the tracking microscope, projecting a spotlight ∼2 cm in diameter centered on the moving larva. In these experiments, the agar surface was maintained at the uniform temperature of 17°C, and the larva was allowed to move freely. We chose 17°C so that the larva's temperature throughout the experiment would stay within the range of positive thermotaxis (17°C was close to the starting temperatures for observations of robust positive thermotaxis on spatial temperature gradients) (see Fig. 1A).
Figure 1.

Thermotactic trajectories of Drosophila larvae. A, Representative trajectories of wild-type first instar larvae navigating linear spatial thermal gradients (0.5°C/cm) on the surface of 9 cm diameter agar plates. Agar surface temperatures were as indicated. Larvae were released individually in the middle of each gradient (gray circle) and removed when each neared the plate boundary. The tracks of 20 larvae are superposed in each figure. Start temperatures were 17.5°C (left), 27.5°C (middle), and 40°C (right), respectively. B, Thermotaxis indices of wild-type larvae navigating linear thermal gradients (0.5°C/cm) after starting at different temperatures, calculated using the total time that each larva spent navigating the warmer half (twarm) and colder half (tcold) of each gradient in experiments as shown in Figure 1A. The thermotactic index was computed for each animal using (twarm − tcold)/(twarm + tcold). Positive indices indicate a preference for warm temperatures, negative indices indicate a preference for cold temperatures, and zero indicates no temperature preference. Each thermotactic index reflects the mean ± 1 SE (n > 20 larvae for each measurement).
Image acquisition and analysis software written in LabVIEW detected the initiation of head sweeps during spontaneous turning events, which automatically triggered changes in laser power. In one set of experiments, the laser was only turned on during certain head sweeps, which would warm the larva during the head sweep by ∼0.4°C/s saturating at an elevation of ∼1.5°C in ∼10 s. In another set of experiments, the laser was only turned off during certain head sweeps, which would cool the larva during the head sweep by ∼0.4°C/s saturating at a decrease of ∼1.5°C in ∼10 s. These changes in agar surface temperature caused by changes in laser power were verified using a T-type thermocouple embedded in the agar surface.
Data analysis.
The trajectories and video records from individual larvae were analyzed after each experiment using software written in MATLAB (MathWorks). The posture of the larva in each video frame was analytically reduced to its centerline coordinates from nose to tail. Using the centerline coordinates, we computed the orientation of the tangents to the centerline near the head and in the body. During runs, the head and body were roughly aligned as peristaltic rhythms drove forward movement. During turning events, forward movement would cease and the head would swing one or more times, changing its orientation with respect to the body segment until the start of the subsequent run. On the basis of these stereotyped changes in body posture, we decomposed the trajectory of each larva into an alternating sequence of runs and turning events. Each run was flagged as continuous parts of each trajectory in which the tangents to the head and body were aligned to within 45° for at least 4 s. The head swings that comprised the turning events between successive runs were also analyzed in terms of the number of head swings, direction of each head swing, and angular size of each head swing before the larva started its next run. The 45° threshold was chosen to be significantly above measurement noise in the calculation of head and body tangent angles (to avoid false-positive identification of a turning event) and significantly below the mean size of head swings (to avoid missing turning events). We confirmed the performance of the analysis algorithm with several randomly selected trajectories by validating automatically flagged run and turning events by hand.
Simulations.
Numerical simulations of larval behavior using the different aspects of larval thermotactic strategy were performed using Monte Carlo algorithms in MATLAB (MathWorks) using the probability distributions of run and turning behavior exhibited by wild-type larva.
Results
Tracking thermotaxis
We examined thermotaxis by placing individual first instar larvae (wild-type Drosophila melanogaster, white; Canton-S) at different start temperatures on agar plates with 0.5°C/cm linear spatial temperature gradients. We tracked the movements of each larva until it reached the plate boundary (Fig. 1A,B). When started at temperatures below ∼25°C, most larvae migrated toward warmer temperatures (positive thermotaxis). When started at temperatures above ∼30°C, most migrated toward cooler temperatures (negative thermotaxis) (Fig. 1A,B). Consistent with prior reports, first instar larvae prefer temperatures between 25 and 30°C (Liu et al., 2003; Rosenzweig et al., 2005).
Studies of chemotaxis and thermotaxis in motile bacteria and C. elegans demonstrate that these organisms navigate up or down stimulus gradients to reach preferred environments via a biased random walk (Berg and Brown, 1972; Pierce-Shimomura et al., 1999; Ryu and Samuel, 2002). Both bacterial and nematode locomotion is characterized by periods of forward movement (runs) that are stochastically interrupted by abrupt turning events. Motile bacteria and C. elegans bias the distance covered per run by raising or lowering the rate of abrupt turning events as they sense whether local conditions improve or deteriorate during each run. This strategy carries these organisms toward preferred environments via trajectories that resemble biased diffusion.
The trajectory of the larva can also be characterized as an alternating sequence of runs and turning events (Fig. 2A). During runs, the larva's body is extended, the head is aligned with the body centerline, and forward movement is driven by a peristaltic rhythm (Berrigan and Pepin, 1995). During each turning event, the larva pauses in its forward movement and bends its body, sweeping its head one or more times away from the body centerline (Fig. 2A, inset; supplemental Movie 1, available at www.jneurosci.org as supplemental material). The turning event ends with the head pointing in a new direction that defines the direction of the next run. We sought thermotactic strategy by analyzing the statistics of runs and turning events obtained from the trajectories and video records of large numbers of individual larvae.
Figure 2.
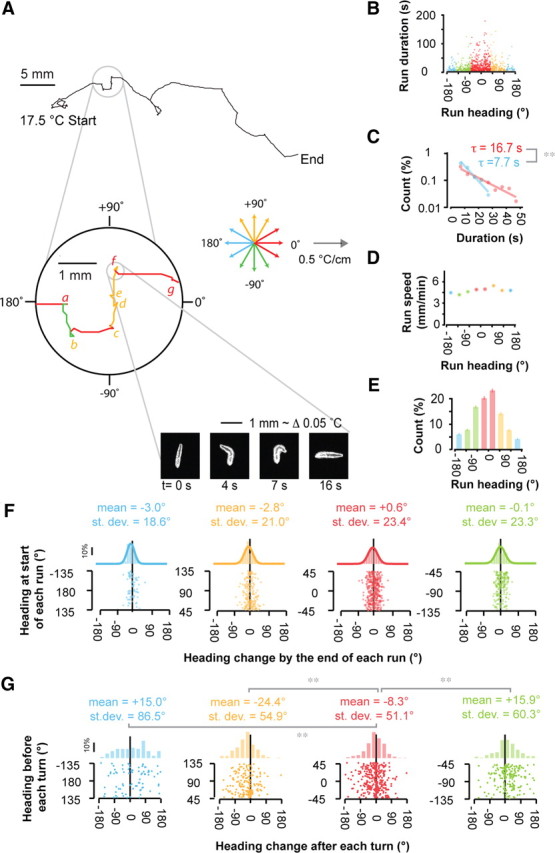
Statistics of runs and turning events during positive thermotaxis. A, Representative trajectory of a wild-type larva crawling up a linear thermal gradient (0.5°C/cm steepness, 17.5°C start temperature) depicting the characteristic sequence of straight runs interrupted by turning events. The zoomed inset shows a portion of the trajectory, highlighting a series of distinct runs and seven turning events (indicated by letters a–g). For presentation purposes, we use a quadrant color code to distinguish runs with different headings relative to 0°, the direction of the temperature gradient. Red, Runs pointed toward warmer temperatures with headings between −45° and +45°. Orange, Transverse runs with headings between +45° and +135°. Green, Transverse runs with headings between −45° and −135°. Blue, Runs pointed toward colder temperatures with headings >135° or <−135°. No runs in the zoomed inset happen to be toward colder temperatures. For the representative turning event indicated by the letter f, a series of video frames reveal the details of the larva's head sweeps: the first head sweep is to the larva's left, the second head sweep is to the larva's right, and the new run is initiated with a heading change of −83.0° with respect to the previous run. B–G, Statistics of runs and turning events exhibited by wild-type larvae performing positive thermotaxis when navigating linear spatial thermal gradients (0.5°C/cm; 17.5°C start temperature). Statistics represent the trajectories of 21 animals, separated into 785 discrete runs, with a turning event at the start and end of each run. All data points are colored on the basis of run direction using the quadrant color code described in A. B, Scatter plot showing the temporal duration of each run with respect to the mean heading of each run. C, Distribution of the durations of all runs pointed up the gradient (red) and down the gradient (blue) using the measurements shown in B. Solid lines and time constants correspond to exponential fits to each distribution. **The time constants of the exponential fits are significantly different at p < 0.005 using the two-sample Kolmogorov Smirnov test. D, Crawling speed during runs as a function of run heading. Each data point represents mean ± 1 SE. E, Distribution of the number of runs that were exhibited at different headings taken from all trajectories. Error bars represent 1 SE. F, Scatter plots and histograms of heading changes between the start and end of each run as a function of the initial heading of the run. The heading change by the end of each run is calculated using the compass shown in A: negative and positive values correspond to rightward and leftward heading changes, respectively, from the larva's point of view. Scatter plots (bottom) depict all measured heading changes during each run, separated into quadrants depending on the initial heading of each run. Histograms of these measurements (top), show the probability distributions of heading changes, and each solid line is a fit to the normal distribution. The mean and the SD in each heading change distribution, shown above each histogram, are indistinguishable from one another at p > 0.05, using Student's t test to compare means and the F test to compare variances. G, Statistics of heading changes generated by each turning event as a function of the run heading immediately before the turning event. Negative and positive heading changes correspond to rightward and leftward turns, respectively, from the larva's point of view. Scatter plots (bottom) depict all measured turning events, separated into quadrants depending on the run heading immediately before each turning event. Histograms of these measurements (top) show the probability distributions of heading changes. The mean and SD for each heading change distribution is shown above each histogram. **Cases in which the mean or the SD in the heading change distribution for each quadrant differed from those values for the quadrant in which larvae crawled up the temperature gradient (red data points) at p < 0.005 using Student's t test to compare means and F test to compare variances.
Larvae bias run durations toward warmer temperatures during positive thermotaxis
First, we examined positive thermotaxis, movement toward warmer temperatures from <20°C. We found that the wild-type larva biases run duration on spatial temperature gradients during positive thermotaxis: runs trend longer when the larva heads toward warmer temperatures than toward colder temperatures (Fig. 2B). The distribution of run durations was exponential and the statistics Poisson; that is, during a given run, the probability per unit time of initiating a turning event was constant (Fig. 2C) (Berg, 1993). Run speed did not vary substantially with run orientation (Fig. 2D). Together, these data show that the larva regulates the rate of turning events to bias the length of each run toward preferred environments, like in the biased random walks of motile bacteria and C. elegans.
We also found that runs were relatively straight, with a root mean square heading change of only ∼20° between the start and end of each run. Regardless of the larva's heading at the start of each run, the heading change that occurred by the end of each run was, on average, indistinguishable from zero (Fig. 2F). Thus, the larva does not gradually steer during each run to improve alignment toward warmer temperatures during positive thermotaxis.
Turning events after each run represent decision points for reorientation
In the biased random walks of motile bacteria and C. elegans, the changes in direction between runs are random and do not depend on the direction of the stimulus gradient (Berg and Brown, 1972; Pierce-Shimomura et al., 1999; Ryu and Samuel, 2002). In other words, turning events are only used to regulate run length, and, in principle, random reorientation would produce equal numbers of runs in different directions. During positive thermotaxis on spatial temperature gradients, the larva exhibited many more runs toward warmer temperatures than other directions (Fig. 2E). Since the larva does not gradually steer during runs (Fig. 2F), the larva must use turning events to correct its orientation in spatial gradients. Turning events exhibited by the larva during positive thermotaxis are apparently a series of decision points, each decision point representing an opportunity for the larva to align itself toward preferred temperatures.
We examined the statistics of reorientation caused by turning decisions during positive thermotaxis, and found that the outcome of each turning decision—the difference in the larva's orientation immediately after and before each turning event—was stochastic but biased (Fig. 2G). When the larva was oriented transverse to the temperature gradient before a turning decision, the angular outcome of the turning decision was biased so that the larva's subsequent orientation tended to be toward warmer temperatures. In other words, when preferred temperatures are to the larva's right or left during a transverse run, the larva tends to orient the next run toward the right or left, respectively.
The angular size of reorientation produced by each turning decision also depends on initial orientation. When the larva was initially moving toward warmer temperatures, the heading changes produced by each turning decision were narrowly distributed in angular size. When the larva was initially moving toward colder temperatures, the heading changes were broadly distributed in angular size (Fig. 2G). In terms of behavioral strategy, the larva tends to maintain its heading after turning decisions when it already happened to be moving in the correct direction, and tends to randomize its orientation when it happened to be moving in the wrong direction.
In summary, the turning events that terminate each run during positive thermotaxis represent decision points with probabilistic outcomes. The larva lengthens or shortens runs pointed toward higher or lower temperatures, respectively, by modulating the rate at which turning decisions are initiated. The larva biases the direction of turning decisions to increase the probability of orienting new runs toward warm temperatures. The larva modulates the width of the distribution of heading changes after turning decisions to maintain headings when it happens to be pointed toward warmer temperatures and randomize headings when it happens to be pointed toward colder temperatures.
Thermosensory information generates biases in turning decisions
In the first instar larva, positive thermotaxis behavior depends on cold-sensitive neurons in the terminal organ (Liu et al., 2003). As previously reported (Liu et al., 2003; Rosenzweig et al., 2008), we found that positive thermotaxis was disrupted when terminal organ cold sensors were functionally inhibited by the expression of tetanus toxin light chain (TNTE) in these neurons under the control of GH86-GAL4 (Fig. 3A–C), but that locomotion was superficially normal (supplemental Movie 2, available at www.jneurosci.org as supplemental material). By quantifying the movements of GH86>TNTE mutant animals at temperatures below 20°C, we found that they were unable to modulate either the rate or the direction of turning decisions on spatial temperature gradients (Fig. 3D–L). We did find that the distribution of heading changes after runs in which GH86>TNTE mutant animals were headed down the gradient was wider than the distribution of heading changes after runs headed up the gradient, but this 15% increase in the width of the distribution of turning angles is smaller than the 70% increase exhibited by wild-type animals. The small dependence of turn size on trajectory direction may point to either incomplete inactivation of the terminal organs by GH86>TNTE or a partial contribution by thermosensory neurons that remain to be identified. In any case, our results suggest that downstream neural circuits that regulate multiple aspects of the turning decisions—i.e., circuits that initiate turning decisions or that regulate the outcome of turning decisions—use information from one set of sensory neurons.
Figure 3.
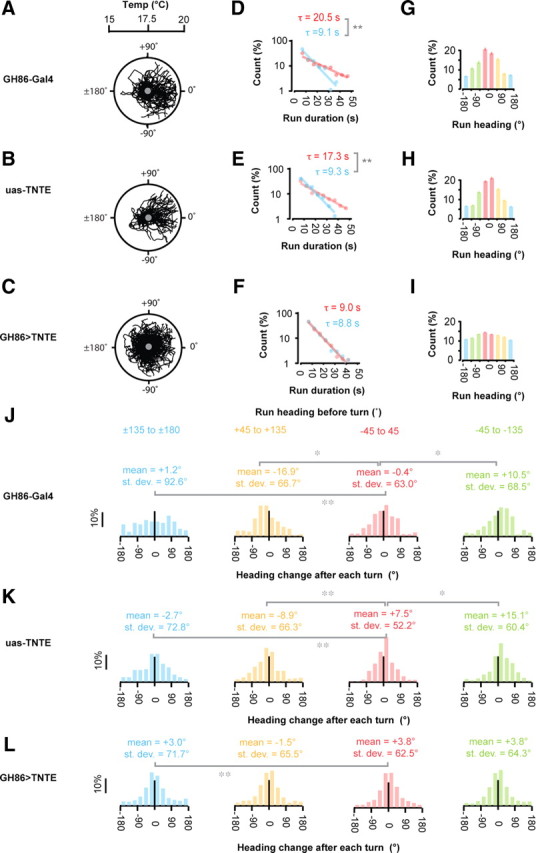
Genetic disruption of the cold-sensitive neurons in the terminal organ. A–C, Representative trajectories of first instar larvae navigating linear spatial thermal gradients (0.5°C/cm; 17.5°C start temperatures) on the surface of 9 cm diameter agar plates. A, GH86-Gal4 larvae (n = 46) crawl up the temperature gradient with thermotactic index of 0.8 ± 0.1. B, UAS-TNT-E larvae (n = 50) crawl up the temperature gradients with thermotactic index of 0.7 ± 0.1. C, GH86-Gal4/Y or +; +/UAS-TNT-E larvae (n = 111) have significantly diminished preference for warmer temperatures with thermotactic index of 0.3 ± 0.1 (p < 0.005 difference from either GH86-Gal4 larvae or UAS-TNT-E larvae using Student's t test). D–L, The statistics of run and turning behavior taken from all the trajectories exhibited by individual mutant larvae as shown in Figure 2 for wild-type larvae: GH86-Gal4 (n = 46 animals separated into 705 discrete runs) (D, G, J); UAS-TNT-E (n = 50 animals separated into 1230 discrete runs) (E, H, K); or GH86>TNT-E (n = 111 animals separated into 3525 discrete runs) (F, I, L). For presentation purposes, we use the quadrant color code shown in Figure 2A to distinguish runs with different headings with respect to 0°, the direction of the temperature gradient: red corresponds to runs pointed toward warmer temperatures with headings between −45° and +45°; orange corresponds to transverse runs with headings between +45° and +135°; green corresponds to transverse runs with headings between −45° and −135°; blue corresponds to runs pointed toward colder temperatures with headings >135° or <−135°. D–F, Distribution of the durations of all runs pointed up and down each temperature gradient for each strain. Solid lines and time constants correspond to exponential fits for runs pointed toward warmer or colder temperatures, and ** in each figure indicates cases in which the two time constants differ at p < 0.005 using the two-sample Kolmogorov–Smirnov test. G–I, Distribution of the numbers of runs with different run headings taken from the all trajectories exhibited by each strain. J–L, Histograms of heading changes after each turning event taken from all trajectories for each mutant strain. Data are separated into quadrants depending on run heading before each turning event. Asterisks indicate cases in which the mean or the SD in the heading change distribution for each quadrant differed from those values for the quadrant in which larvae crawled up the temperature gradient (*p < 0.05; **p < 0.005 using Student's t test to compare means and the F test to compare variances).
Larvae bias the probability of commitment to new runs depending on the direction of each head sweep
During each turning event after each run, a larva bends its body, sweeping its head away from the body centerline one or more times. The final orientation of the head at the end of the turning event corresponds to the direction of the subsequent run (Fig. 2A, inset). We sought the mechanistic basis of turning decisions during positive thermotaxis by investigating how the execution of head sweeping movements correlates with the angular reorientation that they produce.
First, we examined how the larva biases the probability of turning toward warmer temperatures when it is initially transverse to the temperature gradient. We found that the number of head sweeps that constitute each turning event is exponentially distributed, with a mean of ∼1.5 head sweeps per turning event for wild-type larvae (Fig. 4A). An exponential distribution is consistent with a model in which the larva, during each head sweep, has a certain probability of terminating the turning event and committing itself to a new run in the same direction as that head sweep. When the larva is initially transverse to the temperature gradient, we found that the direction of the first head sweep within each turning event is random: each head sweep is as likely to be toward warm temperatures as toward cold temperatures (Fig. 4B). We found that the probability of terminating the turning event during each head sweep is biased depending on its direction: when the larva happens to sweep its head toward warmer temperatures, it is more likely to terminate the turning event during that head sweep, thereby starting the new run in the direction of warmer temperatures (Fig. 4C); when the larva happens to sweep its head toward colder temperatures, it is less likely to terminate the turning event during that head sweep, thereby more likely to bend its head back to the centerline and initiate a new head sweep (Fig. 4C). Together, these observations suggest that each head sweep is an exploratory movement with direction chosen at random. The larva biases the selection of new runs by modulating the probability with which it terminates turning events during each head sweep. This probability is higher when a head sweep happens to be toward warmer than toward colder temperatures.
Figure 4.
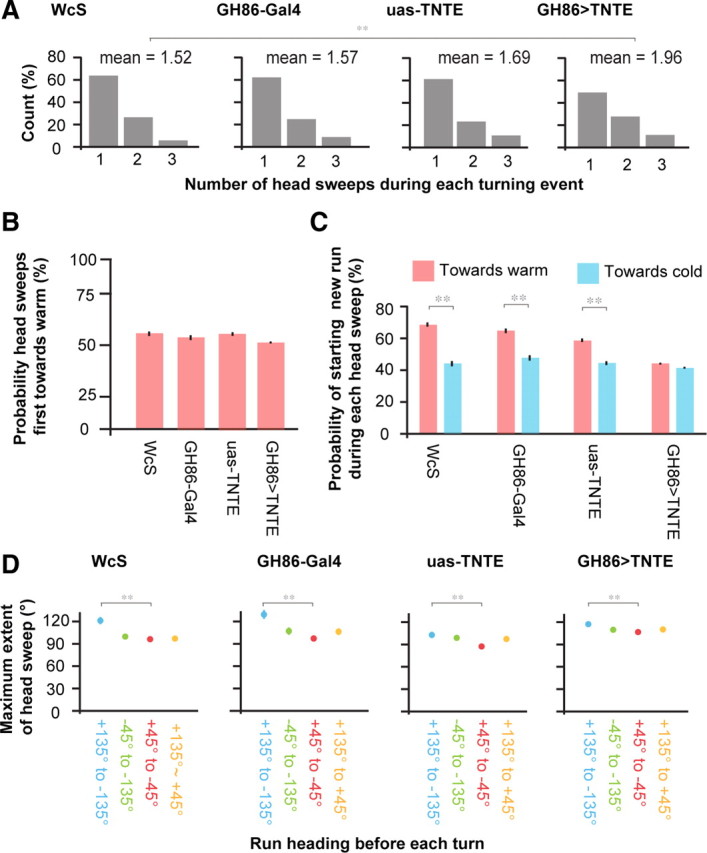
Statistics of head sweeps during turning events. A, The distribution of the number of head sweeps per turning event during positive thermotaxis exhibited by wild-type larvae (n = 21 animals, 785 turning events); GH86-Gal4 larvae (n = 46 animals, 705 turning events); UAS-TNT-E larvae (n = 50 animals, 1230 turning events); and GH86>TNT-E larvae (n = 111 animals, 3525 turning events). B, The probability that the first head sweep in each turning event is toward warmer temperatures following runs transverse to the temperature gradient. In every case, the probability was statistically indistinguishable from 50% (p > 0.05 using a one-sample Z test). C, The probability that the larva ends a turning event and starts a new run during head sweeps toward warmer temperatures (red bars) or during head sweeps toward colder temperatures (blue bars) for turning events following runs transverse to the temperature direction. **Cases in which these two probabilities for wild-type or mutant larvae differ at p < 0.005 using a two-sample Z test. D, The maximum extent of head sweeps during each turning event (i.e., the largest absolute value of the angle between head and body) of mutant and wild-type larvae depending on the initial heading of the larvae with respect to the temperature gradient before each turning event separated into quadrants. For each strain, ** indicates cases in which the maximum extent of head sweeps for each quadrant differed from the value for the quadrant in which larvae crawled up the temperature gradient at p < 0.005 using Student's t test.
When terminal organ cold sensors were functionally inhibited (GH86>TNTE), larvae initially headed transverse to the gradient exhibited a significantly higher mean number of head sweeps per turn than controls (Fig. 4A). This effect was mediated through a decrease in commitment to favorably oriented runs, not an increase in commitment to unfavorably oriented runs (Fig. 4C). Larval cold sensors, rather than acting to decrease the probability of ending turning events during head sweeps toward cooler temperatures, act to increase the probability of ending turning events during head sweeps that happen to be toward warmer temperatures.
The size of head sweeps during a turning event depends on the preceding run's direction
During positive thermotaxis, when the larva is initially moving toward warmer (colder) temperatures before a turning event, the angles of reorientation after the turning event are narrowly (broadly) distributed (Fig. 2G). We quantified the maximum angle of head sweeps exhibited by wild-type larvae during turning events after runs pointed in different directions on spatial temperature gradients at temperatures below 20°C, and found that the maximum size of head sweeps is augmented after runs pointed toward colder temperatures (Fig. 4D). Thus, because the head sweeps span larger angles after runs pointed toward colder temperatures, possibilities for reorientation angles are drawn from broader distributions. Larvae whose terminal organ cold sensors were functionally inhibited (GH86>TNTE) also increase the angular size of head sweeps during turning events depending on the direction of preceding runs (Fig. 4D), although less so than wild-type larvae, consistent with our observation that GH86>TNT-E larvae exhibit a slightly broader distribution of heading changes after runs pointed toward colder temperatures (Fig. 3L).
Both positive and negative thermotaxis use the same elements of behavioral strategy
Having established the patterns of behavioral strategy used during positive thermotaxis, we examined negative thermotaxis by following the movements of wild-type larvae at temperatures above 35°C. During negative thermotaxis, the larva also biases run duration, but with runs trending longer when the larva heads toward colder temperatures than toward warmer temperatures (Fig. 5B). As previously observed with positive thermotaxis, the distribution of run durations was exponential (Fig. 5C), run speed did not vary with run orientation (Fig. 5D), and runs were relatively straight (Fig. 5F).
Figure 5.
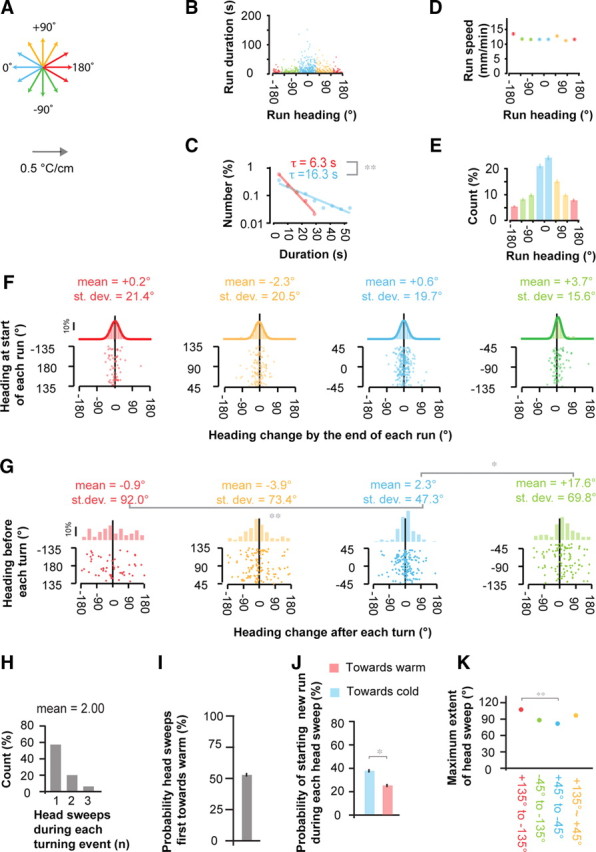
Statistics of runs, turns, and head sweeps during negative thermotaxis. A, For presentation purposes, we use a quadrant color code to distinguish runs with different headings with respect to 0°: blue corresponds to runs pointed toward colder temperatures with headings between −45° and +45°; orange corresponds to transverse runs with headings between +45° and +135°; green corresponds to transverse runs with headings between −45° and −135°; red corresponds to runs pointed toward warmer temperatures with headings >135° or <−135°. B–K, Statistics of runs, turns, and head sweeps exhibited by wild-type larvae performing negative thermotaxis when navigating linear spatial thermal gradients (0.5°C/cm; 40°C start temperature). Statistics represent the trajectories of 57 animals, separated into 492 discrete runs, with a turning event at the start and end of each run. All data points are colored on the basis of run direction using the quadrant color code of Figure 5A. B, Scatter plot showing the temporal duration of each run with respect to the mean heading of each run. C, Distribution of the durations of all runs pointed up the gradient (red) and down the gradient (blue) using the individual measurements shown in B. Solid lines and time constants correspond to exponential fits to each distribution. **The time constants of the exponential fits are statistically distinguishable at p < 0.005 using the two-sample Kolmogorov Smirnov test. D, Crawling speed during runs as a function of run heading. Each data point represents mean ± 1 SE. E, Distribution of the number of runs that were exhibited at different headings taken from all trajectories. Error bars represent 1 SE. F, Scatter plots and histograms of heading changes between the start and end of each run as a function of the initial heading of the run. The heading change by the end of each run is calculated using the compass shown in Figure 5A: negative and positive values correspond to leftward and rightward heading changes, respectively, from the larva's point of view. Scatter plots (bottom) depict all measured heading changes during each run, separated into quadrants depending on the initial heading of each run. Histograms of these measurements (top), show the probability distributions of heading changes, and each solid line is a fit to the normal distribution. The mean and the SD in each heading change distribution, shown above each histogram, are indistinguishable from one another at p > 0.05 using Student's t test to compare means and F test to compare variances. G, Statistics of heading changes generated by each turning event as a function of the run heading immediately before the turning event. Negative and positive heading changes correspond to leftward and rightward turns, respectively, from the larva's point of view. Scatter plots (bottom) depict all measured turning events, separated into quadrants depending on the run heading immediately before each turning event. Histograms of these measurements (top) show the probability distributions of heading changes. The mean and SD for each heading change distribution is shown above each histogram. Asterisks indicate cases in which the mean or the SD in the heading change distribution for each quadrant differed from those values for the quadrant in which larvae crawled up the temperature gradient (*p < 0.05, **p < 0.005 using Student's t test to compare means and F test to compare variances). H, The distribution of the number of head sweeps per turning event during negative thermotaxis. I, The probability that the first head sweep in each turning event is toward warmer temperatures following runs transverse to the temperature gradient. The probability was statistically indistinguishable from 50% at p > 0.05 using the one-sample Z test. J, The probability that the larva ends a turning event and starts a new run during head sweeps toward warmer temperatures (red bars) or during head sweeps toward colder temperatures (blue bars) for turning events after runs transverse to the temperature direction. **Cases in which these two probabilities differ at p < 0.005 using the two-sample Z test. K, The maximum extent of head sweeps during each turning event (i.e., the largest absolute value of the angle between head and body) depending on the initial heading of the. **Cases in which the maximum extent of head sweeps for each quadrant differed from the value for the quadrant in which larvae crawled up the temperature gradient at p < 0.005 using Student's t test.
The statistics of reorientation caused by turning decisions during negative thermotaxis resembled those that characterize positive thermotaxis. Many more runs were exhibited toward colder temperatures than toward warmer temperatures (Fig. 5E). When the larva was initially moving toward colder temperatures, the heading changes produced by each turning decision were narrowly distributed in angular size. When the larva was initially moving toward warmer temperatures, the heading changes were broadly distributed in angular size (Fig. 5G). When the larva was initially oriented transverse to the temperature gradient, the angular outcome of the turning decision was shifted toward colder temperatures, significantly so with transverse trajectories in which colder temperatures were to the larva's right, but not significantly so with transverse trajectories in which colder temperatures were to the larva's right (Fig. 5G). The origin or significance of this asymmetry in turning performance is unclear and deserves closer examination, as it only lowers the net speed of thermotactic migration and was not observed during positive thermotaxis.
The mechanism by which the larva biases the angular direction of turning decisions during negative thermotaxis (here, we examined transverse trajectories when colder temperatures were to the larva's right) arises from the statistics of head sweep movements in the same manner as during positive thermotaxis. The number of head sweeps that constitute each turning event is exponentially distributed (Fig. 5H). The initial head sweep is as likely to be toward colder temperatures as toward warmer temperatures (Fig. 5I). The probability of starting a new run during each head sweep is higher if it happens to be toward colder temperatures than toward warmer temperatures (Fig. 5J). As in the case of positive thermotaxis, each head sweep during negative thermotaxis represents an exploratory movement with direction chosen at random, and the larva biases the direction of new runs by modulating the probability with which it terminates turning events during each head sweep. During negative thermotaxis, this probability is higher when it encounters colder temperatures during each head sweep.
Larvae respond to temporal changes in temperature during runs
The self-movement of the larva along a spatial temperature gradient generates temporal changes in thermosensory input, raising the question whether the larva directly measures the spatial gradient, the temporal gradient, or a combination. To dissociate temporal and spatial stimuli, we subjected the freely moving larva to temporal gradients applied in a spatially uniform manner. First, we subjected the larva to slow warming and cooling ramps (1°C/min) between 16°C and 17°C to evoke positive thermotaxis behavior (Fig. 6A). We found that runs exhibited by the wild-type larva on these temporal gradients were significantly longer during the warming phases than during the cooling phases (Fig. 6B). Also, heading changes after each turning event during warming ramps were drawn from a narrower distribution of angular sizes than during cooling ramps (Fig. 6C). Thus, the larva regulates the rate and angular size of turning events in response to temporal warming or cooling in the same way as they regulate these parameters after runs up or down spatial temperature gradients.
Figure 6.
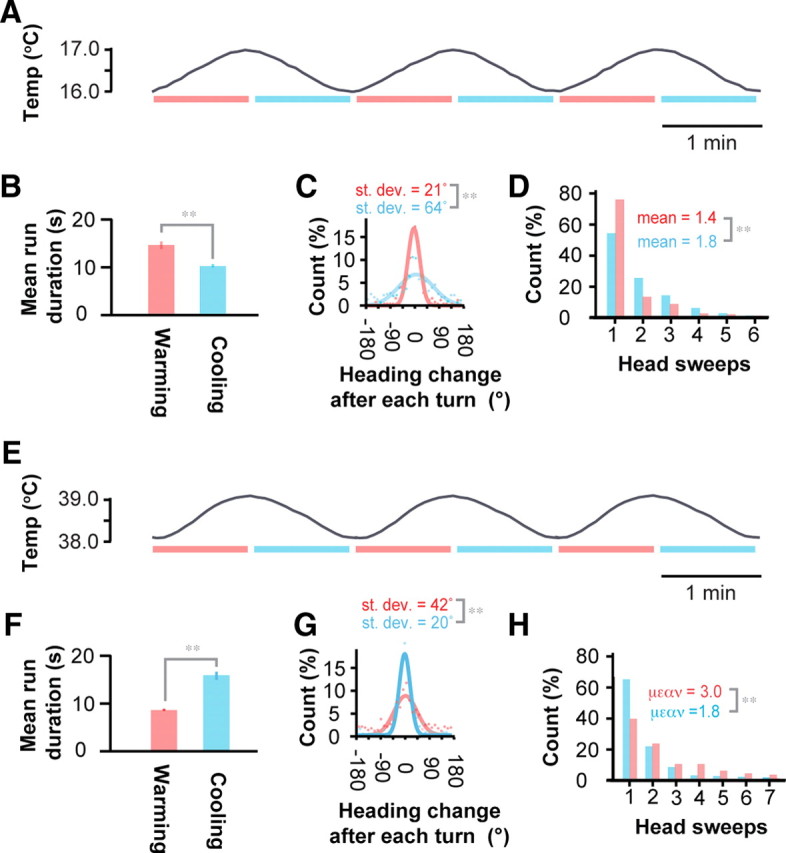
Temporal gradients evoke thermotactic behavior. A–D, Individual larvae were placed on agar plates and subjected to spatially uniform temporal gradients of temperature, delivered in the temperature cycles between 16 and 17°C with 1°C/min ramp speed and 2 min period as shown in A. Statistics represent measurements taken from n = 42 larvae exhibiting a total of 562 runs. B, The mean durations of all runs exhibited during the warming and cooling phases. **The mean durations differed at p < 0.005 using Student's t test. C, The histogram of heading changes effected by each turn during the warming phase (red dots) and during the cooling phase (blue dots). Lines show fits to normal distributions, and each SD corresponds to the width of each normal distribution. **The two SDs differ at p < 0.005 using the F test. D, Distribution of the number of head sweeps that larvae use to effect each turn during the warming phases (red bars) and cooling phases (blue bars) of the temperature ramps. **The mean number of head sweeps per turning event during the warming and cooling phases differ at p < 0.005 using Student's t test. E–H, Individual larvae were placed on agar plates and subjected to spatially uniform temporal gradients of temperature, delivered in the temperature cycles between 38 and 39°C with 1°C/min ramp speed and 2 min period as shown in E. Statistics represent measurements taken from n = 128 larvae exhibiting a total of 1099 runs. F, The mean durations of all runs exhibited during the warming and cooling phases. **The mean durations differed at p < 0.005 using Student's t test. G, The histogram of heading changes effected by each turn during the warming phase (red) and during the cooling phase (blue). Lines show fits to normal distributions, and each SD corresponds to the width of each normal distribution. **The two SDs differ at p < 0.005 using the F test. H, Distribution of the number of head sweeps that larvae use to effect each turn during the warming phases (red bars) and cooling phases (blue bars) of the temperature ramps. **The mean number of head sweeps per turning event during the warming and cooling phases differ at p < 0.005 using Student's t test.
On temporal gradients between 16 and 17°C, the number of head sweeps within each turning event during both warming and cooling ramps was exponentially distributed, but the average number of head sweeps was significantly greater during the cooling ramp (Fig. 6D). In each turning decision during positive thermotaxis on spatial gradients, the larva is more likely to start a new run when it sweeps its head toward warmer temperatures (Fig. 4C). During a slow warming ramp applied in a spatially uniform manner, the head moves toward warmer temperatures with every head sweep in every turning decision. During slow cooling ramps, the head moves toward colder temperatures with every head sweep. Thus, the larva should be more likely to start a new run during each head sweep during warming ramps than during cooling ramps, consistent with our observation that more head sweeps constitute turning events during cooling ramps than during warming ramps.
We also subjected the larva to slow warming and cooling ramps (1°C/min) between 38°C and 39°C to evoke negative thermotaxis (Fig. 6E), and obtained analogous results. In this case, runs exhibited by the wild-type larva were significantly longer during the cooling phases than during the warming phases (Fig. 6F). Heading changes after each turning event during warming ramps were drawn from a narrower distribution of angular sizes than during cooling ramps (Fig. 6G). The number of head sweeps within each turning event during both warming and cooling ramps was exponentially distributed, but the average number of head sweeps was significantly greater during the warming ramp (Fig. 6H).
Together, these results suggest that the larva, whether exhibiting positive or negative thermotaxis, responds to temporal changes in temperature. For example, if the larva detects that conditions are improving over time during each run (i.e., if temperature rises in the case of positive thermotaxis or falls in the case of negative thermotaxis), the larva lowers the probability per unit time of terminating the run with a turning event. If the larva detects that conditions are worsening during each run (i.e., temperature falls in the case of positive thermotaxis or rises in the case of negative thermotaxis), the larva widens the head sweeps during the turning event that ends the run.
The ability of the larva to bias run durations based on temporal comparisons allows us to estimate their minimum thermal sensitivity based on our measurements of thermotactic behavior on spatial temperature gradients (Fig. 2): 0.1 mm/s crawling on an 0.05°C/mm gradient generates a 0.005°C/s temperature gradient which suffices to drive robust thermotaxis. Caenorhabditis elegans exhibiting thermotaxis responds to temporal gradients as small as 0.005°C/s (Luo et al., 2006). Thus, both the Drosophila melanogaster larva and C. elegans approach the thermal sensitivity of the most sensitive metazoan described, Speophyes lucidulus, a blind cave beetle, which senses temperature gradients as small as 0.001°C/s (Corbière-Tichané and Loftus, 1983).
Larvae respond to temporal changes in temperature during head sweeps
During navigation on spatial temperature gradients, when the larva initially has a transverse orientation with respect to the temperature gradient, the cold-sensitive neurons at the terminal organ will encounter a rapid temporal change in temperature that depends on the direction of the head sweep. To subject the larva to temporal changes in temperature that more closely resemble this thermosensory experience on spatial temperature gradients than slow warming or cooling ramps, we used an infrared laser system to deliver rapid temperature changes to the freely moving larva depending upon their spontaneous initiation of head sweeps, similar to a system that has been used to explore thermotaxis in C. elegans (Stephens et al., 2008). We entrained an infrared laser spotlight on the larva as it was being tracked in our microscope while it navigated a surface without temperature gradients at mean temperatures near 17°C, allowing us to study behavior in the range of positive thermotaxis. Real-time machine-vision software recognized when the larva initiated a turning event and automatically modulated laser intensity during head sweeps.
In the experiment shown in Figure 7A, the laser was kept off during periods of forward movement, and when the larva happened to sweep its head, the laser would either remain off (so the larva would perceive no change in temperature) or would switch on (so the larva would receive spatially uniform warming). We found that the probability of ending the turning event and starting a new run with each head sweep was ∼60% when the laser remained off during the head sweep, but was ∼80% when the laser switched on during the head sweep (Fig. 7B). We also performed the converse experiment in which the laser was kept on during runs, and when the larva happened to sweep its head, the laser would either remain on (so the larva would perceive no change in temperature) or switch off (so the larva would receive spatially uniform cooling by ∼0.4°C/s). In this case, the probability of ending the turning during the head sweep was ∼60% when the laser remained on, but this probability dropped to ∼30% when the laser switched off (Fig. 7B). These results are consistent with our observations on spatial temperature gradients during positive thermotaxis, where the larva has a higher probability of ending each turning event during head sweeps that happen to be toward warmer temperatures than toward colder temperatures (Fig. 4).
Figure 7.

Heating or cooling during head sweeps regulates turning decisions during positive thermotaxis. A, Video images of an individual wild-type larva navigating an agar surface held at 17°C. The larva is entrained with an infrared laser spotlight that switches on during certain head sweeps. At t = 0 s, the larva is exhibiting a run with the laser off. At t = 9 s, the larva has spontaneously initiated a turning event, in which the first head sweep is to the larva's right and the laser stays off. The larva does not initiate a new run during the first head sweep, and at t = 12 s the larva's head returns to the centerline. At t = 14 s, the larva initiates a second head sweep to its left. During the second head sweep, the laser turns on (indicated by the red background), and the larva initiates a new run. At t = 33 s, the larva is exhibiting its new run in its new orientation after the turning event. B, The probability that larvae start new runs during head sweeps as they navigate agar surfaces held at 17°C with illumination from an infrared laser spotlight that depends on head sweeps. In one set of experiments as depicted in Figure 5E (red bars), the laser was kept off during runs, and was either switched on during a head sweep to warm the larva (filled red bar) or was kept off during a head sweep to maintain constant temperature (open red bar). **The probability of ending the turning event during head sweeps when the larva experienced warming differed from the probability of ending the turning event during head sweeps when the larva experienced no temperature change at p < 0.005 using Student's t test. In another set of experiments (blue bars), the laser was kept on during runs, and was either switched off during a head sweep to cool the larva (filled blue bar) or was kept on during a head sweep to maintain constant temperature (open blue bar). **The probability of ending the turning event during head sweeps when the larva experienced cooling differed from the probability of ending during head sweeps when the larva experienced no temperature change at p < 0.005 using Student's t test.
In summary, temporal changes in temperature regulate all aspects of turning decisions in the same way as the temporal changes in temperature driven by larval self-movement on spatial temperature gradients. If the larva senses that temperature is rising or falling during each run, the larva responds as if it were crawling toward warmer or colder temperatures on a spatial temperature gradient. If the larva senses that temperature is rising or falling during each head sweep, it responds as if the head sweep were toward warmer or colder temperatures on a spatial temperature gradient. Thus, the location of the cold-sensitive neurons at the larva's terminal organ appears to be optimal: head sweeps on spatial temperature gradients will drive the largest temporal changes in temperature at the tip of the head.
Monte Carlo simulations of larval navigation
To confirm that we uncovered the major elements of larval navigational strategy, we checked that Monte Carlo simulations of larval navigation, using the statistics of run and turn behavior acquired from the wild-type larva, yielded thermotactic movement with the same speed as the real larva. Moreover, to quantitatively evaluate how the different ways in which the larva regulates its run and turn behavior contribute to overall migration, we compared the effects of negating one or more aspects of behavioral strategy in the simulations. These simulations confirmed that regulating run duration, turning direction, and turning size all promote thermotaxis (Fig. 8A–D). We found that regulating just one aspect of turning behavior—either the rate, size, or direction of abrupt turns—can generate thermotactic migration up gradients, albeit with slower mean speed than exhibited by normal larvae, whether positive thermotaxis (Fig. 8E) or negative thermotaxis (Fig. 8F). Moreover, negating just one type of regulation can significantly reduce the net speed of thermotactic migration (Fig. 8E,F), a factor that might underlie evolutionary pressures to develop mechanisms for regulating turning behavior beyond the biased random walk.
Figure 8.

Simulations of thermotactic navigation. A–E, Monte Carlo simulations of the trajectories of larvae exhibiting positive thermotaxis using the statistical distributions for run duration, turn size, and turn direction exhibited by real larvae navigating 0.5°C/cm temperature gradients with 17.5°C start temperature. For wild-type larvae, each of these statistical distributions is explicitly dependent on the larva's heading as described in Figure 2. To simulate the effect of negating specific aspects of behavioral strategy, we constructed a set of unbiased statistical distributions for run duration, turn size, and turn direction by pooling all run and turn statistics exhibited by wild-type larvae without separation into quadrants based on run heading. A–C, Simulated trajectories of larvae regulating only one aspect of behavioral strategy. In each case, we allowed the simulated larva's heading to generate the statistics for one aspect of behavioral strategy using the statistical distributions exhibited by real larvae, and used unbiased statistical distributions for the other two aspects of behavioral strategy. In each panel, the trajectories produced by 30 simulations are superposed (purple trajectories), and two randomly selected trajectories are highlighted in blue and red. D, Simulated trajectories of larvae that use all three wild-type distributions for run duration, turn size, and turn direction. E, Thermotactic movement of simulations with zero, one, two, or all three types of modulation of run and turning behavior, quantified as the mean drift velocity of each simulation as it crawls up temperature gradients. As expected, simulations with zero bias exhibit zero drift velocity. For comparison, the experimentally measured drift speed of wild-type larvae exhibiting positive thermotaxis is indicated in red. Each measurement represents the mean ± 1 SE. F, Results of Monte Carlo simulations of the trajectories of larvae exhibiting negative thermotaxis using the statistical distributions for run duration, turn size, and turn direction exhibited by real larvae navigating 0.5°C/cm temperature gradients with 40°C start temperature taken from Figure 5. As in E, thermotactic movement of simulations with zero, one, two, or all three types of modulation of run and turning behavior is quantified as the mean drift velocity of each simulation as it crawls down temperature gradients. For comparison, the experimentally measured drift speed of wild-type larvae exhibiting negative thermotaxis is indicated in red. Each measurement represents the mean ± 1 SE.
Discussion
Systems neuroscience aims to unravel neural circuits that drive animal behaviors from stimulus input to motor output, an aim that has only been fully realized for simple reflexive responses, e.g., gill withdrawal in Aplysia and touch avoidance in C. elegans (Kupfermann and Kandel, 1969; Chalfie et al., 1985). However, more sophisticated behaviors—such as the exploratory navigation of freely moving animals as they seek rewards or avoid punishment—involves more sophisticated usage of neural circuits. Goal-directed behaviors require animals to initiate, calculate, and execute decisions by modulating alternative motor programs in response to external cues in such a way as to carry the animal toward its goals.
Here, we have uncovered the decision-making processes that constitute thermotactic navigational strategy in the Drosophila melanogaster larva. The fidelity of thermotactic navigation is based on the larva's ability to initiate, calculate, and execute a biased turning decision at the end of each run. We have further shown that the parameters that describe each turning decision can be understood in terms of specific sensorimotor relationships, i.e., rules that convert the larva's detection of temporal variations in temperature (driven by larval self-movement in spatial temperature gradients) into regulation of those patterns of self-movement. In brief, larval trajectories may be characterized as an alternating sequence of two modes of self-movement, forward crawling during runs and head sweeping during turning decisions. Larval thermotactic strategy may be explained in terms of regulated transitions between forward crawling behavior and head sweeping behavior based on thermosensory input (Fig. 9). During positive thermotaxis, for example, detection of warming (cooling) during runs causes the larva to lower (raise) the probability per unit time of initiating a turning decision, thus producing longer runs that happen to be toward warmer temperatures. Turning decisions after runs pointed toward colder temperatures have wider head sweeps than those after runs toward warmer temperatures. Detection of warming (cooling) during each head sweep causes the larva to raise (lower) the probability of initiating a new run during that head sweep, thus producing more runs that are pointed toward warmer temperatures.
Figure 9.

Symmetries in strategies for negative and positive thermotaxis. Schematic of transitions between the motor program for forward crawling during runs and the motor program for head sweeping during turns, and the dependence of these transitions on temporal variations in temperature. The dependence of these transitions on temperature yield two elements of navigational strategy during positive thermotaxis or negative thermotaxis, namely modulation of run duration and modulation of turn direction. When the larva detects warming or cooling during either runs or head sweeps, it raises (thickened arrows) or lowers (thinned arrows) the probability per unit time of transitions between the motor programs or the probability per unit time of remaining within a motor program.
The strategies for negative thermotaxis and positive thermotaxis are roughly symmetric (Fig. 9). The salient difference is that warming is favorable and cooling is unfavorable during positive thermotaxis whereas cooling is favorable and warming is unfavorable during negative thermotaxis. Different molecular and cellular thermosensors are used during negative and positive thermotaxis. Negative thermotaxis uses neurons in the larval central brain that express dTRPA1, a heat-activated transient receptor potential family ion channel (Rosenzweig et al., 2005). Positive thermotaxis uses GH86-expressing neurons in the terminal organ (Liu et al., 2003; Rosenzweig et al., 2008). One possibility is that the same downstream circuitry regulates movement decisions for both positive and negative thermotaxis; this core circuitry would be controlled by distinct thermosensors operating over different temperature ranges, thus yielding similar behavioral strategies for negative and positive thermotaxis. While the navigational strategies underlying other types of larval behaviors have not yet been described at the same level of detail, recent studies indicate the fidelity of larval olfactory navigation also exceeds that of a biased random walk (Louis et al., 2008). It would be interesting to know whether the same elements of strategy are used during different navigational behaviors across sensory modalities.
Our ability to closely approximate the behavior of real larvae during thermotaxis with Monte Carlo simulations strongly suggests that we have distilled the key elements of larval thermotactic strategy and indicates that each element plays a role in thermotactic movement. The distillation of the elements of navigational strategy that emerge from this work (simulated in Fig. 8 and depicted in Fig. 9) also provides a functional framework for future analysis of the molecules and cells that contribute to such animal behavior. A long-term goal is now to understand how the sensorimotor rules that constitute navigational strategy emerge from molecular and circuit level properties.
Our work shows how an apparently complex goal-directed behavior, larval thermotaxis, can be built from the integration of basic rules—rules that transform sensory inputs into motor outputs—in a way that gives rise to the initiation, calculation, and execution of navigational decisions. We have shown that the decision-making circuits in larval navigation are intrinsically stochastic. Nevertheless, the larva eventually reaches its behavioral goals by being able to regulate its stochastic movements over time, biasing the selection and continuation of headings that are pointed toward preferred environments (Glimcher, 2005; Gold and Shadlen, 2007). Similarly detailed pictures of behavioral strategy are not yet available for most behaviors. However, the advent of high-resolution, quantitative dissection of complex behaviors in genetically tractable animal models promises to provide keys to the mechanistic dissection of complex behaviors from the individual molecule and cell to circuit function and animal behavior.
Footnotes
This work was supported by a McKnight Scholar Award and National Institutes of Health Pioneer Award to A.D.T.S., and grants from the National Institute of Mental Health (R21 MH080206) and National Institute of Neurological Disorders and Stroke (P01 NS044232) to P.A.G. We thank members of the Garrity and Samuel laboratories for useful discussions.
References
- Berg HC. alks in biology, Expanded Edition. Princeton, NJ: Princeton UP; 1993. [Google Scholar]
- Berg HC, Brown DA. Chemotaxis in Escherichia coli analysed by three-dimensional tracking. Nature. 1972;239:500–504. doi: 10.1038/239500a0. [DOI] [PubMed] [Google Scholar]
- Berrigan D, Pepin DJ. How maggots move: allometry and kinematics of crawling in larval diptera. J Insect Physiol. 1995;41:329–337. [Google Scholar]
- Chalfie M, Sulston JE, White JG, Southgate E, Thomson JN, Brenner S. The neural circuit for touch sensitivity in Caenorhabditis elegans. J Neurosci. 1985;5:956–964. doi: 10.1523/JNEUROSCI.05-04-00956.1985. [DOI] [PMC free article] [PubMed] [Google Scholar]
- Clark DA, Gabel CV, Lee TM, Samuel ADT. Short-term adaptation and temporal processing in the cryophilic response of Caenorhabditis elegans. J Neurophysiol. 2007;97:1903–1910. doi: 10.1152/jn.00892.2006. [DOI] [PubMed] [Google Scholar]
- Corbière-Tichané G, Loftus R. Antennal thermal receptors of the cave beetle, Speophyes lucidulus. J Comp Physiol A. 1983;153:343–351. [Google Scholar]
- Glimcher PW. Indeterminacy in brain and behavior. Annu Rev Psychol. 2005;56:25–56. doi: 10.1146/annurev.psych.55.090902.141429. [DOI] [PubMed] [Google Scholar]
- Gold JI, Shadlen MN. The neural basis of decision making. Annu Rev Neurosci. 2007;30:535–574. doi: 10.1146/annurev.neuro.29.051605.113038. [DOI] [PubMed] [Google Scholar]
- Gutierrez E, Wiggins D, Fielding B, Gould AP. Specialized hepatocyte-like cells regulate Drosophila lipid metabolism. Nature. 2007;445:275–280. doi: 10.1038/nature05382. [DOI] [PubMed] [Google Scholar]
- Heimbeck G, Bugnon V, Gendre N, Häberlin C, Stocker RF. Smell and taste perception in Drosophila melanogaster larva: toxin expression studies in chemosensory neurons. J Neurosci. 1999;19:6599–6609. doi: 10.1523/JNEUROSCI.19-15-06599.1999. [DOI] [PMC free article] [PubMed] [Google Scholar]
- Kupfermann I, Kandel ER. Neuronal controls of a behavioral response mediated by the abdominal ganglion of Aplysia. Science. 1969;164:847–850. doi: 10.1126/science.164.3881.847. [DOI] [PubMed] [Google Scholar]
- Kwon Y, Shim H-S, Wang X, Montell C. Control of thermotactic behavior via coupling of a TRP channel to a phospholipase C signaling cascade. Nat Neurosci. 2008;11:871–873. doi: 10.1038/nn.2170. [DOI] [PubMed] [Google Scholar]
- Liu L, Yermolaieva O, Johnson WA, Abboud FM, Welsh MJ. Identification and function of thermosensory neurons in Drosophila larvae. Nat Neurosci. 2003;6:267–273. doi: 10.1038/nn1009. [DOI] [PubMed] [Google Scholar]
- Louis M, Huber T, Benton R, Sakmar TP, Vosshall LB. Bilateral olfactory sensory input enhances chemotaxis behavior. Nat Neurosci. 2008;11:187–199. doi: 10.1038/nn2031. [DOI] [PubMed] [Google Scholar]
- Luo L, Clark DA, Biron D, Mahadevan L, Samuel ADT. Sensorimotor control during isothermal tracking in Caenorhabditis elegans. J Exp Biol. 2006;209:4652–4662. doi: 10.1242/jeb.02590. [DOI] [PubMed] [Google Scholar]
- Pierce-Shimomura JT, Morse TM, Lockery SR. The fundamental role of pirouettes in Caenorhabditis elegans chemotaxis. J Neurosci. 1999;19:9557–9569. doi: 10.1523/JNEUROSCI.19-21-09557.1999. [DOI] [PMC free article] [PubMed] [Google Scholar]
- Rosenzweig M, Brennan KM, Tayler TD, Phelps PO, Patapoutian A, Garrity PA. The Drosophila ortholog of vertebrate TRPA1 regulates thermotaxis. Genes Dev. 2005;19:419–424. doi: 10.1101/gad.1278205. [DOI] [PMC free article] [PubMed] [Google Scholar]
- Rosenzweig M, Kang K, Garrity PA. Distinct TRP channels are required for warm and cool avoidance in Drosophila melanogaster. Proc Natl Acad Sci U S A. 2008;105:14668–14673. doi: 10.1073/pnas.0805041105. [DOI] [PMC free article] [PubMed] [Google Scholar]
- Ryu WS, Samuel ADT. Thermotaxis in Caenorhabditis elegans analyzed by measuring responses to defined thermal stimuli. J Neurosci. 2002;22:5727–5733. doi: 10.1523/JNEUROSCI.22-13-05727.2002. [DOI] [PMC free article] [PubMed] [Google Scholar]
- Sayeed O, Benzer S. Behavioral genetics of thermosensation and hygrosensation in Drosophila. Proc Natl Acad Sci U S A. 1996;93:6079–6084. doi: 10.1073/pnas.93.12.6079. [DOI] [PMC free article] [PubMed] [Google Scholar]
- Stephens GJ, Johnson-Kerner B, Bialek W, Ryu WS. Dimensionality and dynamics in the behavior of C. elegans. PLoS Comput Biol. 2008;4:e1000028. doi: 10.1371/journal.pcbi.1000028. [DOI] [PMC free article] [PubMed] [Google Scholar]