Abstract
A ‘bottom-up’ PK/PD analysis approach employing system analysis principles of convolution/deconvolution and special nonparametric estimation procedures is presented to resolve the complex ‘endo-PK/PD’ of the endogenous form of recombinant drugs using erythropoietin (EPO) as an example. A novel cellular deconvolution algorithm is presented that facilitates the identification of the functional relationship between the variables involved in EPO’s complex PK/PD. Five sheep each underwent two phlebotomies spaced 4–6 weeks apart when their hemoglobin levels were reduced from 12 g/dl to 3–4 g/dl. EPO levels and reticulocyte counts were frequently sampled. The data were analysed using end-constrained cubic splines. The rate of reticulocyte production was determined using the novel deconvolution methodology. The erythroid progenitor cells activation rate by EPO was estimated from the reticulocyte production rate using a lag-time parameter which determines the delay in the reticulocyte appearance in the blood relative to the activation of erythroid progenitors. Hysteresis minimization combined with cellular deconvolution was employed to determine the population PK/PD transduction function relating the progenitor activation rate to EPO concentrations in a nonparametric manner without assuming a specific structure. The proposed approach provides a rational informative starting point for developing parametric PK/PD models to resolve the complex endo-PK/PD of recombinant drugs.
Keywords: erythropoietin, cellular deconvolution, hysteresis minimization, end-constrained cubic splines, PD transduction function
Introduction
The number of biologically active peptide and protein drugs produced by recombinant technology is increasing and they are often virtually identical to endogenous substances in their PK/PD. Due to the complex interplay between the endogenous and the exogenous drug, the native ‘endo-PK/PD’ should be considered an integral and not a separate part of the PK/PD of the exogenous drug. It is therefore essential to have a comprehensive knowledge of the PK/PD of endogenous compounds in order to optimize the dosing and administration of the exogenous drug. Such understanding is best gained from ‘natural experiments’, devoid of exogenous drug, in which the biological system is observed under dynamic disease state conditions. Accordingly, the endo-PK/PD may be studied under clinically relevant conditions in pre-clinical animal testing by perturbing a suitable animal model physiologically or pharmacologically to emulate the disease state. However, developments of PK/PD models from endo-PK/PD experiments of perturbed systems is complicated by the fact that the response data from such experiments generally are of a ‘nonparametric nature’. The irregular, nonparametric responses make direct application of parametric PK/PD modeling particularly troublesome. The use of common, standard nonparametric software to resolve important relationships is often of limited use due to the need to impose kinetic and physiologic constraints. Also, the nonparametric nature of the responses makes it difficult to ‘visualize’ response relationships. This, combined with the special complexity of the endo-PK/PD, complicates the PK/PD analysis of such systems.
The primary focus of this work is to propose a novel ‘bottom-up’ (BU) approach to help solve these problems. The BU approach represents a novel kinetic analysis paradigm as an alternative to traditional ‘top-down’ approaches. The BU approach is particularly suitable for analysing the PK/PD of the ‘native’ (endogenous) form of recombinant drugs to better resolve the complex PK/PD of recombinant drugs. The BU approach makes use of system analysis principles [1,2] of convolution and deconvolution, hysteresis minimization [3] and special nonparametric estimation procedures to resolve fundamental response relationships.
The approach is demonstrated using EPO as a suitable example. This work also presents a novel deconvolution algorithm especially aimed at determining the production and transformation of cells. The new deconvolution algorithm is particularly valuable in the present context of analysing the endo-PK/PD of EPO by the BU approach. This is because EPO’s erythropoietic pharmacodynamics is defined by the production of cells (reticulocytes and RBCs) and the deconvolution method enables the erythroid progenitor activation rate to be evaluated directly in an objective, nonparametric manner.
Several PK/PD models for assessing EPO stimulation of erythropoiesis have been developed [4–7]. However, these studies utilized exogenous r-HuEPO and did not investigate the physiology of endogenous EPO produced in response to anemia. The BU approach will be demonstrated using endo-PK/PD data from a sheep model under a phlebotomy-induced anemic state obtained similarly to our previous studies [8–10].
Materials and Methods
Animals
All surgical and experimental procedures received prior approval by the local institutional animal care review committee. Five healthy young adult sheep were selected. The sheep has been used widely as a developmental animal model. It is particularly suited for the study of erythropoiesis, hemoglobin switching and erythropoietin production, as the sites of erythropoiesis, and the types of hemoglobin produced at the fetal and neonatal stages, most closely resemble the situation in humans [11]. The animals were 2–4 months old and weighed 21.3 ± 3.4 kg (mean ± SD) at the beginning of the experiments. The animals were housed in an indoor, light and temperature-controlled environment. All animals were in good health. Jugular venous catheters were placed under anesthesia using pentobarbital. Intravenous ampicillin (1 g) was administered daily for the first 3 days following surgery.
Assays
Plasma EPO concentrations and reticulocyte counts were measured on 0–4 blood samples (0.5 ml per sample) per day drawn throughout the 5–10 week study period. On average, around 35–40 blood samples were drawn from each animal during the study period. The actual number of points in the analysis was less since they only included points up to 25 days post-phlebotomy. Plasma EPO was measured in triplicate using a double antibody radioimmunoassay (RIA) procedure as previously described [12] (lower level of sensitivity is 1 mU/ml). All samples were measured in the same assay set-up to reduce assay variability. The number of reticulocytes was determined by flow cytometry (FACScan, Becton-Dickinson, San Jose, CA, USA) [13].
Study protocol
An increase in endogenous EPO was induced by controlled phlebotomy performed using the jugular venous catheter. Animals were bled to Hb levels of between 3 and 4 g/dl. To maintain a constant blood volume during the procedure, equal volumes of 0.9% NaCl solution were infused for each volume of blood removed. Each animal underwent two phlebotomies of similar intensity performed 4–6 weeks apart. No iron supplementation other than in the animal’s feed was given. To minimize RBC loss due to frequent blood sampling, blood was centrifuged, the plasma removed, and the RBCs re-infused.
PK/PD analysis
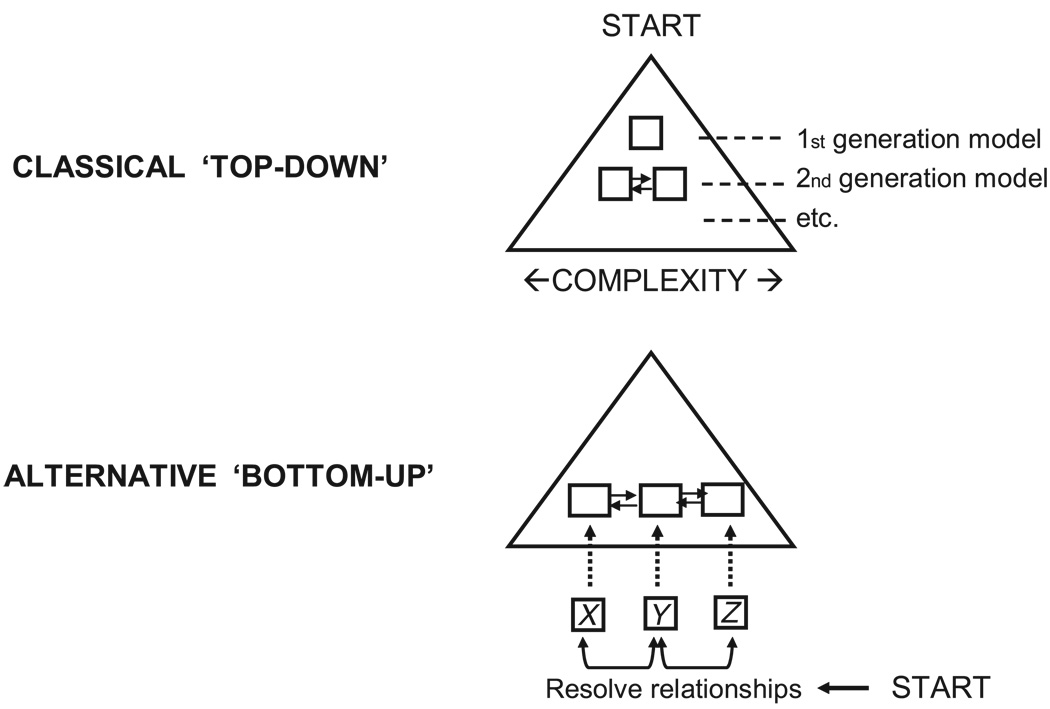
The PK/PD analysis presented serves the sole purpose of demonstrating the BU approach as an alternative to the classical ‘top-down’ analysis approach. In the traditional ‘top-down’ approach (Figure 1), a simple kinetic model is chosen initially (1st generation model). Additional model components are typically incorporated subsequently in the model development which increases the model complexity (2nd generation model). Depending on the complexity of the system and the data available, this process may be repeated (3rd generation model etc.). The way to refine and correct a PK/PD model is often driven by subjective ad hoc ideas more than systematic objective procedures. This is especially true when dealing with complex difficult-to-analyse endo-PK/PD systems.
Figure 1.
Schematic diagram showing the different modeling approaches. In the classical ‘top-down’ approach, a simple model is chosen initially (1st generation model) and in subsequent model development, complexity increases (2nd generation model and so on). In the ‘bottom-up’ approach, the functional relationship between the different kinetic variables (X vs Y, Y vs Z etc.) is resolved in a more direct manner and assembled to build a comprehensive model
The BU approach represents a new modeling paradigm that may overcome some of these problems. This approach starts at the bottom (Figure 1) involving all potentially important response variables and tries to resolve the response relationships in a more direct and objective manner. This is done in the present example through the use of the analysis tools and methodologies described in the sections to follow. Briefly, the BU, as demonstrated here with EPO as an example, consists of two components: firstly, a deconvolution procedure to determine the reticulocyte production rate, and secondly, a hysteresis minimization procedure to resolve the autonomic transduction function relating erythroid progenitor activation rate and the EPO levels.
Cellular convolution/deconvolution
A linear system analysis approach [1,2] was applied to determine the kinetics of EPO’s effect on the erythroid cell line proliferation and differentiation from progenitor cells to reticulocytes to RBCs. Basically, the convolution integral is used to represent a response, R(t) to an arbitrary input, f(t), and is given by the following general expression:
| (1) |
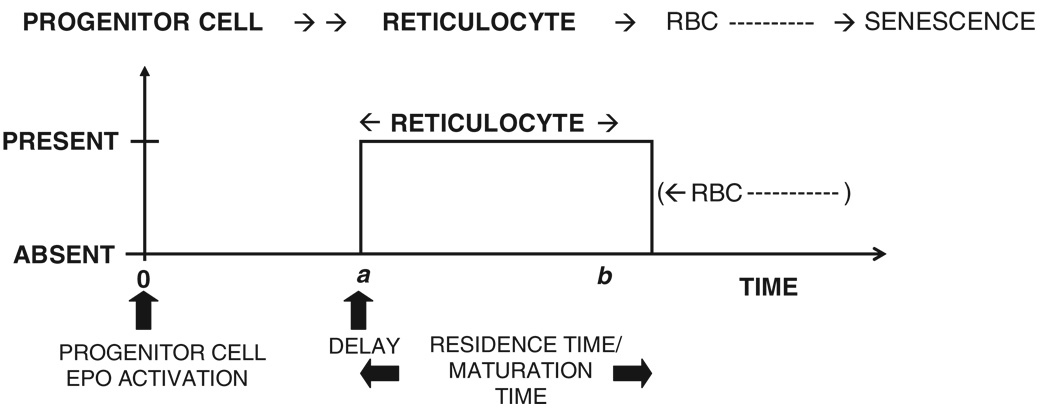
where the unit impulse response, UIR(t), is the response normalized to a unit input (impulse) and * denotes the convolution operation. In the current analysis, the response, R(t), is the reticulocyte counts, fac(t) is the progenitor activation rate and UIR(t) is the reticulocyte disposition function which describes the time course for the appearance and disappearance of a single reticulocyte in the circulation. The UIR(t) (single cell response) for the reticulocyte (Figure 2) is given by:
| (2) |
where:
| (3) |
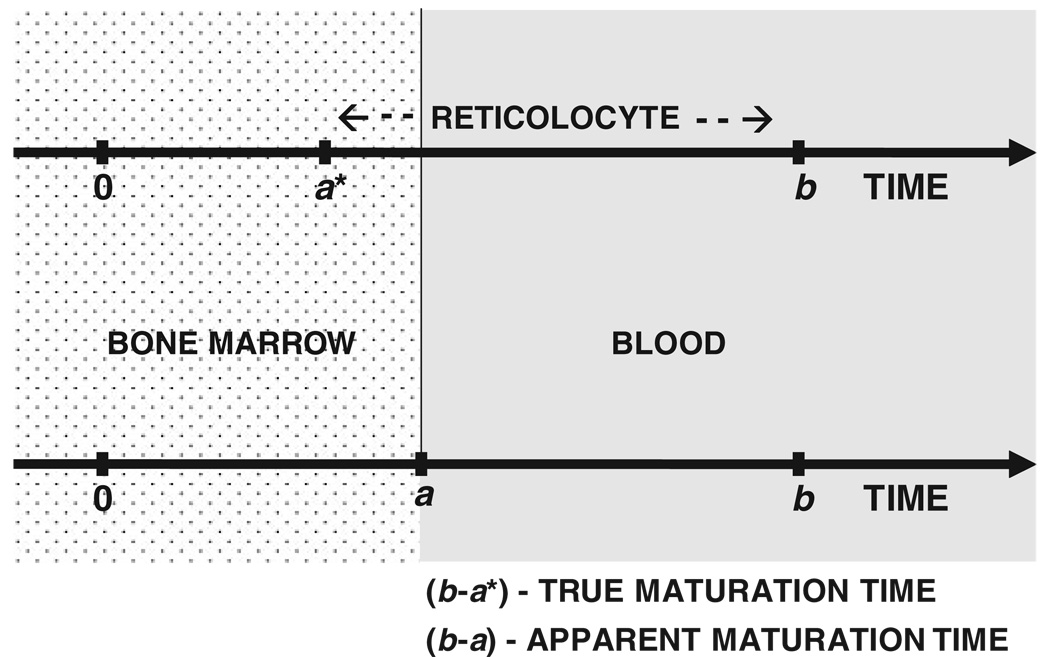
Here, a and b are the reticulocyte disposition parameters. The time it takes for a new reticulocyte to enter the bloodstream is given by a and the parameter difference b – a is the time taken for that reticulocyte to mature into a RBC. Therefore, b – a is the maturation time, or more appropriately, the residence time of the reticulocyte in the blood. In fact, b – a is the apparent maturation time because a denotes the time when the reticulocyte first appears in the blood and not the time for the progenitor cell to differentiate into a reticulocyte, which occurs in the bone marrow. A simplified schematic representation of the time events in the physiology of reticulocyte maturation is presented in Figure 3, where a progenitor cell activated at t = 0 differentiates into a reticulocyte at t = a* in the bone marrow. The reticulocyte is, however, released in a more mature form at t = a into the bloodstream, where the reticulocyte resides until it matures into an RBC at t = b. Thus, (b − a*) is the true maturation time while (b – a) is the apparent maturation time.
Figure 2.
Single cell response (UIR) used to determine the production and transformation rates by cellular deconvolution. The reticulocyte disposition parameters a and b describe the time course of appearance and disappearance (transformation into RBCs) of the reticulocytes
Figure 3.
Physiological considerations in the determination of cellular disposition parameters. The progenitor cell activated at time = 0 differentiates into the reticulocyte at time = a* in the bone marrow. The reticulocyte is released into the circulation at time = a and subsequently matures into a RBC at time = b. The true and apparent reticulocyte maturation times are given by (b–a*) and (b – a) respectively
The general convolution operation has integral limits from time −∞ to current time t (Equation (1)) to account for all ‘prior history’ of the system. The baseline response, Rss, is the steady state reticulocyte count created through a constant progenitor activation rate resulting from an assumed constant EPO baseline level, CEPO(0), present before the start of the phlebotomy experiment (t<0). The phlebotomy experiment was started on day 0.
Let t0 denote the start of a significant perturbation from a prior steady-state in the progenitor activation rate. The reticulocyte response, R(t), can be written as:
| (4) |
The first term in Equation (4), the ‘background response’, RB(t), is defined as the steady-state reticulocyte response created by EPO’s progenitor activation taking place before the start of the phlebotomy. The second term represents the ‘foreground response’, RF(t), defined as the reticulocyte response resulting from progenitor cell activation due to accelerated EPO levels from the induced anemia taking place after the onset of severe anemia from bleeding.
The background response is:
| (5) |
Steady-state condition is assumed to exist before the start of the phlebotomy. The progenitor activation rate, fac(t), at steady-state is:
| (6) |
The background response can then be written as:
| (7) |
| (8) |
Substituting for UIR(t) from Equation (2) and solving, gives:
| (9) |
where the steady-state response (for t < t0), R(t0) = fss(b – a), and (x)+ is the truncation function given by:
| (10) |
The foreground response, RF(t) can be given as:
| (11) |
From Equations (2) and (11), we get:
| (12) |
The reticulocyte response is obtained from Equations (4), (9) and (12):
| (13) |
where R0 = R(t0) = steady state response. Differentiating Equation (13) gives:
| (14) |
where from Equations (7) and (13) it follows that:
| (15) |
| (16) |
From Equations (14) to (16), we get:
| (17) |
The reticulocyte production rate, f(t), can be defined relative to the progenitor activation rate by the lag-time parameter a,
| (18) |
Substituting Equation (18) in Equation (17), gives the rate of change in the reticulocyte response in terms of the reticulocyte production rate,
| (19) |
Solving Equation (19) for f(t) (see Appendix), gives the reticulocyte production rate, f(t), due to the erythroid progenitor activation:
| (20) |
In Equation (20) tp is the start of the perturbation in the measured response (R(t)) resulting from the perturbation (from SS condition) in the activation rate taking place at time t0 = tp–a. The INT(x) function is defined as the largest integer not exceeding the value of x. The above derivation of the key Equation (20) assumes that reticulocytes are not removed by the phlebotomy. Thus, the Equation can be used in this form to determine the reticulocyte production due to a perturbation (from steady state) resulting from an administration of exogenous EPO. In the present experimental setup it is necessary to correct for the reticulocytes removed due to the phlebotomy done at time tp. This removal will, if Equation (20) is not corrected, result in an overestimate of f(t). It is readily shown that if F is the fractional reduction in the reticulocyte count at time tp caused by the phlebotomy, then subtracting the term FR0UIR(t – tp + a)/(b – a) on the right hand side of Equation (20) will exactly correct for the removal of the reticulocytes caused by the phlebotomy. This correction is readily applied since F can be determined from the fractional reduction in the hemoglobin level at tp. The reticulocyte production rate, f(t), is multiplied with the volume of distribution for the reticulocyte (V = 49 ml/kg for sheep [14]) to obtain the total number of reticulocytes produced in the body normalized to the animal body weight.
Hysteresis minimization and EPO transduction function
The PD analysis is based on the kinetic assumptions that the transduction function relating the erythroid activation, fact(t), and the EPO concentration, c(t), is time-invariant and autonomic. The PD concentration-response relationship for EPO can then be represented mathematically in the following general functional form [3].
| (21) |
where c(t) is the EPO concentration and N is the autonomic transduction function that commonly is of a nonlinear form. The hysteresis approach [3] attempts to estimate the transduction function, N, by minimizing the size of the hysteresis loop obtained by plotting the activation rate versus the EPO concentration from 100 equally spaced points using time as the independent variable. The hysteresis size is minimized for optimal values of the reticulocyte disposition parameters, a and b, used in the determination of fact(t) (Equations (18) and (20)). This methodology enables the determination of the underlying PK/PD relationship in an objective, model-independent (nonparametric) manner.
The population PD transduction curves from all the animals was obtained using quadratic programming in combination with the hysteresis and cellular deconvolution procedures. Accordingly, the transduction curve is constrained to be monotonically increasing consistent with increased progenitor activation with rising EPO levels.
Data Analysis
The EPO and reticulocyte responses were nonparametrically estimated using special end-constrained, cross-validation cubic splines previously described [15]. The spline fittings and deconvolution codes were written in Fortran 90/95 and were compiled using the Compaq Visual FORTRAN Professional Edition 6.6.B. The size of the hysteresis loop [3] resulting from Equation (21) was minimized for optimal values of a and b using the Nelder-Mead nonlinear optimization method [16]. The FORTRAN code for the hysteresis minimization procedure [3] used in this analysis can be found in a earlier publication [17]. Quadratic programming to determine the population PD function was performed using the NCONF subroutine of the IMSL FORTRAN library [18] which is based on a FORTRAN code by Schittkowski [19]. The results obtained by running the FORTRAN programs were plotted using the graphic library PVPLOT of WINFUNFIT, a computer program for general nonlinear regression, which is a development from the earlier version, FUNFIT [20].
Results
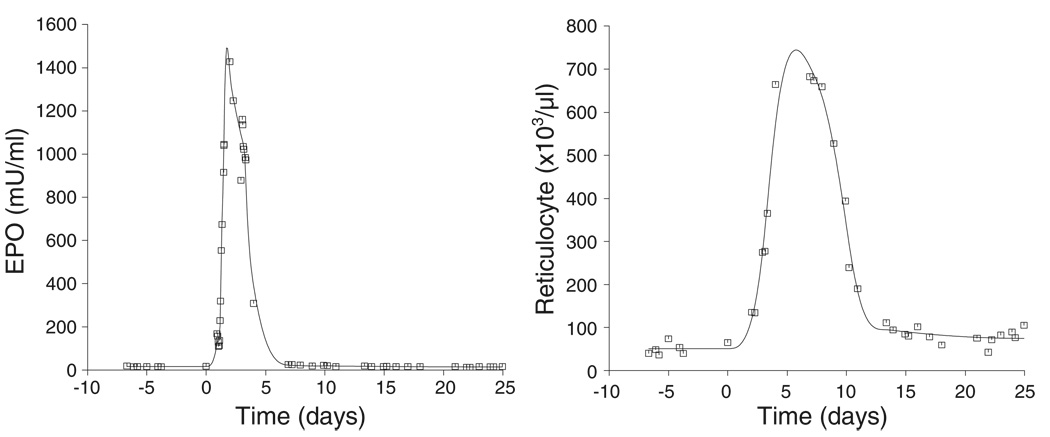
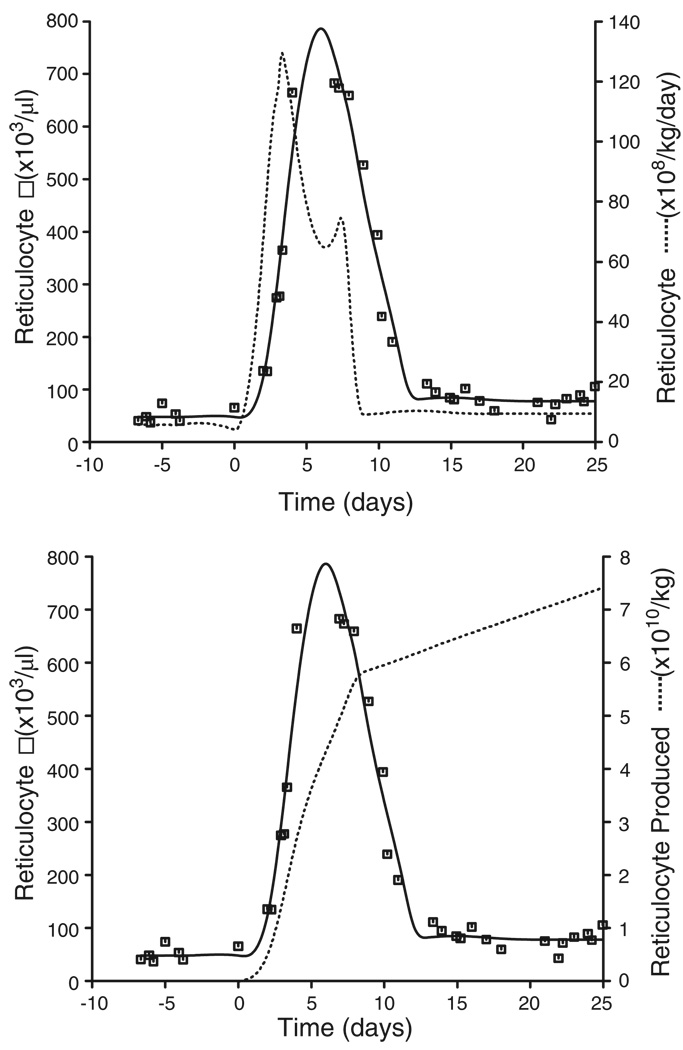
The cubic spline fit to the EPO and reticulocyte response is shown in Figure 4. The rate and extent of reticulocyte production were determined using the novel cellular deconvolution methodology (Figure 5) and the results are summarized in Table 1. The basal reticulocyte production rate was found to be 6.93 × 10⁸ (33) reticulocytes/kg/day (mean (CV%)). Under phlebotomy-induced anemic conditions, the production rate increased to 130 × 108 (36) reticulocytes/kg/day at around 3.0 (38) days following phlebotomy (t = 0 days). The stimulated production was sustained for only a few days before returning to baseline values. The number of reticulocytes produced over 8 days was determined to be 0.5542 × 10¹⁰ (33)/kg compared with the pre-phlebotomy, baseline reticulocyte numbers of 4.03 × 10¹⁰ (40)/kg produced over the same time period.
Figure 4.
Representative plot showing cubic spline fits to the EPO and the reticulocyte responses. The initial step of the ‘bottom-up’ approach is to resolve the relationship between the two variables, the EPO concentration profile (left panel) and the reticulocyte count response (right panel)
Figure 5.
Upper panel: Representative plot of the reticulocyte production rate (dashed line) obtained by deconvolution of the reticulocyte response (solid line obtained by cubic spline fitting to reticulocyte count data □). Lower panel: Representative plot of the number of reticulocytes produced obtained by integrating the reticulocyte rate curve from the upper panel for t > 0 from day 0 (dashed line)
Table 1.
Summary of the rate and extent of reticulocyte production using the cellular deconvolution algorithm and the ‘bottom-up’ approach
| Basal retic rate (108/kg/day) |
Max. retic rate (108/kg/day) |
Retics produced (basal)a (1010/kg) |
Retics produced (stimulated)a (1010/kg) |
|
|---|---|---|---|---|
| Meanb | 6.93 | 130 | 0.554 | 4.03 |
| %CV | 33 | 36 | 33 | 40 |
Number of reticulocytes produced over 8 day starting from day 0 (i.e. start of phlebotomy).
The mean is calculated from n = 5 animals.
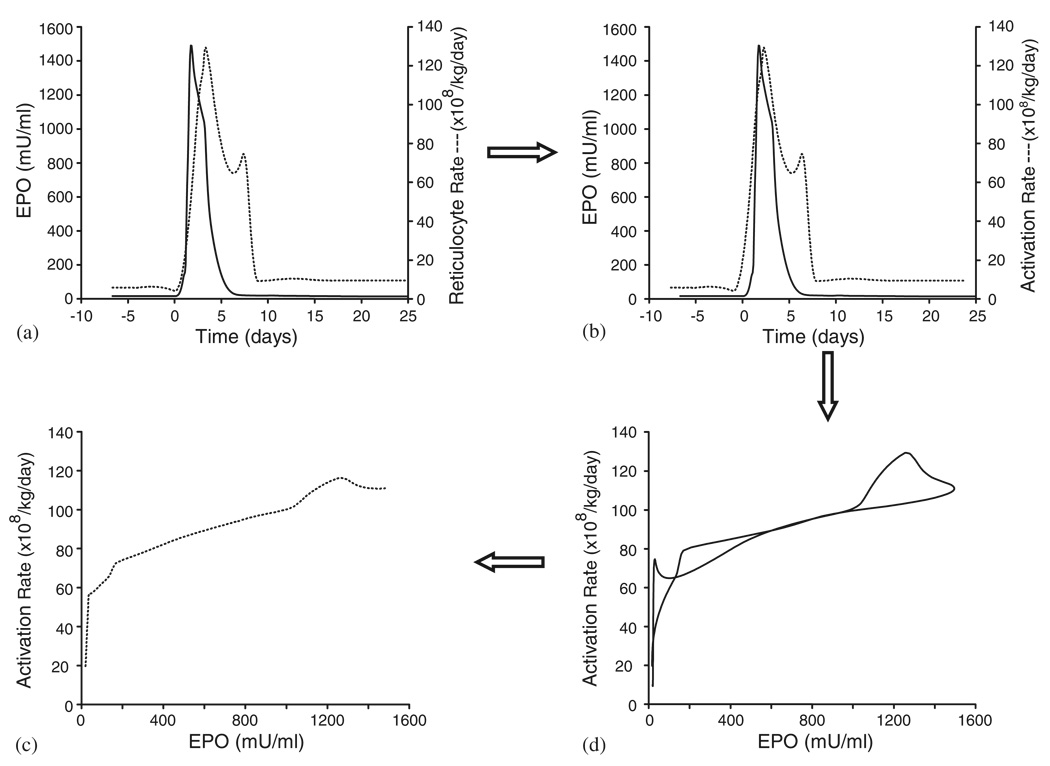
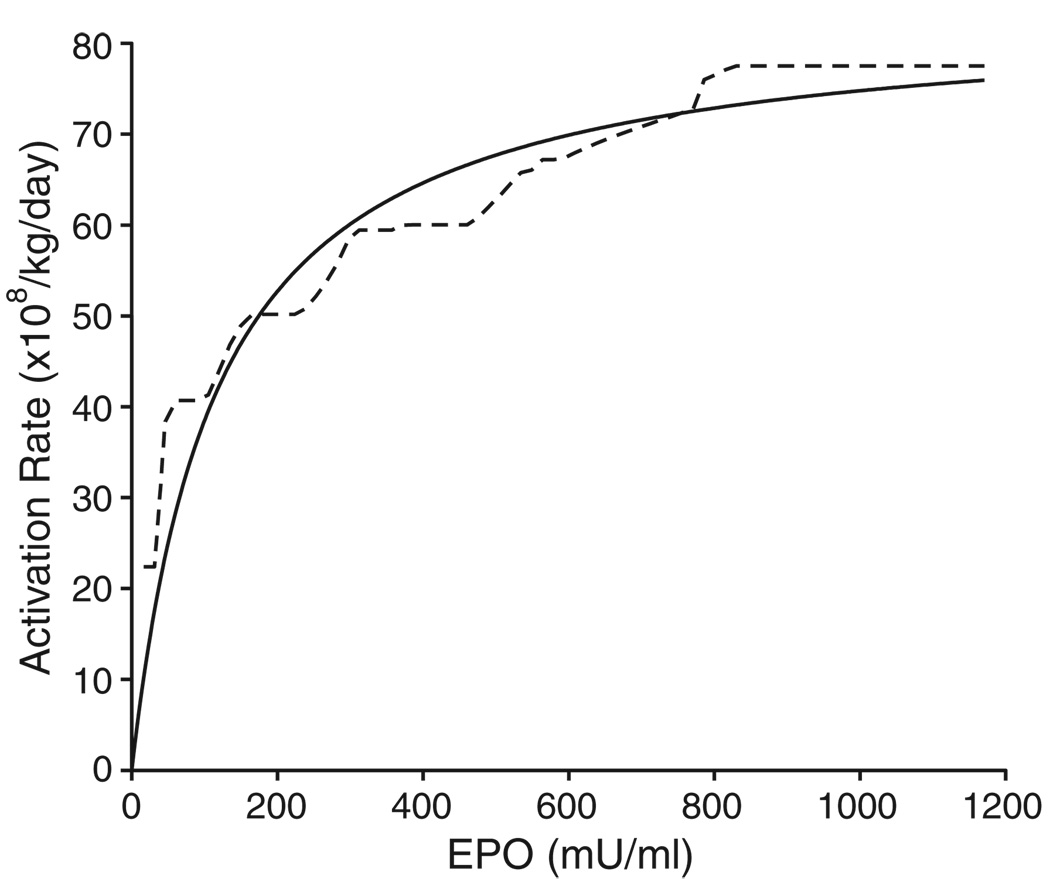
Figure 6 illustrates the hysteresis minimization approach to determine the PD relationship between the EPO concentration and the progenitor activation rate. Panel (a) of Figure 6 shows a representative plot of the estimated EPO curve and the reticulocyte rate. The activation rate is determined by shifting the reticulocyte rate profile by the estimated lag-time parameter (a = 1:01 days in this example) and the resulting curve is shown in panel (b). Panel (c) shows the hysteresis plot of the activation rate from panel (b) vs the EPO plasma concentration from panel (b). The size of the hysteresis loop shown in panel (c) is minimized for optimum a and b values (1.01 days and 4.03 days respectively for this case) which then reveals the shape of the PD transduction profile (panel (d)) obtained by taking the mean value of the hysteresis loop. In the hysteresis plot of panel (c), for the same value of the EPO concentration, there are two values for the progenitor activation rate. In order to maintain the ‘same level, same effect’ property which is the underlying assumption of performing the hysteresis minimization, the mean of these two values is calculated which represents the average effect for a particular EPO concentration. The curve in panel (d) was obtained by taking the mean values of the progenitor rates for different EPO concentrations. The mean values for the a and b parameters were 0.244 (138) days and 4.45 (28) days, respectively. This indicates that the reticulocyte enters the systemic circulation 0.244 days following progenitor cell activation and it takes 4.20 days (b – a value) for the reticulocyte to mature into a red blood cell. The monotonically constrained nonparametric population transduction function obtained from all the animals for both phlebotomies is shown in Figure 7. This figure also shows that the nonparametric population PD transduction function is quite similar to the so-called Emax model commonly applied as a parametric transduction function model in PK/PD analysis.
Figure 6.
(a) Representative plot of the estimated EPO curve (solid line) and reticulocyte rate (dashed line). (b) Representative plot of the estimated EPO curve (solid line) and activation rate (dashed line) obtained by shifting the reticulocyte rate curve by the estimated lag-time parameter a (1.01 days in this example). (c) Hysteresis minimization of activation rate versus EPO. (d) Transduction function of activation rate versus EPO obtained from the hysteresis plot of (c)
Figure 7.
Plot showing the population PD transduction function for the progenitor activation rate determined by the ‘bottom-up’ approach (broken curve). The continuous curve shows an Emax model fit to the hysteresis data (Emax = 83:5 × 10⁸/kg/day; C50 = 117mU=ml)
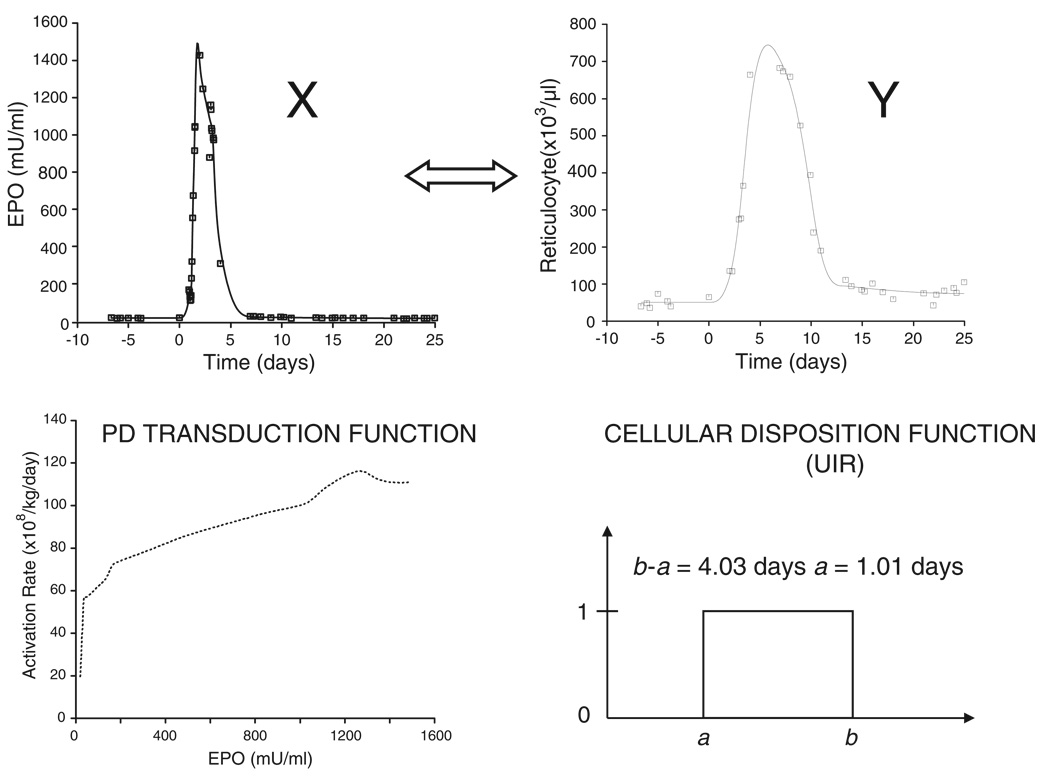
The result of the BU approach for a single animal is illustrated in Figure 8. The relationship between the measured EPO plasma profile (X) and the reticulocyte response (Y) is described by a cellular (reticulocyte) disposition model (b – a = 4:03 days, a = 1:01 days) and a PD transduction function. The BU approach provides a mapping from the pharmacokinetic variable X (EPO plasma concentration profile) to the pharmacodynamic response variable Y (reticulocyte response). This is a two step mapping process: the first step is a mapping of X via the PD transduction function into the progenitor activation rate. The second step is a mapping of the activation rate via a convolution with the cellular disposition function (UIR) into the PD response Y (reticulocyte response).
Figure 8.
Result and summary of the ‘bottom-up’ PK/PD analysis approach for a single animal. The PK response X (EPO plasma level) is mapped into a PD response Y (reticulocyte count) in a 2 step process via the determined PD transduction function followed by a convolution with the determined cellular disposition function
Discussion
The new analysis paradigm
The determination of the relationship(s) between drug concentration and pharmacological effect(s) is of vital importance in drug therapy. Several models have been investigated and proposed to establish the nature of the PD relationship [21,22]. A number of different methodologies have also been developed from the traditional structured modeling approaches [23,24] to the nonparametric developments using hysteresis minimization principles [3,25–27].
In the traditional methodology, specific parametric PD models are utilized [21] and the ‘top-down’ approach is employed where the model complexity is increased as extra details are integrated into the existing model or the model is developed to better agree with observed data. Alternatively, system analysis approaches to PD modeling [2,28] are more objective and make fewer assumptions about the kinetic relationships. The proposed BU methodology is an extension of this approach where the effect is not readily measurable (e.g. progenitor activation rate). In the present example, a novel cellular deconvolution method is proposed to determine the rate of erythroid progenitor activation (EPO’s ‘site of action’) from the reticulocyte production rate (Equation (20)) through a lag-time relationship (Equation (18)). The cellular deconvolution in conjunction with the hysteresis minimization algorithm enables the PD transduction function between the EPO concentrations and its activation of the progenitors to be determined in a nonparametric fashion without specifying an explicit dynamic model.
The BU methodology is illustrated through the basic procedural steps for resolving the autonomic and non-autonomic functional components of the relationship between the EPO plasma level and the reticulocyte count response. It is an objective procedure by not requiring a specific PD model. Also, by utilizing nonparametric regression technique specially designed to handle kinetic and physiologic constraints [15], it is particularly suitable for endo-PK/PD analysis.
Cellular convolution/deconvolution
The deconvolution algorithm is based on the assumption of a linear relationship between the production of activated erythroid progenitor cells and the resulting measured response (reticulocyte count). This assumption will hold true if the activated cells behave independently of each other, which is a reasonable assumption, such that the so-called linear superposition principle holds true. The progenitor activation by EPO is allowed to be nonlinear in nature. It is assumed that the disposition of the activated cells is the same and time invariant. Thus, all cells share the same a and b parameters that remain constant during the experiment. It is possible that a and (b – a) are different at baseline and during the stress erythropoiesis taking place in these experiments. The present experiments are specifically aimed at determining the parameters under stress conditions caused by the severe phlebotomy induced anemia. Thus, if there is a change in these cellular disposition parameters (a, b) applying the parameters outside this condition, e.g. at baseline to calculate the basal rate of reticulocyte production, may result in some inaccuracy. The assumption of a steady state for t<t0 appears a reasonable assumption, accepting the natural biological fluctuations as unavoidable ‘biological errors’. The baseline fluctuations appear on a small scale relative to the maximal perturbation in the response caused by the phlebotomy induced anemia, and thus are not a major problem.
Separately, and independently of the deconvolution algorithm the present formulation/example of a bottom-up approach makes use of the hysteresis minimization approach to determine the transduction function N(CEPO), which assumes a general autonomic relationship. Other, non-autonomic relationships may be a possibility, although the present analysis clearly points to an autonomic type relationship (Emax model). The erythropoietic system is indeed a complex system with several possible interpretations. The best we can do is to be objective and to let the data, as much as possible, guide us towards a proper model. The bottom-up approach is a valuable step in that direction.
Although reticulocyte production rates under steady state conditions can be determined easily, no literature is available on the evaluation of the rate of reticulocyte production under non-steady state conditions. Our novel deconvolution algorithm allows a quantification of both the steady state and non-steady state production and transformation rates of hematopoietic cells in a direct, model-independent (nonparametric) manner that apparently has not been possible before. The deconvolution method corrects for the confounding lag-times present in the production of these cells, which is particularly important when analyzing the cellular production rate in relationship to the drugs and growth factors influencing the cellular production. The methodology is not limited to the cellular kinetics of EPO’s effect on the erythroid cell line’s proliferation and differentiation, but can be broadly applied to any cell type, thus making it a particularly valuable PK/PD analysis tool.
In order to establish the true time-lag relationship between the reticulocyte production and erythroid precursor activation rates, it is assumed that new red cells enter the circulation in the reticulocyte stage. This is a reasonable assumption and many investigators have demonstrated that there are no reserve red cells in the bone marrow [29,30]. The reticulocyte surface is ‘sticky’ and it has been postulated that the reticulocytes are kept back in the bone marrow until the adhesiveness has been reduced [31].
The methodology requires the response data and its derivative (Equation (20)) to be estimated as accurately as possible, which is intrinsic to the deconvolution operation and not specific to this method. Besides, in contrast to exo-PK/PD experiments, the responses in endo-PK/PD experiments (e.g. phlebotomy to emulate disease state) will typically be of an irregular, ‘nonparametric nature’ requiring special nonparametric estimation procedures suitable to treat such data. Recently, nonparametric end-constrained cubic splines particularly constructed to deal with the unequally spaced and sparse PK/PD data, and to handle physiologic constraints have been employed, that are suitable for such response approximations [15].
Model parameters
The assumption of the same a and b parameters for all cells is strictly speaking violated. Thus, the a and b parameters should be interpreted in a ‘mean value’ (expected value) distribution sense (a true statement for a linear system). Extension to consider arbitrary assumed distributions for the a and b parameters only requires an additional convolution term. However, it is questionable if much is gained in going to that degree of complexity since it is the effective mean a and b parameter that are most important, which are determined in this study.
The estimated mean values for the a and b – a parameters are 0.244 and 4.20 days respectively, which are comparable to the estimates (0.470 and 4.98 days) obtained from a previous parametric analysis in sheep [9]. The average reticulocyte maturation time (b – a) under stimulated state is larger than the maturation time under non-stimulated normal conditions, which is thought to be 1–2 days [32–34]. In the presence of severe, anemia-induced stress erythropoiesis, there is an elevated number of immature reticulocytes (‘shift’ reticulocytes) in the blood [30,33] probably resulting in longer maturation times. It has been suggested [35] that EPO accelerates the release of reticulocytes from the bone marrow. Some studies [33,36] have shown that the shift reticulocytes take 1–3 days longer than the normal reticulocytes to lose their reticulum. The results of our analysis are consistent with the longer maturation times observed under anemic conditions.
PD transduction function
The response of burst-forming unit-erythroid (BFU-E) and colony-forming unit-erythroid (CFU-E) to EPO correlates well with the number of EPO receptors (EPOR) on those cells. With the development of a small number of EPORs expressed on the BFU-E, a weak response to EPO is seen in these cells [37]. After the peak receptor number is reached at the CFU-E stage, EPORs decline parallel to a reduced dependency on the hormone [37,38]. The number of EPORs gradually decreases during erythroid cell differentiation, and studies have shown that the reticulocyte and mature erythrocyte do not contain EPORs for continued erythroid maturation [37–39]. Our assumption that EPO is required for precursor activation is consistent with these findings.
The majority of the EPORs are expressed on the precursor cells of the marrow with the number of receptors averaging less than 1000 per cell [40]. The saturable transduction function for EPO’s stimulatory effect identified by the BU approach is consistent with the limited capacity for EPO-EPOR binding at higher EPO concentrations. The nonparametrically determined PD transduction function can serve as a guide for parametric PK/PD modeling development. Thus, the BU approach can serve as an exploratory tool in PK/PD analysis. Linear as well as the Emax and sigmoid Emax models have been proposed for EPO stimulation in a number of complex PK/PD analyses [6–9,41]. The BU analysis lends support to the use of the parametric Emax stimulatory transduction model.
The ‘bottom-up’ methodology presented here is primarily an exploratory data analysis tool to determine the nature of the underlying PK/PD transduction relationships. The BU approach provides a ‘visualization’ of the PD transduction relationship helpful in identifying a proper parametric transduction model. A parametric analysis can be performed subsequent to the exploratory stage to estimate the parameters of interest and for prediction purposes. The present demonstration of the BU approach identified a relationship between two variables (X and Y, Figure 8). Similarly, the relationship between additional variables of interest can be determined nonparametrically and then assembled together to build a comprehensive model that can fully characterize the system under study. For example, the present analysis may be repeated to consider the relationship between the EPO plasma concentration and the production of RBCs following the same principles as already described.
Acknowledgements
The recombinant human EPO used in the EPO RIA was a gift from Dr H. Kinoshita of Chugai Pharmaceutical Company, Ltd (Tokyo, Japan). The rabbit EPO antiserum used in the EPO RIA was a generous gift from Gisela K. Clemens, Ph.D. The authors gratefully acknowledge the technical help from Lance S. Lowe. The authors thank Dr Robert T Cook and the personnel (Barbara Stewart, Cathy Byers, Kathy McLatchie, Beth Greif and Lisa Alberty) of the Iowa City VAMC Pathology and Laboratory Medicine Service for their assistance in performing the flow cytometric measurements of reticulocytes.
This work is supported by the United States Public Health Service National Institute of Health Grants PO1 HL46925 and R21 GM57367, and by the Veterans Administration Medical Center, Iowa City, Iowa.
Appendix
First consider the case when t ≥ t0 + b, i.e. when t – t0 ≥ b.
Let k be defined as the largest non-negative integer for which:
| (1A) |
which implies (for a ≥ 0) that:
| (2A) |
| (3A) |
In Equation (19) replace t – t0 with t – t0–L × (b – a) and equivalently replace t with t–L(b – a) and noting that (t – t0) ≥ b this Equation becomes:
| (4A) |
Summing Equation (4A) for L = 0, 1,…, k results in cancellation of all terms except the first and the last, giving:
| (5A) |
Next in Equation (19) replace t – t0 with t – t0–(k + 1)(b – a), equivalent to replacing t with t–(k + 1)(b – a), and knowing that:
| (6A) |
| (7A) |
we then get:
| (8A) |
Adding Equations (5A) and (8A), i.e. extending the summation in Equation (5A) to n = k + 1 we get after rearrangement:
| (9A) |
Next consider the remaining case where 0 ≤ t – t0 < b.
From Equation (19) it follows, as expected, that dR(t)/dt = 0 corresponding to f(t) = R0/(b – a). This case is also considered by Equation (9A) for n = 0. From Equation (6A) it follows that:
| (10A) |
Let tp define the start of the perturbation in the measured response (R(t)) resulting from the perturbation (from steady state) in the progenitor activation rate taking place at time t0, then tp = t0 – a and Equation (10A) becomes after substitution:
| (11A) |
Thus, we get:
| (12A) |
The above derivation was for t ≥ tp. It is evident from the stated assumptions, and the derivations that f(t) = R0/(b – a) for t < tp. This trivial case is readily considered by ensuring that n is non-negative, i.e.:
| (13A) |
Thus, noting that dR(t)/dt = 0 for t < tp it is realized that Equation (9A) subject to Equation (13A) is valid for all values of t. Equations (9A) and (13A) completes the proof of the deconvolution algorithm Equation (20).
References
- 1.Cutler DJ. Linear systems analysis in pharmacokinetics. J Pharmacokinet Biopharm. 1978;6:265–282. doi: 10.1007/BF01312266. [DOI] [PubMed] [Google Scholar]
- 2.Veng-Pedersen P. Noncompartmentally-based pharmacokinetic modeling. Adv Drug Delivery Rev. 2001;48:265–300. doi: 10.1016/s0169-409x(01)00119-3. [DOI] [PubMed] [Google Scholar]
- 3.Modi NB, Veng-Pedersen P. Validation of a variable direction hysteresis minimization pharmacodynamic approach: cardiovascular effects of alfentanil. Pharm Res. 1994;11:128–135. doi: 10.1023/a:1018966232183. [DOI] [PubMed] [Google Scholar]
- 4.Brockmoller J, Kochling J, Weber W, Looby M, Roots I, Neumayer HH. The pharmacokinetics and pharmacodynamics of recombinant human erythropoietin in haemodialysis patients. Br J Clin Pharmacol. 1992;34:499–508. [PMC free article] [PubMed] [Google Scholar]
- 5.Uehlinger DE, Gotch FA, Sheiner LB. A pharmacodynamic model of erythropoietin therapy for uremic anemia. Clin Pharmacol Ther. 1992;51:76–89. doi: 10.1038/clpt.1992.10. [DOI] [PubMed] [Google Scholar]
- 6.Krzyzanski W, Jusko WJ, Wacholtz MC, Minton N, Cheung WK. Pharmacokinetic and pharmacodynamic modeling of recombinant human erythropoietin after multiple subcutaneous doses in healthy subjects. Eur J Pharm Sci. 2005;26:295–306. doi: 10.1016/j.ejps.2005.06.010. [DOI] [PubMed] [Google Scholar]
- 7.Ramakrishnan R, Cheung WK, Wacholtz MC, Minton N, Jusko WJ. Pharmacokinetic and pharmacodynamic modeling of recombinant human erythropoietin after single and multiple doses in healthy volunteers. J Clin Pharmacol. 2004;44:991–1002. doi: 10.1177/0091270004268411. [DOI] [PubMed] [Google Scholar]
- 8.Veng-Pedersen P, Chapel S, Schmidt RL, Al-Huniti NH, Cook RT, Widness JA. An integrated pharmacodynamic analysis of erythropoietin, reticulocyte, and hemoglobin responses in acute anemia. Pharm Res. 2002;19:1630–1635. doi: 10.1023/a:1020797110836. [DOI] [PubMed] [Google Scholar]
- 9.Chapel SH, Veng-Pedersen P, Schmidt RL, Widness JA. A pharmacodynamic analysis of erythropoietin-stimulated reticulocyte response in phlebotomized sheep. J Pharmacol Exp Ther. 2000;295:346–351. [PubMed] [Google Scholar]
- 10.Al-Huniti NH, Widness JA, Schmidt RL, Veng-Pedersen P. Pharmacokinetic/pharmacodynamic analysis of paradoxal regulation of erythropoietin production in acute anemia. J Pharmacol Exp Ther. 2004;310:202–208. doi: 10.1124/jpet.104.066027. [DOI] [PubMed] [Google Scholar]
- 11.Wintour EM, Butkus A, Clemons G, Moritz K. Erythropoiesis and hemoglobin switching in the fetus and neonate. Proc Aust Physiol Pharmacol Soc. 1991;22:44–52. [Google Scholar]
- 12.Widness JA, Schmidt RL, Veng-Pedersen P, Modi NB, Sawyer ST. A sensitive and specific erythropoietin immunoprecipitation assay: application to pharmacokinetic studies. J Lab Clin Med. 1992;119:285–294. [PubMed] [Google Scholar]
- 13.Peters C, Georgieff MK, de Alarcon PA, et al. Effect of chronic erythropoietin administration on plasma iron in newborn lambs. Biol Neonate. 1996;70:218–228. doi: 10.1159/000244368. [DOI] [PubMed] [Google Scholar]
- 14.Adams D, McKinley M. ANZCCART News. Australia: 1995. The Sheep; pp. 1–4. [Google Scholar]
- 15.Neelakantan S, Veng-Pedersen P. Determination of drug absorption rate in time-variant disposition by direct deconvolution using beta clearance correction and end-constrained non-parametric regression. Biopharm Drug Dispos. 2005;26:353–370. doi: 10.1002/bdd.468. [DOI] [PubMed] [Google Scholar]
- 16.Nelder JA, Mead R. A simplex method for function minimization. Comp J. 1965;7:308–311. [Google Scholar]
- 17.Veng-Pedersen P, Modi NB. Pharmacodynamic system analysis of the biophase level predictor and the transduction function. J Pharm Sci. 1992;81:925–934. doi: 10.1002/jps.2600810918. [DOI] [PubMed] [Google Scholar]
- 18.IMSL Fortran Numerical Library. Houston: Visual Numerics, Inc; [Google Scholar]
- 19.Schittkowski K. NLPQL: A FORTRAN subroutine solving constrained nonlinear programming problems. Ann Operations Res. 1986;5:485–500. [Google Scholar]
- 20.Veng-Pedersen P. Curve fitting and modelling in pharmacokinetics and some practical experiences with NONLIN and a new program FUNFIT. J Pharmacokinet Biopharm. 1977;5:513–531. doi: 10.1007/BF01061732. [DOI] [PubMed] [Google Scholar]
- 21.Holford NH, Sheiner LB. Kinetics of pharmacologic response. Pharmacol Ther. 1982;16:143–166. doi: 10.1016/0163-7258(82)90051-1. [DOI] [PubMed] [Google Scholar]
- 22.Wagner JG. Kinetics of pharmacologic response. I. Proposed relationships between response and drug concentration in the intact animal and man. J Theor Biol. 1968;20:173–201. doi: 10.1016/0022-5193(68)90188-4. [DOI] [PubMed] [Google Scholar]
- 23.Brueckner RP, Fleckenstein L. Simultaneous modeling of the pharmacokinetics and methemoglobin pharmacodynamics of an 8-aminoquinoline candidate antimalarial (WR 238605) Pharm Res. 1991;8:1505–1510. doi: 10.1023/a:1015842316177. [DOI] [PubMed] [Google Scholar]
- 24.Segre G. Kinetics of interaction between drugs and biological systems. Il Farmaco. 1968;23:907–918. [PubMed] [Google Scholar]
- 25.Unadkat JD, Bartha F, Sheiner LB. Simultaneous modeling of pharmacokinetics and pharmacodynamics with nonparametric kinetic and dynamic models. Clin Pharmacol Ther. 1986;40:86–93. doi: 10.1038/clpt.1986.143. [DOI] [PubMed] [Google Scholar]
- 26.Fuseau E, Sheiner LB. Simultaneous modeling of pharmacokinetics and pharmacodynamics with a nonparametric pharmacodynamic model. Clin Pharmacol Ther. 1984;35:733–741. doi: 10.1038/clpt.1984.104. [DOI] [PubMed] [Google Scholar]
- 27.Veng-Pedersen P, Mandema JW, Danhof M. A system approach to pharmacodynamics. III: An algorithm and computer program, COLAPS, for pharmacodynamic modeling. J Pharm Sci. 1991;80:488–495. doi: 10.1002/jps.2600800518. [DOI] [PubMed] [Google Scholar]
- 28.Veng-Pedersen P, Gillespie WR. A system approach to pharmacodynamics. I: Theoretical framework. J Pharm Sci. 1988;77:39–47. doi: 10.1002/jps.2600770108. [DOI] [PubMed] [Google Scholar]
- 29.Riddle MC. Pernicious anemia. Blood regeneration during early remission. Arch Intern Med. 1930;46:417–439. [Google Scholar]
- 30.Seip M. Reticulocyte studies. Acta Med Scand. 1953;146 Suppl. 282:1–164. [Google Scholar]
- 31.Key JA. Studies on erythrocytes, with special reference to reticulum, polychromatophilia and mitochondria. Arch Intern Med. 1921;28:511–549. [Google Scholar]
- 32.Finch CA, Harker LA, Cook JD. Kinetics of the formed elements of human blood. Blood. 1977;50:699–707. [PubMed] [Google Scholar]
- 33.Hillman RS, Finch CA. Erythropoiesis: normal and abnormal. Semin Hematol. 1967;4:327–336. [PubMed] [Google Scholar]
- 34.Brugnara C. Reticulocyte cellular indices: a new approach in the diagnosis of anemias and monitoring of erythropoietic function. Crit Rev Clin Lab Sci. 2000;37:93–130. doi: 10.1080/10408360091174196. [DOI] [PubMed] [Google Scholar]
- 35.Jelkmann W. Erythropoietin: structure, control of production, and function. Physiol Rev. 1992;72:449–489. doi: 10.1152/physrev.1992.72.2.449. [DOI] [PubMed] [Google Scholar]
- 36.Heath CW, Daland GA. The life of reticulocytes. Experiments on their maturation. Arch Intern Med. 1930;46:533–551. [Google Scholar]
- 37.Sawada K, Krantz SB, Dai CH, et al. Purification of human blood burst-forming units-erythroid and demonstration of the evolution of erythropoietin receptors. J Cell Physiol. 1990;142:219–230. doi: 10.1002/jcp.1041420202. [DOI] [PubMed] [Google Scholar]
- 38.Sawyer ST, Koury MJ. Erythropoietin requirement during terminal erythroid differentiation: the role of surface receptors for erythropoietin (Abs.) J Cell Biol. 1987;105:1077. [Google Scholar]
- 39.Wickrema A, Krantz SB, Winkelmann JC, Bondurant MC. Differentiation and erythropoietin receptor gene expression in human erythroid progenitor cells. Blood. 1992;80:1940–1949. [PubMed] [Google Scholar]
- 40.D’Andrea AD, Zon LI. Erythropoietin receptor. Subunit structure and activation. J Clin Invest. 1990;86:681–687. doi: 10.1172/JCI114763. [DOI] [PMC free article] [PubMed] [Google Scholar]
- 41.Al-Huniti NH, Widness JA, Schmidt RL, Veng-Pedersen P. Pharmacodynamic analysis of changes in reticulocyte subtype distribution in phlebotomy-induced stress erythropoiesis. J Pharmacokinet Pharmacodyn. 2005;32:359–376. doi: 10.1007/s10928-005-0009-3. [DOI] [PubMed] [Google Scholar]


