

Abstract
The recent crystal structure of the ATP-gated P2X4 receptor revealed a static view of its architecture, but the molecular mechanisms underlying the P2X channels activation are still unknown. By using a P2X2 model based on the x-ray structure, we sought salt bridges formed between charged residues located in a region that directly connects putative ATP-binding sites to the ion channel. To reveal their significance for ion channel activation, we made systematic charge exchanges and measured the effects on ATP sensitivity. We found that charge reversals at the interfacial residues Glu63 and Arg274 produced gain-of-function phenotypes that were cancelled upon paired charge swapping. These results suggest that a putative intersubunit salt bridge formed between Glu63 and Arg274 contributes to the ion channel function. Engineered cysteines E63C and R274C formed redox-dependent cross-links in the absence of ATP. By contrast, the presence of ATP reduced the rate of disulfide bond formation, indicating that ATP binding might trigger relative movement of adjacent subunits at the level of Glu63 and Arg274, allowing the transmembrane helices to open the channel.
Keywords: Cysteine-mediated Cross-linking, Ion Channels, Neurotransmitter Receptors, Purinergic Receptor, Receptor Structure-Function, MTS Compound, P2X Receptor, Allostery, Gating, Ligand-gated Ion Channel
Introduction
P2X receptors (P2XRs)5 are membrane cation channels gated by extracellular ATP. They are widely distributed in excitable and nonexcitable cells of vertebrates (1) and play key roles in synaptic transmission (2), presynaptic modulation (3), taste sensation (4, 5), pain signaling (6, 7), and intestinal motility (8).
P2XRs are allosteric trimeric ion channels formed by the oligomerization of three identical or homologous subunits (9, 10). Each subunit (there are seven identified so far in mammals, termed P2X1 through P2X7) possesses intracellular N and C termini and two transmembrane segments, termed TM1 and TM2, joined by an extracellular ectodomain. The binding of ATP to the ectodomain promotes the rapid opening of the ion channel, referred to as gating. Once the channel is opened, cations transit through the pore down their electrochemical gradients, leading to the transient influx of sodium and calcium into the cell. This in turn leads to depolarization of the cell and downstream calcium signaling. It is thought that gating involves long range conformational changes that are transduced from the ATP-binding sites to the ion channel and even to the cytosolic domain (11). However, the molecular mechanisms underlying the gating process in P2XR are still largely unknown.
Very recently, the crystal structure of zebra fish P2X4R (zfP2X4R) has been solved by x-ray crystallography at a resolution of 3.1 Å (12). The structure was solved in the absence of ATP and probably represents the closed state of the ion channel. The location of the ATP-binding sites remains unknown; however, it has been suggested that the nucleotide binds to deep intersubunit grooves, located on the outside of the trimer, 45 Å from the ion channel domain, and surrounded by conserved residues previously shown to be important for ATP function (12). This structure thus represents an outstanding advance in the P2XR field (13) and should facilitate better understanding of the molecular mechanism that couples ATP binding to ion channel opening.
To gain deeper insight into the mechanism of channel opening, we produced by comparative modeling a P2X2R molecular model based on the crystal structure of zfP2X4R. This P2X2 model was used, in particular, to identify salt bridges formed by charged and conserved amino acid residues (Fig. 1). Interestingly, these residues were located mainly in the β-sandwich body (12), a central domain connecting the putative ATP-binding site to the ion channel (Fig. 1A). We mutated, one at a time, these residues into the opposite charge to create charge-repelling interactions that may modify the receptor function. Consecutively, we produced charge swap of pairs of residues causing modifications and predicted to be spatially close, to potentially restore the ionic interaction. Using this approach, we show that charge reversals at Glu63 and Arg274 in P2X2R produced gain-of-function effects that were cancelled upon paired charge swapping, suggesting that a critical intersubunit salt bridge formed between these residues contributes to the ion channel function of the receptor at an unexplored subunit interface area. Disulfide bond formation between engineered cysteines confirmed the close proximity of these residues in the absence of ATP. By contrast, the presence of ATP reduced the rate of disulfide bond formation, suggesting that during gating, Glu63 and Arg274 move away from each other. Based on these results, we propose that this intersubunit salt bridge contributes to the gating of the ion channel.
FIGURE 1.

Molecular model of rat P2X2R. A, top, lateral view of the model illustrating the five segments (red) containing the investigated titratable residues. The putative ATP-binding site, TM1, and TM2 are also indicated. Bottom, close-up view of pairs of titratable residues. Also indicated are the β-strand numbers. Each subunit is depicted in a different color. B, sequence alignment of these five segments of rat (r), human (h), and zebrafish (zf) P2X1-P2X4 and P2X7. Conserved (in at least two homologues) basic (blue) and acidic (red) charged residues are indicated. Identical residues are shown in boldface type. Secondary structure elements are indicated in a schematic diagram below the alignment. A star labels the identified positions.
EXPERIMENTAL PROCEDURES
Mutagenesis
pcDNA plasmid containing the cDNA encoding the rat P2X2 subunit tagged at the C terminus with the Myc sequence (EQKLISEEDL) was generously provided by F. Rassendren (CNRS, Montpellier, France). P2X2-2T was designed by mutating Cys348 and Cys430 to threonine. Site-directed mutagenesis was carried out using the QuikChange® II Site-directed mutagenesis kit (Stratagene), and mutation was confirmed by DNA sequencing.
Cell Culture and Transfection
HEK-293 cells were cultured in Dulbecco's modified Eagle's medium supplemented with 10% fetal bovine serum (Invitrogen), 1× GlutaMax, 100 units/ml penicillin, and 100 μg/ml streptomycin (Invitrogen). Trypsin-treated cells were seeded onto glass coverslips in 35-mm dishes (for patch clamp experiments) or in 100-mm dishes (for biochemical experiments) pretreated with poly-l-Lysine (Sigma) 1 day before transfection and incubated at 37 °C with 5% CO2. Transfections were carried out using calcium phosphate precipitation. For patch clamp experiments, cells were transfected with the P2X2 constructs (0.1–0.3 μg) and a green fluorescent protein cDNA construct (0.3 μg) to identify cells that were efficiently transfected. Cells were washed 1 day after transfection with fresh medium and used within 24 h. For biochemical experiments, cells were transfected with the P2X2 constructs (5 μg) and used 1 day after.
Electrophysiology
Currents were recorded using the whole-cell configuration of the patch clamp technique only from fluorescent cells. Cells were maintained at a holding potential of −60 mV. Patch pipettes (3–5 megaohms) contained 140 mm KCl, 5 mm MgCl2, 5 mm EGTA, 10 mm HEPES, pH 7.3. External solution contained 140 mm NaCl, 2.8 mm KCl, 2 mm CaCl2, 2 mm MgCl2, 10 mm glucose, 10 mm HEPES, pH 7.3, and was delivered (containing or not containing ATP and/or chemicals) through three parallel tubes placed immediately above the cell. These tubes are displaced horizontally with the aid of a computer-driven system (SF 77A Perfusion fast step, Warner) that ensures solution exchange in 5–10 ms. ATP (sodium salt, Sigma) was applied briefly (2 s), and for high ATP concentrations (≥300 μm), pH was carefully adjusted with NaOH. Sodium (2-sulfonatoethyl)methanethiosulfonate (MTSES) and [2-(trimethylammonium)ethyl]methanethiosulfonate bromide (MTSET) reagents (Toronto Research Chemicals) were made as stock solutions (0.5 m) in DMSO and stored in aliquots at −20 °C. Aliquots were diluted in external solution to a final concentration of 1 mm within 120 s of being applied to cells. For each cell, ATP concentration-response relationships were constructed before and after treatment by the methanethiosulfonate (MTS) compound, applied for 60 s, followed by a wash of 30 s. Disulfide bond formation was monitored by recording ATP-evoked currents before and after treatment with 0.3% H2O2 (Sigma), applied for the indicated time, followed by a wash of 30 s. Reversibility was checked by exposing the same cell to 10 mm dithiothreitol (DTT) (Sigma) for 120 s, followed by a 30-s wash time.
Cell Surface Labeling
Adherent intact cells in dishes were incubated for 30 min under gentle agitation with a 2 mm concentration of the cell-impermeant, thiol-cleavable reagent sulfosuccinimidyl-2-(biotinamido)ethyl-1,3-dithiopropionate (Sulfo-NHS-SS-Biotin, Pierce) in ice-cold PBS containing 154 mm NaCl, 2.68 mm KCl, 4.2 mm Na2HPO4, 1.47 mm KH2PO4, pH 8.0, supplemented with 1 mm MgCl2 and 0.4 mm CaCl2. Dishes were rapidly washed with PBS and incubated for an additional 10 min with PBS supplemented with 20 mm Tris to quench the reaction. After three washes in PBS, cells were collected and solubilized in 200 μl with ice-cold lysis buffer containing 100 mm NaCl, 5 mm EDTA, 1% Triton X-100, 20 mm HEPES, pH 7.4, supplemented with a protease inhibitor mixture tablet (Roche Applied Science), and incubated for 2 h at 4 °C under vigorous agitation. Lysates were clarified by centrifugation at 14,000 rpm (4 °C) for 10 min. The total level of expression was determined by taking at this stage a 15-μl aliquot of the supernatant, mixed with 6 μl of LDS sample buffer (Invitrogen), to which 70 mm DTT was added, and stored for Western blot analysis. The remaining supernatant was mixed with 50 μl of neutravidin-agarose beads (Thermo Scientific) and incubated overnight on a rotating wheel at 4 °C. The beads were separated by centrifugation and washed three times with 500 mm NaCl lysis buffer and further washed two times with 100 mm NaCl lysis buffer. The beads were then incubated with 40 μl of LDS sample buffer, to which 70 mm DTT was added, heated to 95 °C for 10 min, and centrifuged. Protein samples were run on a 4–12% SDS-PAGE in MOPS SDS running buffer (NUPAGE®, Invitrogen) using a Novex minicell at 150 V for ∼1 h. Samples were transferred to a nitrocellulose membrane using a semidry transfer cell (Bio-Rad) at 25 V for 35 min. The nitrocellulose membrane was blocked for 30 min with TPBS (PBS supplemented with 1% nonfat dry milk, 0.5% bovine serum albumin, and 0.05% Tween 20) and incubated in the same buffer overnight at 4 °C with mouse anti-c-Myc antibody (Invitrogen) diluted at 1:2500. After three washes with TPBS, the blot was incubated with peroxidase-conjugated sheep anti-mouse antibody for 2 h (dilution 1:10,000; GE Healthcare) at room temperature and further washed three times with TPBS. Blots were developed with the ECL+ detection kit (GE Healthcare). Densitometry analysis was performed with ImageJ (1.40g) on films with data corrected by background subtraction calculated for each lane and expressed as a percentage of WT. When data were inferior to the 2σ level, it was considered that expression was reduced.
Detection of Cross-linked Subunits
The same protocol as described above was used, except that the non-cleavable form, cell-impermeant reagent Sulfo-NHS-LC-Biotin was used instead. Solubilization of cells was performed with either 50 μm, 1 mm, or 50 mm iodoacetamide (when indicated) diluted in the lysis buffer. Iodoacetamide was maintained during incubation with neutravidin-agarose beads and was also added in LDS sample buffer. Protein samples were separated by SDS-PAGE as described above, except that no DTT (when indicated) was added in the LDS sample buffer.
Data Analysis
Concentration-response relationships for ATP were constructed for each mutant receptor, and a Hill equation was fitted (IGOR PRO 5.03) to the data according to Equation 1,
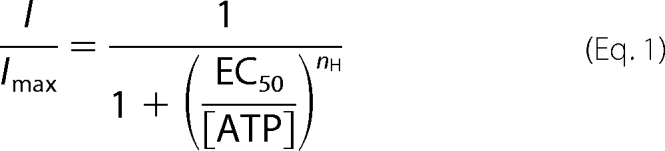 |
where I and Imax are the peak current to a given concentration of ATP and the maximum current, respectively, both normalized to the capacitance of the cell; EC50 is the concentration of ATP giving half response, [ATP] is the concentration of ATP, and nH is the Hill coefficient. The effect of the application of H2O2 alone, ATP alone, ATP plus H2O2 (as shown in Figs. 5 and 6), or DTT alone on naive cells, was calculated as (Iafter/Ibefore) × 100, where Ibefore and Iafter are currents recorded before and after treatment, respectively. The effect of reduction (as shown in Fig. 5) after H2O2 treatment was then calculated as (Iafter H2O2/DTT/Iafter H2O2) × 100, where Iafter H2O2 and Iafter H2O2/DTT are currents recorded before and after application of DTT, respectively. The decrease in ATP responses was plotted versus cumulative time of H2O2 exposure and fitted to the single-exponential decay equation,
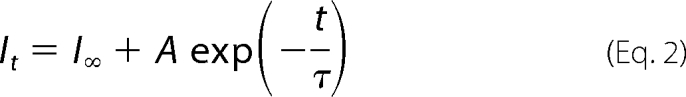 |
where I∞ and A are the residual current and maximal amplitude, respectively, t is the time in seconds, and τ is the time constant in seconds. For all experiments, data were analyzed when the variations in the current amplitudes evoked by at least two consecutive ATP applications were lower than 10%. Change in free energy (ΔΔG) for each mutant (mut) was computed according to Equation 3,
 |
where R = 1.99 cal/mol/K, T = 293 K, and EC50mut and EC50WT are the EC50 for mutant and WT P2X2, respectively. Coupling energy of the interaction between two mutants (ΔΔGINT) was computed according to the equation, ΔΔGINT = RTlnΩ, where Ω = EC50mut1/mut2EC50WT/EC50mut1EC50mut2 and where EC50mut1/mut2 is the EC50 for the double mutant. The experimental error of 2σ was calculated for two S.D. from the mean (14). Data were analyzed using one-way ANOVA, followed by a post hoc Dunnett's test for comparisons of individual mutants against control using STATVIEW 5.0. The level of significance in ATP sensitivity before and after MTS treatment was determined with the appropriate paired Student's t test. Results were considered significant for p < 0.05.
FIGURE 5.

Engineered disulfide cross-linking experiments support interaction between positions 63 and 274. A, top, a 120-s application of 0.3% H2O2 (first arrow) reduces responses evoked by 30 μm ATP in the E63C/R274C double mutant introduced in the P2X2-2T background. A subsequent 120-s application of 10 mm DTT (second arrow) on the same cell potentiates responses. Ibefore and Iafter represent responses before and after H2O2 application, respectively, and Iafter H2O2/DTT represents those after H2O2 and DTT applications. Note that Iafter H2O2/DTT is larger than Ibefore. Bottom, the same protocol applied on the P2X2-2T receptor has no effect on responses evoked by 10 μm ATP. B, average of the data using the protocol shown in A for E63C/R274C (n = 11), E63C (3 μm ATP, n = 4), R274C (3 μm, n = 6), and P2X2-2T (n = 5). The dashed lines indicate the 2σ levels for inhibition and potentiation, which correspond to ±12 and ±26%, respectively. *, values are significantly different from E63C, R274C, and P2X2-2T.
FIGURE 6.

State-dependent disulfide cross-linking of engineered cysteines in E63C/R274C mutant. A, cumulative applications of 0.3% H2O2 indicated by white bars between current traces progressively reduce responses evoked by 30 μm ATP. Reversibility is checked by a 120-s exposure of DTT applied on the same cell. For clarity, only one current trace of consecutive test pulses is shown. B, observed decrease of ATP responses plotted versus cumulative H2O2 exposure. Data obtained from 7–10 cells are normalized at t = 0 and fitted to a single exponential decay curve (see “Data Analysis”; τ = 13.0 ± 1.8 s; A = 0.50 ± 0.05; I∞ = 0.50 ± 0.05). C, top, a 20-s application of 100 μm ATP alone (green bar above current trace) barely reduces responses evoked by 30 μm ATP. Ibefore and Iafter represent responses before and after application, respectively. Bottom, in another cell, a 20-s co-application of 100 μm ATP plus 0.3% H2O2 (blue bar) does not further reduce responses evoked by 30 μm ATP. D, summary of the inhibitions induced within 20 s by 100 μm ATP alone (green bar, n = 6), 100 μm ATP plus 0.3% H2O2 (blue bar, n = 7), and 0.3% H2O2 alone (white bar, n = 9). The dashed line indicates the 2σ level, which corresponds to ±11%. *, value is significantly different from ATP and ATP plus H2O2.
Structural Modeling
The sequences were retrieved from the Ligand-Gated Ion Channel data base (15). The sequence alignment was obtained with T-coffee and edited manually (16). Model of the Rattus norvegicus P2X2 receptor was constructed by homology modeling using the structure of Danio rerio P2X4 (12) as a template (Protein Data Bank code 3H9V). Homology modeling was performed with MODELLER 9.7 (17) using default settings; 100 models were prepared, and the best model according to the DOPE energy function was selected. The figures were prepared with PyMOL (DeLano Scientific LLC).
RESULTS
Pairs of Conserved and Spatially Close Charged Residues
We aligned the sequence corresponding to the truncated crystallized form of zfP2X4 (ΔzfP2X4), in which the N and C termini were shortened for crystallization, to that of rat P2X2 (rP2X2). A high sequence identity (48%) was found, providing strong confidence that ΔzfP2X4 is a good template to produce a model by comparative modeling. The rP2X2 molecular model shows a series of extracellular charged amino acid residues that are spatially close (<10 Å between side chains; Fig. 1A) and are well conserved among the P2X family (Fig. 1B). These residues belong to five different segments (namely post-M1 loop, β8-β9 loop, β11-β12 loop, strand β12, and pre-M2 loop) separated in the primary sequence but possibly interacting with each other in the three-dimensional space of the receptor (Fig. 1B). Interestingly, these segments directly connect the putative ATP-binding site to the ion channel, and consequently we hypothesized that interactions between these residues through salt bridges could be involved in the gating process. To test this hypothesis, we disrupted these potential salt bridges by individually reversing the charges and investigated the functional effects thereof.
Effects of Charge Reversals on ATP Activation
We made 12 individual charge reversals in rP2X2R and transiently expressed the corresponding mutants in HEK-293 cells. Cell surface expression and functionality of each mutant were determined by biotinylation of plasma membrane-targeted receptors and by patch clamp electrophysiology, respectively (see “Experimental Procedures”).
In whole-cell recordings, ATP evoked robust current densities (Imax > 100 pA/picofarad) for five of the mutants comparable with those obtained from the WT P2X2R, except for K53D, E59K, K195D, and K195E, for which significant reductions of the current densities were recorded (Table 1). No response to ATP (up to 1 mm) was observed for D259K, D261K, and K324D. Cell surface labeling experiments showed normal expression for E63K, E63R, K197D, and R274E but reduced expression for the other mutants (Fig. 2A). For all mutants, however, total expression (internal plus cell surface) was not altered (Fig. 2B). Overall, cell surface labeling results correlated well with those of the current densities, suggesting that charge reversal at positions 53, 59, 195, 259, 261, and 324 affects normal receptor trafficking. An exception was found for D57K, of which normal current density was recorded, but this mutant showed little surface expression. Finally, the fact that we detected little surface expression and no ATP-evoked current for mutants D259K, D261K, and K324D prevents us from further evaluating the significance of the charge reversal at these positions upon ATP activation.
TABLE 1.
Functional properties of the investigated mutant receptors
Values represent mean ± S.E. n, number of cells; NR, no response to 1 mm ATP.
| Mutants | EC50 | nH | Imax | n | ΔΔG | Ω | ΔΔGINT |
|---|---|---|---|---|---|---|---|
| μm | pA/picofarad | kcal.mol−1 | kcal/mol | ||||
| WT P2X2 | 28.7 ± 3.2 | 1.9 ± 0.2 | 361 ± 45 | 6 | 0 | ||
| K53D | 37.0 ± 2.9 | 2.1 ± 0.3 | 7.4 ± 4.0a | 4 | 0.14 ± 0.04 | ||
| D57K | 16.9 ± 2.5a | 1.7 ± 0.05 | 168 ± 77 | 5 | −0.33 ± 0.08 | ||
| E59K | 14.8 ± 1.1a | 2.1 ± 0.1 | 8.5 ± 3.5a | 4 | −0.39 ± 0.04 | ||
| E63R | 10.8 ± 1.5a | 1.6 ± 0.1 | 277 ± 82 | 9 | −0.61 ± 0.09 | ||
| E63K | 4.0 ± 0.5a | 1.9 ± 0.1 | 240 ± 68 | 8 | −1.18 ± 0.08 | ||
| E63A | 9.9 ± 0.8a | 1.4 ± 0.1 | 39 ± 8a | 7 | −0.63 ± 0.05 | ||
| K195D | 26.0 ± 7.3 | 2.0 ± 0.05 | 42 ± 19a | 4 | −0.11 ± 0.17 | ||
| K195E | 27.9 ± 3.2 | 2.3 ± 0.1 | 95 ± 54a | 5 | −0.03 ± 0.07 | ||
| K197D | 28.8 ± 3.0 | 2.2 ± 0.4 | 278 ± 84 | 5 | −0.01 ± 0.07 | ||
| D259K | NR | 5 | |||||
| D261K | NR | 5 | |||||
| R274E | 14.0 ± 2.1a | 2.0 ± 0.1 | 246 ± 49 | 8 | −0.45 ± 0.08 | ||
| R274A | 6.3 ± 0.8a | 1.8 ± 0.2 | 189 ± 77 | 6 | −0.91 ± 0.08 | ||
| K324D | NR | 5 | |||||
| K53D/D259K | NR | 4 | |||||
| K53D/D261K | NR | 4 | |||||
| D57K/K195D | 48.9 ± 4.0a | 1.9 ± 0.2 | 143 ± 65 | 6 | 0.30 ± 0.05 | 3.2 ± 0.3 | 0.67 ± 0.05b |
| D57K/R274E | 12.6 ± 1.7a | 0.9 ± 0.1a | 7.0 ± 4.0a | 4 | −0.49 ± 0.08 | 1.5 ± 0.2 | 0.24 ± 0.08 |
| D57K/K324D | NR | 4 | |||||
| E59K/K195E | 35.6 ± 4.4 | 2.4 ± 0.2 | 115 ± 34a | 7 | 0.10 ± 0.08 | 2.5 ± 0.3 | 0.50 ± 0.08b |
| E63R/R274E | 19.8 ± 0.9 | 1.7 ± 0.2 | 284 ± 63 | 6 | −0.22 ± 0.03 | 3.7 ± 0.2 | 0.77 ± 0.03b |
| E63K/R274E | 30.3 ± 4.9 | 1.6 ± 0.1 | 327 ± 133 | 5 | 0.01 ± 0.1 | 15.6 ± 2.5 | 1.58 ± 0.10b |
| E63A/R274A | 13.4 ± 1.3a | 1.4 ± 0.1 | 191 ± 46 | 8 | −0.46 ± 0.05 | 6.2 ± 0.6 | 1.05 ± 0.05b |
| D259K/K324D | NR | 4 | |||||
| D261K/K324D | NR | 4 |
a Values are significantly different from WT P2X2, p < 0.05 (one-way ANOVA).
b Values are significantly different from D57K/R274E, p < 0.05 (one-way ANOVA).
FIGURE 2.

Cell surface and total expression of charge reversal and charge swap mutants expressed in HEK-293 cells. A, top, Western blot analysis probed with anti-c-Myc antibody of biotinylated WT and mutant P2X2 receptors, which represent cell surface-targeted receptors. Bottom, summary of the cell surface expression data. The dashed line indicates the level of 2σ error, which corresponds to ±18%. B, top, corresponding Western blot of total expression probed with anti-c-Myc antibody. Bottom, summary of the total expression data. Data are from 3–7 independent transfections. The dashed line indicates the level of 2σ error, which corresponds to ±35%. For both A and B, SDS-polyacrylamide gels were run in the presence of DTT. Also indicated is the position of the apparent molecular mass marker (in kDa). WT P2X2 expression was set to 100%.
Dose-response curves were constructed for functional mutants, and the effective concentration of ATP giving half-response (EC50) as well as the Hill coefficient (nH) were determined (Table 1). For the WT P2X2R, these parameters were in the same range as previously reported (18) (Fig. 3B). ATP EC50 and nH values for all functional mutants were not significantly different from that of the WT P2X2R, except for D57K, E59K, E63R, E63K, and R274E mutants, for which significantly lower EC50 values were recorded (Table 1). The concentration-response curves were accordingly shifted left (see Fig. 3B for E63K and R274E). These data indicate that charge reversal at amino acid residues located in the post-M1 loop and strand β12 on P2X2R produces an increase of ATP sensitivity resulting in gain-of-function phenotypes.
FIGURE 3.

Charge exchange between positions 63 and 274 restores WT-like ATP sensitivity. A, representative recordings from HEK-293 cells transfected with WT, E63K, R274E, and E63K/R274E P2X2 receptors. The bars above the recordings indicate the interval of ATP application. Also indicated are the ATP concentrations. B, concentration-response curves for WT P2X2 (○), E63K (▵), R274E (▿), and E63K/R274E (■). C, mutant cycle analysis showing strong coupling between Glu63 and Arg274. D, histogram showing the calculated coupling energy (ΔΔGINT) for the indicated pairs, E63R/R274E, E63K/R274E, D57K/R274E, and E63A/R274A. The dashed line indicates the experimental error (2σ), which corresponds to ±0.13 kcal/mol. *, values are significantly different from D57K/R274E. Data points and error bars in this and all other figures represent mean ± S.E.
Charge Swap of Glu63 and Arg274 Restores WT-like ATP Sensitivity
We next tested the effect of the swap of the charges on ATP sensitivity. We considered that if acidic and basic residues were interacting in the WT P2X2R, then this exchange of charges might restore WT-like function. First, we selected only the positions that resulted in significant modifications of the ATP EC50 (Asp57, Glu59, Glu63, and Arg274). The mutants displaying no ATP response and showing dramatic effects on cell surface expression were also included (Asp259, Asp261, and Lys324). Second, we restricted the number of all possible charge swap combinations by selecting oppositely charged side chains that are separated by less than 10 Å in our rP2X2R model (Table 2). By combining these two criteria, we produced the following double mutants: K53D/D259K, K53D/D261K, D57K/K195D, D57K/K324D, E59K/K195E, E63K/R274E, E63R/R274E, D259K/K324D, and D261K/K324D.
TABLE 2.
Proximity of the investigated charged residues predicted from the model of rP2X2 receptor
| Residues | Close toa | Location of the interaction |
|---|---|---|
| Lys53 | Asp259 and Asp261 | Intrasubunit |
| Asp57 | Lys195 and Lys324 | Intrasubunit |
| Glu59 | Lys195 | Intrasubunit |
| Glu63 | Arg274 | Intersubunit |
| Lys195 | Asp57 and Glu59 | Intrasubunit |
| Lys197 | None | |
| Asp259 | Lys53 and Lys324 | Intrasubunit |
| Asp261 | Lys53 and Lys324 | Intrasubunit |
| Arg274 | Glu63 | Intersubunit |
| Lys324 | Asp57, and Asp259, and Asp261 | Intrasubunit |
a Oppositely charged side chains separated by less than 10 Å.
Charge swapping for K53D/D259K, K53D/D261K, D57K/K324D, D259K/K324D, and D261K/K324D did not restore either ATP function or cell surface expression (Fig. 2A and Table 1). However, the double mutants D57K/K195D and E59K/K195E were functional and displayed higher EC50 values than those of gain-of-function mutants D57K and E59K (Table 1), suggesting that Asp57 and Glu59 might interact with Lys195.
Remarkably, when the charges were swapped between Glu63 and Arg274, the receptor responded to ATP in a concentration-dependent manner that was very similar to that of the WT P2X2R (Fig. 3A). ATP EC50 values for the double mutants E63K/R274E and E63R/R274E were very similar to that of the WT (Fig. 3B and Table 1), indicating that charge swap completely restored WT-like ATP function. This suggests that Glu63 and Arg274 are spatially close to each other and functionally coupled to contribute to the ATP activation.
Non-additive Effects of Salt Bridge Mutations
Mutant cycle analysis is routinely used to compute the coupling energy between amino acid residues intimately involved in protein-protein interactions on the basis of the free energy change associated with a perturbation (here a mutation) (14) and was previously used to investigate other ligand-gated ion channels (19). If the effects of the mutations are independent, the change in free energy (ΔΔG) for the double mutant is expected to be the sum of those for the two single mutations, whereas if the mutated residues are energetically coupled, then the change in free energy for the double mutant differs from the sum of the two single mutants. We adopted this concept to investigate the significance of the intermolecular interactions between the charged residues. Coupling energy (ΔΔGINT) turned out to be small but significant for the pairs D57K/K195D and E59K/K195E, confirming that interactions are present, but the consequence on ATP function is relatively weak (Table 1). By contrast, a significantly higher value of ΔΔGINT was computed for E63K/R274E, although less for E63R/R274E (Fig. 3, C and D, and Table 1), suggesting a strong interaction between Glu63 and Arg274. As a control, we compared these values with that obtained with D57K/R274E, an additional double mutant in which the distance between the side chains of Asp57 and Arg274 was predicted from the model to be longer than 10 Å (Fig. 1A). As expected, ΔΔGINT value for this double mutant was not significant, close to the experimental error (Fig. 3D and Table 1), indicating that the interaction observed between Glu63 and Arg274 is specific for this pair.
It has been previously reported that analysis of double mutant cycles is most reliable for alanine mutations because interactions are mostly abolished without new interactions being formed (20). We thus neutralized Glu63 and Arg274 independently and in combination by introducing alanine mutations. The single mutations E63A and R274A increased ATP sensitivity compared with that of the WT, and, as expected for interacting residues, the ΔΔG for the double mutant E63A/R274A was not the additive sum of the ΔΔG calculated from the single mutants (Table 1), and a significant ΔΔGINT value was computed (Fig. 3D). These data thus confirmed that Glu63 and Arg274 are energetically coupled. Notably, the double alanine mutant did not restore WT-like EC50 as successfully as did charge swapping mutants, suggesting that the electrostatic interaction between Glu63 and Arg274 is necessary for normal receptor gating.
Cysteine Substitutions and Modifications with Charged MTS Reagents
To confirm the electrostatic nature of the interaction between Glu63 and Arg274 residues, we examined the effects of inserting in real-time positive and negative charges brought by sulfhydryl-reactive reagents at these positions substituted by cysteine residues. As detailed in the supplemental material, single cysteine mutants were introduced in the double mutant C348T/C430T (here called P2X2-2T; supplemental Fig. S1). ATP robustly activated the P2X2-2T with an EC50 value that was similar to that of the WT P2X2R (Tables 1 and 3), in line with a previously published work (21) reporting that the triple mutant P2X2-3T (C9T/C348T/C430T) remained functional. Both single mutants E63C and R274C were functional, and cell surface expression appeared normal for E63C. However, similar to the D57K mutant, surface expression was very low for R274C (total expression appeared normal; see supplemental Fig. S2), but current density was not significantly different from that of P2X2-2T (Table 3).
TABLE 3.
Functional properties of the cysteine mutant receptors
Values represent mean ± S.E. n, number of cells.
| Mutants | EC50 | nH | Imax | n |
|---|---|---|---|---|
| μm | pA/picofarad | |||
| P2X2-2T | 21.7 ± 1.5 | 2.1 ± 0.2 | 323 ± 68 | 13 |
| P2X2-2T after MTSES | 24.2 ± 3.5 | 1.7 ± 0.1 | 285 ± 56 | 4 |
| P2X2-2T after MTSET | 22.5 ± 3.7 | 2.3 ± 0.8 | 304 ± 183 | 4 |
| E63C | 5.3 ± 0.5a | 1.5 ± 0.1a | 181 ± 39a | 16 |
| E63C after MTSES | 27.4 ± 2.6b | 1.3 ± 0.1b | 297 ± 75 | 7 |
| R274C | 5.6 ± 0.7a | 2.2 ± 0.3 | 197 ± 32 | 11 |
| R274C after MTSET | 24.4 ± 4.1b | 1.3 ± 0.1b | 155 ± 40b | 4 |
| E63C/R274C | 17.6 ± 1.9a,c | 1.0 ± 0.1a,c | 42 ± 8a,c | 11 |
a Values (those obtained after MTS treatment were not included) are significantly different from P2X2-2T, p < 0.05 (one-way ANOVA).
b Values after MTS compound treatment are significantly different from those obtained before treatment, p < 0.05 (paired Student's t test).
c Values for E63C/R274C are significantly different from E63C and R274C, p < 0.05 (one-way ANOVA).
We then examined the effects of modifying E63C with the negatively charged sulfhydryl-reactive reagent MTSES. MTSES applied alone on cells expressing the mutant for 60 s modified the ATP concentration-response curve (Fig. 4, B and D) when compared with that obtained before treatment (Table 3), resulting in a significant increase of the ATP EC50 value and slight decrease of nH with no significant change of Imax, whereas the same treatment had no significant effect on P2X2-2T-expressing cells (Fig. 4, A and D). Interestingly, the ATP EC50 value after MTSES application on cells expressing E63C was indistinguishable from that of WT (Table 3), suggesting that the negatively charged tethered sulfonate moiety accommodates well to the glutamate side chain cavity.
FIGURE 4.

Modifications of single mutants with charged MTS reagents restore electrostatic interaction. A, a 1-min application of 1 mm MTSES (indicated by an arrow) does not change responses evoked by different concentrations of ATP (indicated below recordings) on P2X2-2T. B, the same protocol as described in A changes responses in E63C single mutant introduced in the P2X2-2T background. C, the same protocol as described in A changes responses in R274C single mutant introduced in the P2X2-2T background except that MTSET is used instead. D, summary of the data (from n = 4–7 cells) obtained for E63C mutant (▿) and P2X2-2T (□) before (solid curves) and after MTSES treatment (dashed curves) for E63C (▾) and P2X2-2T (■). E, summary of the data (from n = 4 cells) obtained for R274C (▿) and P2X2-2T (□) before (solid curves) and after MTSET treatment (dashed curves) for R274C (▾) and P2X2-2T (■). For each cell, data were normalized to currents evoked by 300 μm ATP before and after MTS modification.
We applied the same protocol to cells expressing R274C, except that the positively charged MTSET reagent was used instead. MTSET did not significantly change the ATP concentration-response curve of P2X2-2T when compared with that before treatment (Fig. 4E and Table 3). However, a significant rightward shift of the concentration-response curve was observed for R274C with a slight decrease of Imax and larger decrease of nH (Fig. 4, C and E, and Table 3), suggesting that the trimethylammonium group was covalently attached to the cysteine. Overall, these results might indicate that MTSES and MTSET interacted respectively with the positively and negatively charged residues Arg274 and Glu63 to restore an electrostatic interaction.
Disulfide Bond Forms between E63C and R274C
The coupling energy observed for charge swapping between Glu63 and Arg274 suggested that the charged residues are separated by 5 Å or less (14). We thus carried out cysteine cross-linking experiments to confirm the spatial proximity between these residues by introducing in combination E63C and R274C in the P2X2-2T background. This background is appropriate for studying disulfide bond formation induced by the oxidizing reagent hydrogen peroxide (H2O2) because a recent work has shown that mutating Cys430 to alanine produced a receptor that was insensitive to H2O2 (22). The double mutant E63C/R274C was functional but showed very weak cell surface expression (supplemental Fig. S2), preventing, as for single cysteine mutants, the monitoring of disulfide bond formation on Western blot. However, the double mutant displayed sufficient currents, although the Imax value was significantly reduced (Table 3), for monitoring possible redox-dependent modifications by patch clamp electrophysiology. The ATP EC50 value for E63C/R274C lies significantly in between those of single cysteine mutants and P2X2-2T (Table 3). In addition, the Hill coefficient value significantly fell to unity when compared with that of P2X2-2T (Table 3).
We directly probed the extent of spontaneous cross-linking by measuring the effect of H2O2 on currents evoked by three repeated applications of ATP spaced by 10–30 s at a low concentration of ATP (∼EC20–40) for the single cysteine mutants and P2X2-2T and at a higher concentration for E63C/R274C (∼EC70) because of low current density (Table 3) and then by recording on the same cell the effect of the reducing reagent DTT, known to reduce specifically disulfide bonds. H2O2 (0.3%, 120 s) and DTT (10 mm, 120 s) had no significant effect on ATP-evoked currents from P2X2-2T and single cysteine mutants (Fig. 5, A and B). However, H2O2 significantly reduced ATP-evoked currents for the double mutant receptor E63C/R274C, and subsequent application of DTT significantly potentiated currents (Fig. 5, A and B), providing strong evidence that a disulfide bond is formed between E63C and R274C. Interestingly, the amplitude of the potentiated current after subsequent applications of H2O2 and DTT was larger than that of initial current (compare Iafter H2O2/DTT and Ibefore in Fig. 5A), suggesting that some disulfide bonds were spontaneously formed. This was further confirmed by the fact that potentiation (224 ± 66%, n = 7) of the current was observed after application of DTT to naive cells. Following reduction by DTT, currents progressively returned within 2–5 min to initial current Ibefore (data not shown). Overall, these results (i) demonstrate that E63C and R274C are relatively proximal in the closed state of the receptor, (ii) show that disulfide bond formation affects ATP activation of the receptor, and (iii) probably indicate the existence of two different populations of channels in cells expressing E63C/R274C, one with spontaneous cross-linked cysteines and a second with reduced cysteine.
Presence of ATP Reduces the Rate of Engineered Disulfide Bond Formation
We next determined whether H2O2 could promote disulfide bond formation between E63C and R274C in the presence of ATP. To achieve this goal, we would have to apply H2O2 plus ATP for 120 s, because so far we had applied H2O2 for 120 s (Fig. 5). Because sustained ATP application potentially induces strong desensitization and/or run down of the currents, we decided to determine first if shorter applications of H2O2 alone still sufficiently reduce ATP-evoked currents. We thus performed a kinetic analysis of inhibition by H2O2 alone on cells expressing E63C/R274C by recording at least two consecutive 30 μm ATP-evoked test responses separated by a 10–60-s application of 0.3% H2O2 (Fig. 6, A and B). We found that the rate of H2O2-induced inhibition was fast (τ = 13.0 ± 1.8 s) and that the inhibition level reached a plateau that corresponded to 50% of the initial ATP-evoked currents (Fig. 6B). We thus decided to use a 20-s co-application of 0.3% H2O2 plus 100 μm ATP. We chose 100 μm ATP for co-application because this concentration is known to be the maximal dose evoking the highest open channel probability (23). Co-application of ATP plus H2O2 did not significantly reduce subsequent ATP responses (Fig. 6C, bottom) when compared with currents recorded after application of ATP alone for 20 s (Fig. 6C, top), contrasting with the significant inhibition recorded after application of H2O2 alone (Fig. 6D). These results strongly suggest that in the presence of ATP, no substantial disulfide bond formation induced by H2O2 occurred within 20 s.
DISCUSSION
Using a charge reversal scanning approach, followed by charge swapping and chemical modification of cysteine-substituted mutants, we have identified a critical intersubunit salt bridge formed between Glu63 and Arg274 in P2X2R that contributes to the ion channel function of the receptor. Engineered disulfide bond trapping experiments further confirmed the close proximity of the residues substituted by cysteines. We found that oxidation with H2O2 decreased ATP-evoked currents in the E63C/R274C double mutant, whereas reduction with DTT potentiated currents, showing that disulfide bond formation affects activation by ATP. In proteins of known crystal structure, the average separation between disulfide-bonded cysteine α-carbons is 5.6 Å (24). To form a disulfide bond, cysteines must approach this distance for a productive sulfhydryl collision; however, geometrical factors, including the average distance separating the two cysteines, the relative side chain orientations, and dynamic factors, such as thermal mobility, might affect sulfhydryl collision frequency and consequently disulfide bond formation. It has been shown in the d-galactose chemosensory receptor (25) that when a cysteine pair exceeds the distance between the sulfhydryl collision spheres, a minimum translational motion, ranging from 4.5 to 15.2 Å, is required for a productive sulfhydryl collision. We observed that only a fraction of disulfide bonds was spontaneously formed and that H2O2 increased rates of disulfide bond formation in the absence of ATP, suggesting that the separation between α-carbons of residues 63 and 274 must exceed 5.6 Å in the closed state of the receptor. This is in line with the atomic model of rP2X2R built on the recent crystal structure of zfP2X4R, which shows an average distance of ∼10 Å between the α-carbons (Fig. 7B). This implies that there are some thermal fluctuations of the protein backbone in the apo form of the receptor, at least at this subunit interface region.
FIGURE 7.

Glu63 and Arg274 form a salt bridge in a rat P2X2R molecular model. A, location of the identified residues viewed laterally. The upper part (top) and bottom (base) of the β-sandwich, along with the TM domain, are indicated. The star marks one of the three fenestrations between subunits. Also indicated are the residues previously shown to be important for ATP action (Lys69, Lys71, and Lys308) and ion permeation (Thr336, Thr339, and Ser340), the β-strand numbers, and one of the three TM2s. Also shown is the distance between the investigated region and the putative ATP-binding site. B, slab view of the bottom part of the ectodomain from the extracellular side (indicated by a dashed bar in A), along the ion pore axis, showing the pair of interacting residues at the subunit interface. Also shown is the distance between the α-carbons. Each subunit is depicted in a different color. C, close-up view of the salt bridge formed between the negatively charged Glu63 residue from one subunit (shown in yellow) and the positively charged Arg274 residue from another (blue).
Side chains of Glu63 and Arg274, which are larger than those of cysteines, are in close contact according to our molecular model (average of ∼3.6 Å from the three interfaces), suggesting a possible electrostatic interaction between these residues, such as a salt bridge (Fig. 7B). Our results show that mutations disrupting this interaction produce gain-of-function phenotypes. Two possible mechanisms can account for these data. First, this interaction might contribute directly to the ATP binding affinity, and one may envision that disrupting the salt bridge could remodel the shape and/or the electrostatic potential of the ATP-binding pocket in such a way that ATP binds with a higher affinity to its site. A second hypothesis is that the electrostatic interaction is located far away from the ATP-binding site and contributes to the gating equilibrium between the closed and open states. Although the two mechanisms remain possible, we favor the second one for the following reason. In light of the recent crystal structure of zfP2X4 (12) and of our homology model, compelling evidence has shown that residues important for ATP binding (26–30) are positioned close to each other, in a deep intersubunit pocket, located more than 20 Å from the investigated area (Fig. 7A). New crystal structures in the presence of ATP are now needed to definitively localize the ATP-binding pocket.
For some mutants (namely D57K and R274C) we found that current densities were not significantly different from those of their respective controls, but cell surface expression of these mutants was very low. The reason for this unusual observation is not clear, but one possibility might be related to a compensatory mechanism that involves the open probability (Po) of the WT P2X2 ion channel. At a saturating concentration of ATP, this value was found to be lower than unity (0.6) as determined by single channel analysis in HEK-293 cells (23). This means that ATP does not gate all the time the ion channel and consequently behaves as a low efficacy agonist on the WT P2X2 receptor. This also means that Po can theoretically be increased. As discussed earlier (31), increasing Po should decrease the value of EC50 for agonists, by increasing the gating equilibrium constant (defined as opening rate constant/shutting rate constant). We found indeed that the ATP EC50 values for R274C and D57K were significantly lower than that of their respective controls (Tables 1 and 3). Although further experiments, such as single channel analysis, may shed light on this mechanism, these data suggest, but do not prove, that the mutation increases the open probability of the ion channel Po. This in turn might increase current densities, and the resulting compensating effect would be that although surface expression is low, Imax would remain unchanged.
In the crystal structure of zfP2X4R, which probably represents the closed state of the ion channel (12), Arg280 (homologous to Arg274 in rP2X2) interacts with the adjacent subunit yet through another residue located on strand β9, Asn204 (supplemental Fig. S3). Interestingly, Arg274 is conserved only in subtypes that display low ATP sensitivity (P2X2, P2X4, and P2X7), whereas in subtypes showing higher ATP sensitivity (P2X1 and P2X3), smaller residues, not prone to contact the adjacent subunit, are found (Fig. 1B). Regardless of the mechanism by which the difference in ATP sensitivity occurs (an effect on ATP binding affinity or gating), an attractive hypothesis would be that the absence of the arginine in P2X1R and P2X3R influence at least partially ATP sensitivities. Although this point deserves to be addressed for P2X1 and P2X3, a recent work has shown that mutating Arg276 in murine P2X7 (corresponding to Arg274 in rP2X2) into alanine also resulted in a gain-of-function phenotype (32). Finally, a natural polymorphism exists for this residue in human P2X7, although its phenotype is still undefined (33), emphasizing this region as a potential target for allosteric regulation of human P2XR.
We found that the presence of ATP reduces the rate of disulfide bond formation. Two mechanisms are possible. First, ATP binding directly prevents disulfide bond formation through steric hindrance; second, the ATP-binding site and the action site of H2O2 are topologically distinct, but interact with each other through an allosteric cross-talk. Although we cannot firmly rule out the first possibility because the structure of zfP2X4 was solved in the absence of ATP, we favor the second possibility for the reason discussed above. We propose that disulfide bond formation is unfavorable during activation because the separation and/or orientation between the engineered cysteines are different from those in the absence of ATP (i.e. closed state). This suggests that in the WT receptor Glu63 and Arg274 move away from each other during gating. At present, we cannot determine which state is stabilized or destabilized by the salt bridge, but the fact that the rate of disulfide bond formation is reduced in the presence of ATP along with the fact that charge reversals produce gain-of-function phenotypes indicate that the putative salt bridge stabilizes the closed rather than the open state of the receptor. Additional experiments, such as a single channel analysis, will be needed to clarify this hypothesis.
Our results show that allosteric motions of adjacent subunits at the level of Glu63 and Arg274 occur as a key part of the gating process of P2X2R. Other groups have previously highlighted other critical interfacial regions of the receptor: the upper part of the TM domain (34), the putative ATP-binding site (35, 36), and the allosteric zinc-binding site (37). In addition, a very recent report has shown that the opening of the ion channel involves anticlockwise rotation and separation of TM2 (38), providing evidence that α-helices framing the ion channel pore are submitted to structural reorganization during gating. It thus appears that the subunit-subunit interface is critical for the gating process in P2XR. In light of the zfP2X4 crystal structure, a molecular mechanism, previously anticipated (12), can now be extended; ATP binding at the subunit interface, close to residues shown beforehand to be important for ATP binding (e.g. Lys69, Lys71, and Lys308) causes rearrangements of the extensive subunit-subunit contacts, in particular those located at the upper region of each β-sandwich body (top domain in Fig. 7A). This in turn triggers movement of one rigid β-sandwich relative to another, allowing the base of the extracellular body domain, directly connected to the upper region of the TM domain through post-M1 and pre-M2 loops, to change the conformation of the transmembrane helices (Fig. 7A). This conformational change ultimately causes the helices to move to an open conformation, enabling residues identified as part of the ion selective pore (39, 40) (Thr336, Thr339, and Ser340) to face the ion-conducting pathway. The putative salt bridge identified here is located at an ideal interfacial position. Coming from the TM domain, it is the first extracellular interaction of the base domain that contacts two adjacent subunits through strand β1 of one β-sandwich and strand β12 of another. Moreover, the salt bridge is located just above fenestrations, large openings between subunits thought to represent one of the access routes for ions (12) (Fig. 7A). Thus, the presence of this putative electrostatic interaction at this special location might represent a powerful means for influencing conformational changes between subunits involved in gating motions of P2X2R.
Supplementary Material
Acknowledgments
We thank Prof. M. Goeldner and Drs. A. Specht and S. O'Regan for critical reading of the manuscript. We are grateful to Drs. F. Rassendren and P. Séguéla for generously providing the P2X plasmids.
This work was supported by Agence National de la Recherche Grant 06-0050-01 and CNRS (Programme d'Incitation à la Mobilité).

The on-line version of this article (available at http://www.jbc.org) contains supplemental Figs. S1–S3.
- P2XR
- P2X receptor (ATP-gated purinergic receptor)
- DTT
- dithiothreitol
- HEK-293
- human embryonic kidney
- MTSES
- sodium (2-sulfonatoethyl)methanethiosulfonate
- MTSET
- [2-(trimethylammonium)ethyl]methanethiosulfonate bromide
- WT
- wild type
- zfP2X4 and zfP2X4R
- zebrafish P2X4 and P2X4R, respectively
- rP2X2 and rP2X2R
- rat P2X2 and P2X2R, respectively
- PBS
- phosphate-buffered saline
- MOPS
- 4-morpholinepropanesulfonic acid
- ANOVA
- analysis of variance
- TM
- transmembrane
- MTS
- methanethiosulfonate.
REFERENCES
- 1.Surprenant A., North R. A. (2009) Annu. Rev. Physiol. 71, 333–359 [DOI] [PubMed] [Google Scholar]
- 2.Evans R. J., Derkach V., Surprenant A. (1992) Nature 357, 503–505 [DOI] [PubMed] [Google Scholar]
- 3.Khakh B. S., Gittermann D., Cockayne D. A., Jones A. (2003) J. Neurosci. 23, 7426–7437 [DOI] [PMC free article] [PubMed] [Google Scholar]
- 4.Bo X., Alavi A., Xiang Z., Oglesby I., Ford A., Burnstock G. (1999) Neuroreport 10, 1107–1111 [DOI] [PubMed] [Google Scholar]
- 5.Finger T. E., Danilova V., Barrows J., Bartel D. L., Vigers A. J., Stone L., Hellekant G., Kinnamon S. C. (2005) Science 310, 1495–1499 [DOI] [PubMed] [Google Scholar]
- 6.Cockayne D. A., Dunn P. M., Zhong Y., Rong W., Hamilton S. G., Knight G. E., Ruan H. Z., Ma B., Yip P., Nunn P., McMahon S. B., Burnstock G., Ford A. P. (2005) J. Physiol. 567, 621–639 [DOI] [PMC free article] [PubMed] [Google Scholar]
- 7.Jarvis M. F. (2010) Trends Neurosci. 33, 48–57 [DOI] [PubMed] [Google Scholar]
- 8.Ren J., Bian X., DeVries M., Schnegelsberg B., Cockayne D. A., Ford A. P., Galligan J. J. (2003) J. Physiol. 552, 809–821 [DOI] [PMC free article] [PubMed] [Google Scholar]
- 9.Khakh B. S., North R. A. (2006) Nature 442, 527–532 [DOI] [PubMed] [Google Scholar]
- 10.Vial C., Roberts J. A., Evans R. J. (2004) Trends Pharmacol. Sci. 25, 487–493 [DOI] [PubMed] [Google Scholar]
- 11.Fisher J. A., Girdler G., Khakh B. S. (2004) J. Neurosci. 24, 10475–10487 [DOI] [PMC free article] [PubMed] [Google Scholar]
- 12.Kawate T., Michel J. C., Birdsong W. T., Gouaux E. (2009) Nature 460, 592–598 [DOI] [PMC free article] [PubMed] [Google Scholar]
- 13.Young M. T. (2010) Trends Biochem. Sci. 35, 83–90 [DOI] [PMC free article] [PubMed] [Google Scholar]
- 14.Schreiber G., Fersht A. R. (1995) J. Mol. Biol. 248, 478–486 [DOI] [PubMed] [Google Scholar]
- 15.Le Novère N., Changeux J. P. (1999) Nucleic Acids Res. 27, 340–342 [DOI] [PMC free article] [PubMed] [Google Scholar]
- 16.Notredame C., Higgins D. G., Heringa J. (2000) J. Mol. Biol. 302, 205–217 [DOI] [PubMed] [Google Scholar]
- 17.Sali A., Blundell T. L. (1993) J. Mol. Biol. 234, 779–815 [DOI] [PubMed] [Google Scholar]
- 18.Rassendren F., Buell G., Newbolt A., North R. A., Surprenant A. (1997) EMBO J. 16, 3446–3454 [DOI] [PMC free article] [PubMed] [Google Scholar]
- 19.Kash T. L., Jenkins A., Kelley J. C., Trudell J. R., Harrison N. L. (2003) Nature 421, 272–275 [DOI] [PubMed] [Google Scholar]
- 20.Faiman G. A., Horovitz A. (1996) Protein Eng. 9, 315–316 [DOI] [PubMed] [Google Scholar]
- 21.Li M., Chang T. H., Silberberg S. D., Swartz K. J. (2008) Nat. Neurosci. 11, 883–887 [DOI] [PMC free article] [PubMed] [Google Scholar]
- 22.Coddou C., Codocedo J. F., Li S., Lillo J. G., Acuña-Castillo C., Bull P., Stojilkovic S. S., Huidobro-Toro J. P. (2009) J. Neurosci. 29, 12284–12291 [DOI] [PMC free article] [PubMed] [Google Scholar]
- 23.Ding S., Sachs F. (1999) J. Gen. Physiol. 113, 695–720 [DOI] [PMC free article] [PubMed] [Google Scholar]
- 24.Thornton J. M. (1981) J. Mol. Biol. 151, 261–287 [DOI] [PubMed] [Google Scholar]
- 25.Careaga C. L., Falke J. J. (1992) J. Mol. Biol. 226, 1219–1235 [DOI] [PMC free article] [PubMed] [Google Scholar]
- 26.Jiang L. H., Rassendren F., Surprenant A., North R. A. (2000) J. Biol. Chem. 275, 34190–34196 [DOI] [PubMed] [Google Scholar]
- 27.Roberts J. A., Evans R. J. (2004) J. Biol. Chem. 279, 9043–9055 [DOI] [PubMed] [Google Scholar]
- 28.Roberts J. A., Evans R. J. (2007) J. Neurosci. 27, 4072–4082 [DOI] [PMC free article] [PubMed] [Google Scholar]
- 29.Roberts J. A., Digby H. R., Kara M., El Ajouz S., Sutcliffe M. J., Evans R. J. (2008) J. Biol. Chem. 283, 20126–20136 [DOI] [PMC free article] [PubMed] [Google Scholar]
- 30.Evans R. J. (2009) Eur. Biophys. J. 38, 319–327 [DOI] [PubMed] [Google Scholar]
- 31.Colquhoun D. (1998) Br. J. Pharmacol. 125, 924–947 [DOI] [PMC free article] [PubMed] [Google Scholar]
- 32.Adriouch S., Scheuplein F., Bähring R., Seman M., Boyer O., Koch-Nolte F., Haag F. (2009) Purinergic Signal. 5, 151–161 [DOI] [PMC free article] [PubMed] [Google Scholar]
- 33.Shemon A. N., Sluyter R., Fernando S. L., Clarke A. L., Dao-Ung L. P., Skarratt K. K., Saunders B. M., Tan K. S., Gu B. J., Fuller S. J., Britton W. J., Petrou S., Wiley J. S. (2006) J. Biol. Chem. 281, 2079–2086 [DOI] [PubMed] [Google Scholar]
- 34.Jiang L. H., Kim M., Spelta V., Bo X., Surprenant A., North R. A. (2003) J. Neurosci. 23, 8903–8910 [DOI] [PMC free article] [PubMed] [Google Scholar]
- 35.Marquez-Klaka B., Rettinger J., Bhargava Y., Eisele T., Nicke A. (2007) J. Neurosci. 27, 1456–1466 [DOI] [PMC free article] [PubMed] [Google Scholar]
- 36.Marquez-Klaka B., Rettinger J., Nicke A. (2009) Eur. Biophys. J. 38, 329–338 [DOI] [PubMed] [Google Scholar]
- 37.Nagaya N., Tittle R. K., Saar N., Dellal S. S., Hume R. I. (2005) J. Biol. Chem. 280, 25982–25993 [DOI] [PMC free article] [PubMed] [Google Scholar]
- 38.Cao L., Broomhead H. E., Young M. T., North R. A. (2009) J. Neurosci. 29, 14257–14264 [DOI] [PMC free article] [PubMed] [Google Scholar]
- 39.Migita K., Haines W. R., Voigt M. M., Egan T. M. (2001) J. Biol. Chem. 276, 30934–30941 [DOI] [PubMed] [Google Scholar]
- 40.Egan T. M., Khakh B. S. (2004) J. Neurosci. 24, 3413–3420 [DOI] [PMC free article] [PubMed] [Google Scholar]
Associated Data
This section collects any data citations, data availability statements, or supplementary materials included in this article.