

Abstract
Acid-sensing ion channels (ASICs) are key receptors for extracellular protons. These neuronal nonvoltage-gated Na+ channels are involved in learning, the expression of fear, neurodegeneration after ischemia, and pain sensation. We have applied a systematic approach to identify potential pH sensors in ASIC1a and to elucidate the mechanisms by which pH variations govern ASIC gating. We first calculated the pKa value of all extracellular His, Glu, and Asp residues using a Poisson-Boltzmann continuum approach, based on the ASIC three-dimensional structure, to identify candidate pH-sensing residues. The role of these residues was then assessed by site-directed mutagenesis and chemical modification, combined with functional analysis. The localization of putative pH-sensing residues suggests that pH changes control ASIC gating by protonation/deprotonation of many residues per subunit in different channel domains. Analysis of the function of residues in the palm domain close to the central vertical axis of the channel allowed for prediction of conformational changes of this region during gating. Our study provides a basis for the intrinsic ASIC pH dependence and describes an approach that can also be applied to the investigation of the mechanisms of the pH dependence of other proteins.
Keywords: Acid-sensing Ion Channels (ASIC), Ion Channels, Protein Conformation, Sodium Channels, Xenopus, Poisson-Boltzmann, Xenopus laevis Oocytes, pKa Calculation, Site-directed Mutagenesis
Introduction
Acid-sensing ion channels (ASICs)3 are neuronal nonvoltage-gated Na+ channels that are activated by a rapid drop in extracellular pH (1, 2). They are members of the epithelial Na+ channel/Degenerin family of ion channel proteins (3). Expression in nociceptive neurons and activation by protons suggest that ASICs may act as pain receptors (4), and evidence for such a role has been provided in several animal pain models (5–7). ASIC1a in the central nervous system plays a role in memory formation and the expression of fear (8, 9). ASIC1a is also an important mediator of cell injury induced by conditions associated with acidosis in the mammalian nervous system (10). Functional ASICs are formed by homo- or heterotrimeric assembly of ASIC subunits 1a, 1b, 2a, 2b, and 3. Each subunit has short intracellular N and C termini and two transmembrane domains that are separated by a large extracellular domain.
Extracellular acidification opens ASICs. The ASIC activity is terminated in the continued presence of the acidic stimulus within hundreds of milliseconds to seconds by open channel inactivation, which is also called desensitization (11). Only in some ASIC isoforms and under certain pH conditions can acidification induce a sustained current, which has in most cases a much smaller amplitude than the peak current (12–14). At pH values slightly below the physiological pH, ASICs inactivate without apparent channel opening in a process that is called steady-state inactivation (SSIN) (15). By these two ways ASICs enter the inactivated state, which is a nonconducting, absorbing state. Experimental protocols have been applied to determine the kinetics of the recovery from the inactivated state, showing that channels need exposure for a certain duration to a sufficiently alkaline pH (e.g. >pH 7.2 for ASIC1a) to be able to conduct current again upon extracellular acidification (16, 17). These observations together with the property of ASICs of being rapidly opened by acidification from a pH where they are in the closed state (≥pH 7.4 for ASIC1a) indicate that the inactivated and the closed states of ASICs are functionally different.
A study on rat ASIC3 proposed that channel opening is induced by displacing Ca2+ from the channel pore without conformational changes (18). Although this may be true for ASIC3, there is convincing evidence that ASIC1 and ASIC2 open by a different mechanism, which most likely involves conformational changes (19–21). It is assumed that binding of protons to the ASIC protein leads to channel opening, in an analogous way as binding of the ligand to a ligand-gated channel induces opening. Different strategies have been employed to identify residues involved in ASIC pH dependence. Coric et al. (22) identified regions that are different between pH-gated and non-pH-gated ASICs. Paukert et al. (23) mutated conserved acidic and basic side chains in rat ASIC1a, and Smith et al. (24) explored differences in the sequence of the H+-activated ASIC2a and the non-gated ASIC2b, mutating acidic residues of ASIC2a that were not conserved in ASIC2b. These studies showed that several parts of the ASIC extracellular domain contribute to ASIC pH dependence and identified several His, Glu, and Asp residues whose mutation affected the pH dependence of ASIC activation and may therefore be pH sensors of the protein. However, the mechanisms of pH-dependent gating are currently not well understood. The high resolution chicken ASIC1 crystal structure has recently been reported from a truncated construct that was crystallized at acidic pH, therefore most likely representing the channel in its inactivated state (25, 26).
To understand the mechanisms of the control of ASIC activity by pH, it is important to identify pH sensors in the protein. To this end, we used a computational approach to calculate on the basis of the crystal structure the theoretical pKa values of all Asp, Glu, and His residues in the extracellular part of human ASIC1a (hASIC1a). Residues with a calculated pKa between 5 and 8 were further studied by mutagenesis and functional analysis. This analysis identified several residues whose conservative mutation affected the pH dependence of activation or inactivation and which therefore likely have a role in pH sensing. Our analysis gives an overview of the protonation state of acidic residues in the ASIC protein, identifies several previously unknown residues involved in ASIC gating, and suggests conformational changes involved.
EXPERIMENTAL PROCEDURES
Homology Modeling of the hASIC1a Structure
Three-dimensional homology models of the human ASIC1a channel were constructed with the use of the program Modeler 9, version 5 (27), using the crystal structure of the intracellularly truncated, nonfunctional homotrimeric chicken ASIC1 channel (PDB code 2QTS (25)) or that of the recently published functional chicken ASIC1 channel (PDB code 3HGC (26)) as a template. All relevant crystallographic information was retained, including the chloride ligands.
Five models were generated from both structures and analyzed with Dope (28) and Anolea (29), and the model with the best overall score for each structure was selected. The homology models of human ASIC1a were very similar to the experimentally determined structures of chicken ASIC1a, which were used as templates due to very high sequence identity (90%). After superimposition on the Cα atoms, the root mean square deviation between the template crystal structures and the homology models was only 0.5 Å for the homology model based on 2QTS and 0.4 Å for the homology model based on 3HGC. The Anolea score profiles of the homology models resemble the profiles obtained for the templates, which points out the good quality of models (data not shown). The parameters of an analysis of the models by the program PROCHECK (30) is presented in supplemental Table S1, confirming the good quality of the models. In both models the residues in disallowed regions of the Ramachandran plot (making up 0.2%) are situated in an ASIC1a extracellular domain exposed to the solvent, so that their questionable conformation could not influence the pKa calculations.
The accessible surface area of individual residues was calculated using the COOR SEARCH function of the CHARMM c34 molecular mechanics software. Molecular graphics images were produced using the Chimera package from the Resource for Biocomputing, Visualization, and Informatics, University of California, San Francisco (31).
Calculation of pKa
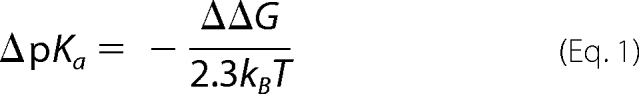
The ionization state of a residue is determined by the relative free energy of its protonated and unprotonated forms. The method for estimating the pKa of the residue consists in calculating the free energy of transfer ΔΔG that corresponds to the reversible work needed to protonate the side chain in the protein compared with the work needed to protonate the same side chain in an isolated peptide in bulk water (32). The intrinsic pKa values of Asp, Glu and His are 3.86, 4.07, and 6.10, respectively. The pKa shift (relative to the intrinsic pKa of the same amino acid isolated in solution) is given by Equations 1 and 2,
 |
where
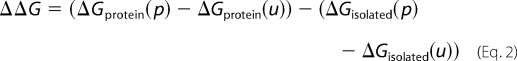 |
where p stands for the protonated and u for the unprotonated state. The free energy difference ΔΔG was estimated using a continuum electrostatic approach in which the solvent and the membrane are represented as a dielectric medium. The various ΔG values are given by Equation 3,
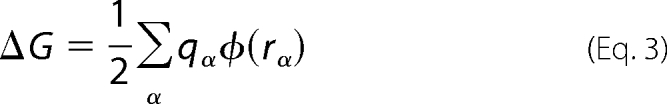 |
where ϕ(rα) is the electrostatic potential at the position of the atomic charge qα. The electrostatic potential ϕ(rα), which is determined by the charge distribution and the space-dependent dielectric constant of the system, was calculated by solving the Poisson-Boltzmann equation using the PBEQ module (33) of CHARMM (34). The trimeric ASIC1a channel, modeled as described above and with its bounded Cl− ions, was embedded in a low dielectric slab of 35 Å thickness mimicking the membrane and a 150 mm salt solution. Dielectric values of 2, 4, and 80 were attributed to the protein, membrane slab, and water bulk, respectively. The molecular surface of the protein was defined using a probe radius of 1.4 Å. A grid spacing of 1.5 Å was used for the initial calculation of the electrostatic field, which was refined by a subsequent run using a grid spacing of 0.5 Å. The Poisson-Boltzmann calculation was repeated for both the protonated and unprotonated states of a residue in the protein environment and isolated in solution (32, 35). The modeling and calculations were performed within the Protein Modeling Facility of the University of Lausanne.
Site-directed Mutagenesis and Expression in Xenopus Oocytes
The original human ASIC1a cDNA construct was kindly provided by D. Corey. Point mutations and combined point mutations were introduced by QuikChange (Stratagene). Mutations were verified by sequencing (Synergene Biotech, Zurich, Switzerland). The ASIC1a cDNA was cloned into a vector containing 5′- and 3′-untranslated sequences of Xenopus β-globin. Expression in Xenopus laevis oocytes was carried out as described previously (36). Complementary RNAs were synthesized in vitro. Oocytes were surgically removed from the ovarian tissue of female X. laevis, which had been anesthetized by immersion in 2 g liter−1 MS-222 (Sandoz, Basel, Switzerland). All experimental procedures on X. laevis were realized according to the Swiss federal law on animal welfare, approved by the committee on animal experimentation of the Canton de Vaud. The oocytes were defolliculated, and healthy stage V and VI Xenopus oocytes were isolated and pressure-injected with 100 nl of cRNA solution, and oocytes were kept in modified Barth solution during the expression phase.
Electrophysiological Analysis
Electrophysiological measurements were taken at 18–30 h after cRNA injection. Macroscopic currents were recorded using the two-electrode voltage clamp technique at a holding potential of −60 mV. Currents were recorded with a Dagan TEV-200 amplifier (Minneapolis, MN) equipped with two bath electrodes and analyzed with the pCLAMP data acquisition package (Axon Instrument, Union City, CA). The standard bath solution contained 110 mm NaCl, 2.0 mm CaCl2, 10 mm Hepes-NaOH (or MES-NaOH for pH < 6.8), and pH was adjusted by NaOH to the values indicated. Oocytes were placed in a recording chamber (500 μl) and perfused by gravity at a rate of 5–15 ml/min. The pH activation curves were fit by using the following Hill equation: I = Imax/(1 + (10−pH50/10−pH)nH), where Imax is the maximal current, pH50 is the pH at which half of the channels are opened, and nH is the Hill coefficient, using KaleidaGraph (Synergy software). Steady-state inactivation curves were fit by an analogous equation. Data are presented as mean ± S.E. Differences between hASIC1a WT and mutants were analyzed by analysis of variance followed by Dunnett post hoc test (p < 0.05), on the entire data set for SSIN and changes in maximal current amplitude after the sulfhydryl reaction. Because there was some batch-to-batch variability in the WT pH50 (pH of half-maximal activation), statistical analysis of activation parameters was carried out on the ensemble of the dataset per experimental day or oocyte batch (always including the WT and several mutants and/or conditions), and a difference was only considered significant if it was significant on all tested days/oocyte batches. In experiments with methane thiosulfonate (MTS) reagents, functional parameters were measured before and after a 5-min incubation with the reagent. In these experiments, the paired Student's t test was used to determine significance of the effect of MTS reagents. Propagated S.E. was calculated as the sum of the relative individual S.E.
Reagents
MTS reagents were obtained from Toronto Research Chemicals (Montreal, Canada), and other reagents were from Sigma, Fluka, or Applichem.
RESULTS
Homology Modeling and pKa Calculation
Homology models of human ASIC1a (hASIC1a) were obtained using Modeler (37) based on the two crystal structures, 2QTS (PDB code) at 1.9 Å, and 3HGC at 3 Å (25, 26). Both structures had been obtained from intracellularly truncated chicken ASIC1 constructs at acidic pH and therefore most likely represent the inactivated conformation. The models are structurally nearly identical to their template as a result of a very high sequence identity (see “Experimental Procedures” and supplemental Table S1). The 2QTS structure has a higher resolution than 3HGC but represents a nonfunctional channel, whereas the 3HGC structure was obtained from a functional channel. The 3HGC structure provides a more realistic structure of the transmembrane regions than the 2QTS structure; however, there are no major differences between the two structures with regard to the extracellular parts (26). Because of the higher resolution of the 2QTS structure and the high similarity of both structures in the extracellular part, we consider the 2QTS-based model a valid and preferable basis for the computational approach. This study is therefore based on the 2QTS-derived hASIC1a model. On the basis of the nonprotonated hASIC1a model, including its chloride ion ligands, the pKa value of each of the two side chain oxygen atoms of each Asp and Glu residue was calculated based on its electrostatic interactions with all other atoms of the model. Using the same approach, pKa values for His residues, as well as the relative energy of the two possible forms of neutral His, were calculated. This initial analysis yielded two pKa values for each Glu and Asp residue, a pKa for His and the relative energies of the two neutral forms of His residues. The pKa values of Asp, Glu, and His residues calculated based on the nonprotonated 2QTS- and 3HGC-derived models are indicated in supplemental Table S2, and differences of pKa values between the two models are discussed below (“Discussion”).
Because the pKa of a residue depends on the electrostatic interactions with its protein environment, protonation of one residue will likely affect the pKa of neighboring residues. Our calculations identified several pairs of acidic residues whose pKa values are interdependent (supplemental Table S3). Fig. 1A displays the names of the different domains of ASIC subunits (25). In the thumb-β-ball contact region, several acidic residues with interdependent pKa values form an interacting network. This region, which has previously been suggested to be critical for ASIC activation (25), is shown in a close-up in Fig. 1B.
FIGURE 1.

Calculation of pKa values in ASIC1a. A, extracellular part of human ASIC1a. One ASIC1a subunit is shown in color, identifying different parts of ASIC subunits (red, transmembrane segments; yellow, palm; orange, β-ball; blue, thumb; purple, finger; turquoise, knuckle) (25). B, view of the network of acidic residues on the finger loop originating in β-ball strands β6 and β7 and the thumb helix α5. The residue Glu-97 is more distant from the α5 helix than Asp-237 and Glu-238. The calculated pKa values for these residues are as follows: Glu-97, Glu-238, Asp-351 > 8, Asp-347 = 6.2, Glu-355 = 5.8, and Asp-237 < 5. C, pKa values for residues with pKa values between pH 8 and 5, calculated as described in the text. D, Glu, Asp, and His residues in the extracellular part of the human ASIC1a model; Asp and Glu, blue, pKa > 8; yellow, pKa < 8 and > 5; dark orange, pKa < 5; His (all pKa < 5), pink. These residues are shown on one of the three subunits, which is colored as in A.
Order of Protonation in ASIC1a
To identify Glu, Asp, and His residues that are likely to be protonated at physiological pH, the residues with the highest pKa values based on the 2QTS-derived model were protonated in the model, and pKa values of neighboring candidate residues were recalculated. By reiterating this process, the following residues with pKa > 8 were identified: Glu-63, Asp-78, Glu-79, Glu-97, Glu-177, Glu-238, Glu-242, Glu-277, Glu-315, Asp-351, Asp-409, and Asp-434. On the basis of a model in which the above-mentioned residues were protonated, the pKa of the remaining Glu, Asp, and His residues were calculated, yielding an initial list of the order of protonation. The residue with the highest pKa value was then protonated in the model, and the pKa values of the remaining candidate residues were recalculated, and so on, yielding the theoretical protonation order at pH values <8 and >5 that is shown in Fig. 1C. The pKa values of all Asp, Glu, and His residues in the stepwise protonated model are shown in supplemental Table S2. The analysis of the 2QTS-based model yielded Glu and Asp, but not His residues with pKa values between 5 and 8. The pKa values of all His residues were <5. ASIC1a activation (the process leading to channel opening) occurs in the pH range of 6.5–5.5 (Fig. 2B). SSIN of ASIC1a occurs in the pH range 7.4–7.0 (Fig. 3B). Therefore, residues Glu-228 and Glu-418 with pKa of 7.4 and 7.2 are candidates for inactivation pH-sensing, whereas the other residues with pKa > 5.5 shown in Fig. 1C may contribute to activation pH-sensing. A potential limit of our approach is the fact that the calculation of pKa values is based on the structure of ASIC in a conformation that corresponds to its inactivated state. Therefore, some of the calculated pKa values may be different from what they would be in the closed or open state conformation. Considering the uncertainty of the calculation, we selected residues with a wide range of pKa values (between 8 and 5) as the residues that are potential H+ sensors. Fig. 1D gives an overview of the different classes of Glu and Asp residues as defined by the calculated pKa, showing on the structure of one ASIC1a subunit (colored ribbon, the other two subunits of the trimer are in light gray) acidic residues with calculated pKa > 8 in blue, with 8 > pKa > 5 in yellow, and with pKa < 5 in dark orange. Fig. 1D also shows His residues (pink), which all had a pKa < 5. Most residues with pKa > 8 are located in interior parts of the protein where they are in contact with other acidic residues. The residues with pKa values <5 are mostly located on the protein surface, whereas Asp and Glu residues with pKa between 5 and 8 are found in almost every part of the protein. Many of the acidic residues with pKa between 5 and 8 are conserved in ASICs, but not other epithelial Na+ channel/Degenerin family members, as illustrated in supplemental Fig. S1. We tested the functional importance of the predicted H+-sensing residues with pKa < 8 and >5. In addition, all 12 residues with pKa > 8 interact with other acidic residues and thereby co-determine the pKa values of these neighbor residues. We therefore tested the function of those residues with pKa > 8 whose neutralization mutation has not been characterized so far (Glu-97, Glu-177, and Glu-277). For the functional analysis, we mutated the residues, expressed the mutant ASIC1a channels in X. laevis oocytes, and determined their functional properties with electrophysiological measurements.
FIGURE 2.

pH dependence of activation of neutralization mutants. A, representative current traces of oocytes expressing ASIC1a WT or E418Q obtained by 5-s acidification to the pH values indicated, at a holding potential of −60 mV. B, pH dependence of activation of WT ASIC1a (○) and the mutants E418Q (♦) and E355Q (▴), n = 4–12. Currents are normalized to the peak current induced by the most acidic pH, pH4.5. The lines represent fits to the Hill equation (see “Experimental Procedures”). C, Hill coefficient was obtained from fits to the Hill equation. D, pH value for half-maximal activation, pH50 obtained from fits to the Hill equation, n ≥ 5. *, different from WT, p < 0.05. Averaged data are represented as mean ± S.E.
FIGURE 3.

pH dependence of SSIN. ASIC currents were induced by 5-s acidification to pH 6 (for some mutants to pH 5.5) after exposure for 55 s to the conditioning pH. Control studies confirmed that the pH50 of WT ASIC1a does not depend on the activation pH (pHIn50 obtained with stimulation pH 6.0, 7.22 ± 0.02, and with stimulation pH 6.0, 7.22 ± 0.01, n = 8 each, direct comparison). A, protocol used and representative current traces with ASIC1a WT; conditioning pH indicated above open bars, pH-6 stimulation indicated by filled bars. B, plot of pH 6-induced currents as a function of the conditioning pH, of ASIC1a WT (○), the mutants E418Q (♦), and E315Q (▴). Currents are normalized to the response with the most alkaline conditioning pH used. The lines are fits to the Hill equation (see “Experimental Procedures”). C, pH for half-maximal inactivation (pHIn50) of neutralization mutants, n ≥ 8. *, different from WT, p < 0.05. Averaged data are represented as mean ± S.E.
pH Dependence of ASIC Activation
In a first set of experiments, acidic residues were neutralized individually, and thus Glu was mutated to Gln, and Asp was mutated to Asn. The mutant side chains are neutral and cannot be protonated. All mutants were functional, and most of them expressed similar acid-induced maximal peak current amplitudes as ASIC1a wild type (WT, data not shown). All mutants induced transient currents, which had similar kinetics as ASIC1a WT. We expect that suppression of a protonation site by mutagenesis may in the simplest case decrease the steepness of the pH-current relationship. ASIC activation is a complex process that likely depends on coordinated conformational changes in different parts of the protein. Therefore, it is likely that the suppression of a protonation site also affects the apparent affinity of the channel for protons, which for channel activation is characterized by the pH of half-maximal activation, pH50. Fig. 2A shows traces of an activation curve measured from ASIC1a WT and the mutant E418Q, and Fig. 2B plots the normalized current as a function of the stimulating pH for ASIC1a WT and the two mutants E418Q and E355Q. Both mutations decreased the steepness of the pH-current relationship (Fig. 2B). The Hill coefficient (nH) of the mutant E355Q but not E418Q was significantly lower than that of ASIC1a WT (Fig. 2C). The E235Q mutation induced a substantial increase in the steepness, without changing pH50 (Fig. 2, C and D). The cause of the increased nH of this mutant, which was not found with the mutation to Cys (not shown), is not clear. The Gln (but not the Cys) introduced at position 235 may form a hydrogen bond with Tyr-389 of the neighboring subunit and thereby affect gating. The pH-current curve (Fig. 2B) shows that the mutation E418Q shifted the activation curve to more acidic pH. Significant acidic shifts of pH50 were observed for the mutants E418Q and D347N (both with calculated pKa between 5 and 8) and for E277Q (pKa > 8) as shown in Fig. 2D. These three residues, as well as Glu-235, therefore contribute to activation. No single mutation did completely disrupt pH gating of ASIC1a.
pH Dependence of Steady-state Inactivation of Neutralization Mutants
The SSIN represents the direct transition from the closed to the inactivated state during prolonged exposure to moderately acidic pH. For ASIC1a, the pH of half-maximal inactivation (pHIn50) is ∼7.2. Therefore, at pH more acidic than pH 7.4, an increasing fraction of ASIC1a channels is in the inactivated conformation from which they cannot be opened by acidification. SSIN determines the fraction of channels that are available for opening. To measure the pH dependence of SSIN, we exposed ASIC1a-expressing oocytes during 55 s to the conditioning pH in the range of 8.0 to 6.6, before switching to pH 6.0 for ASIC activation. Fig. 3A illustrates the protocol and shows current traces from a representative experiment with WT ASIC1a. Fig. 3B plots the normalized current as a function of the conditioning pH and shows the WT SSIN curve as well as examples of mutants that shifted inactivation to more acidic or more alkaline pH values. The summary of SSIN experiments in Fig. 3C shows that E97Q and E277Q (calculated pKa > 8), as well as E113Q, E315Q, and E355Q (pKa between 5 and 8), induced an alkaline shift of pHIn50. Mutation of four residues with pKa between 5 and 8, E418Q, E413Q, E254Q, and E235Q, induced an acidic shift of pHIn50. These residues are therefore potential sensors for SSIN. The steepness of the SSIN curve was not substantially affected by the mutations (data not shown).
Combination of Mutations of Potential pH-sensing Residues
We combined selected neutralization mutations of residues with pKa between 5 and 8 to test whether their effects were additive, whether combination of several mutations may disrupt gating, and whether it was possible to selectively affect either activation or SSIN. Fig. 4A plots the pH50 of these double (open bars), triple (gray), and quadruple (black) mutants and compares them to the expected values if the shifts induced by individual mutations were additive (filled triangles). Based on the principle of mutant cycle analysis, additive effects of two mutations are expected if they do not interact directly (38). The D347N mutation that had shown the strongest acidic shift in pH50 was combined with either E418Q (acidic shift) or E355Q (decreased nH), yielding double mutant channels with the expected pH50 for additive effects of the mutations (Fig. 4A). Next, we followed two different strategies of combining mutations with potential effects on ASIC activation. First, we combined the neutralization mutations that had shown an effect on pH50, D347N and E418Q, as well as E355Q, to which the E235Q mutation was added, which had strongly increased nH in the wild type background (Fig. 2C). The second strategy was the combination of neutralization mutations in the thumb region that had been suggested to be important for ASIC activation (25), thus E344Q, D347N, and E355Q, to which E315Q was added. The localization of these residues in the protein is shown in Fig. 4B. As shown in Fig. 4A, the pH50 values of the triple mutants (gray bars) were as expected for an additive process, i.e. corresponding to the summation of the shifts induced by the individual mutations. The acidic shift by the quadruple mutations was greater than expected from the sum of the individual effects, suggesting an interaction between some of the mutated residues. Most likely the residue that was additionally mutated in the quadruple mutant interacts with other residues, thus Glu-235 with D347N, E355Q, and/or E418Q and Glu-315 with E344Q, D347N, and/or E355Q. The residue Glu-235 is located on the finger loop that originates in the β6 and β7 strands of the β-ball (Fig. 4B) and interacts with the α5 thumb helix (blue), on which Asp-347 and Glu-355 are located. The mutation of Glu-235 in the D347N/E355Q/E418Q background induced an acidic shift of −0.47 pH units (Fig. 4A), although this mutant had no effect on pH50 in the WT background (Fig. 2D). The Glu-315 residue is part of the α4 helix of the thumb and points toward the α5 helix on which Glu-344, Asp-347, and Glu-355 are located (Fig. 4B). The E235Q/D347N/E355Q/E418Q mutant that combines mutations of different domains of the channel (Fig. 4B) induced a stronger shift of pH50 than the quadruple mutant of the thumb region.
FIGURE 4.

pH dependence of channels containing several neutralization mutations. A, combinations of mutations affecting activation. pH50 values of mutants containing several neutralization mutations as indicated (double mutants, open bars; triple mutants, gray bars, quadruple mutants, black bars) and theoretical pH50 calculated as the sum of the individual differences in pH50 to WT (▴). For comparison, the WT pH50 is indicated by an interrupted horizontal line. B, illustration of the position of different mutations that were used in the combined mutants. C, combinations of mutations affecting SSIN. pHIn50 values of mutants containing several neutralization mutations as indicated (double mutants, open bars; triple mutants, gray bars, quadruple mutants, black bars) and theoretical pHIn50 calculated as the sum of the individual differences in pHIn50 to WT (▴). For comparison, the WT pHIn50 is indicated by an interrupted horizontal line. D, difference between pHIn50 and pH50 of single or combined mutations (upper panel, filled circles) and pHIn50 and pH50 connected by a vertical line (lower panel). Filled and open arrowheads indicate the direction of significant shifts relative to WT of pH50 and pHIn50, respectively. E, combined activation and inactivation curves of ASIC1a WT and the mutants E254Q (small ΔpHIn50 − pH50), D347N (affects exclusively activation), E413Q/E418Q (small ΔpHIn50 − pH50), and E235Q/D347N/E355Q/E418Q (large ΔpHIn50 − pH50). Filled symbols indicate activation, and open symbols indicate SSIN; n ≥ 7. Averaged data are represented as means ± S.E.
To generate mutants with changed SSIN, E413Q was combined with either E418Q (acidic shift) or E355Q (alkaline shift), resulting in pHIn50 values slightly less acidic than calculated (Fig. 4C, open bars). We then combined the mutations that had induced acidic shifts of pHIn50 on the WT background, E413Q, E418Q, E235Q, and E254Q. This resulted in channels with more acidic pHIn50. The contribution of the E235Q mutation was smaller than expected, suggesting an interaction of Glu-235 with the other mutated residues during SSIN.
Structural Coupling of Activation and Inactivation
We observed with most single and combined neutralization mutations, which changed pH-dependent gating, that they affected both activation and SSIN. To analyze this relationship quantitatively, we calculated for each mutant the difference pHIn50 − pH50. In ASIC1a WT, Δ(pHIn50 − pH50) equals ∼1. In Fig. 4D a vertical line connects for each mutant pHIn50 and pH50, illustrating how the absolute values were changed relative to WT (horizontal interrupted lines). Arrowheads in Fig. 4D indicate the direction of significant shifts with regard to WT of pH50 (filled arrowheads) and pHIn50 (open arrowheads). In most single mutants, the WT Δ(pHIn50 − pH50) of ∼1 was maintained and was only substantially increased in E315Q, and decreased in E413Q, E254Q, and E235Q. Some of the combined mutants strongly increased Δ(pHIn50 − pH50). Shifts of activation and SSIN were, in most cases, in the same direction (mostly toward more acid pH), and opposite shifts of pH50 and pHIn50 were observed only for D347N/E355Q/E418Q and E344Q/D347N/E355Q. Combinations of mutations generally increased the Δ(pHIn50 − pH50) difference because they induced stronger shifts in activation than in SSIN. These observations are illustrated in Fig. 4E for ASIC1a WT and selected mutants. None of the mutants showed an overlap between the activation and SSIN curve, which would identify a pH at which currents are noninactivating and are called window currents. For the E413Q/E418Q double mutant, the Δ(pHIn50 − pH50) was reduced relative to WT, and a small overlap of the activation and SSIN curves might be expected. However, activation of this mutant by stimulation of pH values between 6.8 and 6.5 induced inactivating currents similar to WT, proving the absence of a window current (supplemental Fig. S2).
pH-dependent Gating of Cys Mutants after Reaction with Charged Sulfhydryl Reagents
Glu and Asp side chains are negatively charged in their deprotonated form and are neutral when protonated. Therefore, regarding the charge of the side chain, the neutralization mutations mimic the protonated form of the original side chain. To obtain negatively charged side chains that cannot be protonated in the pH range used for ASIC activation, we mutated selected residues to Cys and had them react with the negatively charged methanethiosulfonate (MTS) reagent 2-sulfonatoethyl methanethiosulfonate (MTSES) and in control experiments with the positively charged 2-trimethylammonium-ethyl methanethiosulfonate (MTSET). Modification by MTSES or MTSET changed at least one parameter of pH-dependent gating in all 14 Cys mutants tested, indicating that the engineered Cys residues are accessible and had been modified by the applied MTS reagents (paired t test, p < 0.05). As a complementary approach of testing the accessibility of acidic residues, we calculated their accessible surface based on the 2QTS-based model. The relative accessible surface of acidic residues is shown in supplemental Table S2 as percentage of the surface of the isolated residue. The residues that we have mutated to Cys and that were modified by MTSET and/or MTSES had calculated accessible surfaces in the structural model of 0–41%. Differences by the functional MTS approach and the computational approach might be explained by the fact that MTS reagents were normally applied to the channel in its closed state (at pH 7.4), whereas the structural model was obtained from the crystal structure, which likely represents the inactivated conformation.
In control experiments we exposed the WT and three mutants, D347C, E413C, and E418C, to an uncharged MTS reagent, methanesulfonothioic acid 3,3-dimethylbutyl ester (DMBE-MTS), to distinguish between effects because of the charge versus the size of the reagents. DMBE-MTS can, in contrast to the charged MTS reagents, cross membranes. DMBE-MTS affected the pH50 and the maximal peak current amplitude of ASIC1a WT (see legend to Fig. 5). The effect of DMBE-MTS on mutants is therefore compared with that on WT after DMBE-MTS exposure (Fig. 5). The results of experiments with MTS reagents are presented in Fig. 5 with the pH dependence of activation in A, the relative changes in peak current after MTS reaction in B, and the pH dependence of SSIN in C.
FIGURE 5.

Effect of engineered Cys modification on ASIC1a activation and SSIN. A, pH50 of mutants to Gln or Asn (black bars) or Cys (green bars) or Lys (orange, only with Glu-413 and Glu-418) and of Cys mutants modified by MTSES (blue), MTSET (red), or DMBE-MTS (purple). The WT unmodified pH50 value is shown as an interrupted horizontal line. The MTS reagents were applied for 5 min at 1 mm. ASIC1a WT pH50 was slightly shifted by MTSES from 6.22 ± 0.02 to 6.19 ± 0.02, by MTSET from 6.26 ± 0.02 to 6.22 ± 0.02 (n = 12), and was markedly shifted by the uncharged DMBE-MTS (from 6.23 ± 0.01 to 6.11 ± 0.02, n = 4). B, relative change of the pH 4.5-induced ASIC peak current by MTS reagent exposure. The ASIC1a WT peak current was not significantly affected by the MTSET or MTSES exposure (current ratio after/before MTSES = 1.06 ± 0.06, MTSET = 1.01 ± 0.04, n = 12) but was decreased by DMBE-MTS (0.43 ± 0.05, n = 4). C, pHIn50 values, bar colors as in A. The WT unmodified pHIn50 value is shown as an interrupted horizontal line. ASIC1a WT pHIn50 was not affected by MTS reagents (pHIn50 before MTSES = 7.14 ± 0.00 and after MTSES = 7.14 ± 0.01; before MTSET = 7.16 ± 0.01 and after MTSET = 7.16 ± 0.01, n = 4; pHIn50 before DMBE-MTS = 7.19 ± 0.01 and after DMBE-MTS = 7.21 ± 0.00, n = 4). *, different from unmodified WT (p < 0.05); #, different from DMBE-MTS-exposed WT (p < 0.05). Averaged data are represented as mean ± S.E. D, residues in the proximity of the chloride ion-binding site. Each of the three subunits contains one chloride ion-binding site, located between α helices 4 and 5. Shown is the one in subunit A. The different parts of subunit A are shown in blue (thumb), purple (finger), orange (β-ball), and yellow (palm). Subunits B and C are shown in gray. The chloride ion is shown in pink. Two positively charged residues are positioned close to the chloride ion, Arg-311 of chain A and Lys-211 of chain C. The two other residues in close proximity are Glu-315 and Leu-353, both on subunit A.
Modification of E315C by MTSET but not MTSES resulted in a dramatic current decrease (Fig. 5B), which is not due to the small acidic shift of pH50 (pH4.5 induces maximal current before and after exposure to the reagent), or the alkaline shift of pHIn50, which induces a reduction of the current amplitude of ∼10% (data not shown). Because E315C is located distant from the narrow ion pore, we consider it unlikely that its modification affects channel conductance. In the absence of shifts in pH dependence that would explain a current decrease of the observed amplitude, the most likely explanation for the observed current decrease is that the presence of the positive charge of MTSET at this site reduces the efficiency of opening. The Glu-315 residue is located on the lower thumb α-helix (α4) and points toward α5 (Fig. 4B and Fig. 5D). The Glu-315 side chain is oriented toward the chloride ion present in the crystal structure, whose binding site is formed by two positively charged residues, Arg-311 of the same subunit and Lys-211 of a neighboring subunit (Fig. 5D). The current decrease in E315C-MTSET is therefore likely due to the repulsion between positively charged side chains.
Modification of the D347C mutant by either of the charged sulfhydryl reagents induced a strong acidic shift in pH50 and decreased the maximal peak current, further confirming the importance of this residue and suggesting that it is not the sign of the charge but rather the increased polarity due to the presence of the charge or the increased size of the modified side chain that results in the observed functional changes. Exposure to the uncharged MTS reagent DMBE-MTS induced an acidic shift of pH50 of ∼0.8 units (Fig. 5A), which is even slightly stronger than induced by the charged reagents, suggesting that it is rather the increased size of the modified side chain than the charge that induces the shift.
Glutamate Residues in the Palm Region Are Involved in SSIN
Modification of E413C induced charge-dependent acidic shifts of small and large amplitude of pH50 and pHIn50, respectively (Fig. 5, A and C). Both pH50 and pHIn50 were more affected by MTSET than by MTSES modification, and the MTSET effects were qualitatively reproduced by the mutation to Lys, but not by modification of E413C by DMBE-MTS, suggesting that the observed effect is due to the introduced positive charge.
The mutation of Glu-418 to Cys induced an acidic pH50 shift relative to WT, which was not affected by modification (Fig. 5A). Although sulfhydryl modification of this Cys residue did not further change pH50, it did however increase the maximal peak current amplitude by ∼2–3-fold (Fig. 5B). Fig. 6A shows that the E418C mutation dramatically shifted the SSIN pH dependence to more alkaline values, leading to substantial inactivation at pH 7.4. The sulfhydryl modification partially reversed this shift, thereby releasing channels from inactivation and increasing the maximal peak current amplitude. Exposure to the uncharged DMBE-MTS induced an acidic shift of −0.16 units (Fig. 5C, as compared with −0.46 by MTSET), suggesting that the size of the MTS reagent is less important than its charge or hydrophilicity for the shift of pHIn50. The acidic shift of the SSIN curve by DMBE-MTS was still sufficient to increase the maximal peak current amplitude of E418C (Fig. 5B). The sulfhydryl modification of the engineered Cys residue at position 418 affected only slightly activation (Fig. 5A) but in contrast had a strong effect on SSIN pH dependence (Fig. 5C). To obtain more information about how the side chain at position 418 affects activation and SSIN, we have mutated Glu-418 to residues of different size and hydrophobicity and have measured the pH dependence of the mutant channels. All mutations that changed pH50 shifted it to more acidic values, and for the new mutants the shifts were smaller than that induced by the mutation to Cys (Fig. 6B). There was no apparent relation between the shift in pH50 and the properties of the amino acid side chain at position 418.
FIGURE 6.

Function of Glu-418. A, SSIN curve for ASIC1a WT (open circles), the mutants E418Q (black) and E418C unmodified (green), after modification by MTSES (blue) and MTSET (red); n ≥ 3. B, pH for half-maximal activation (pH50) of Glu-418 mutants and MTSES-exposed (C-MTSES) and MTSET-exposed E418C (C-MTSET), n ≥ 6. The conditioning pH in these experiments was 7.7 for mutants with positively shifted pHIn50. C, pH for half-maximal inactivation (pHIn50) of Glu-418 mutants and MTSES-exposed (C-MTSES) and MTSET-exposed E418C (C-MTSET), n ≥ 7. *, different from WT, p < 0.05. Averaged data are represented as mean ± S.E. D, plot of hydrophobicity (39) of amino acid residues to which Glu-418 was mutated as a function of their van der Waals volume. pHIn50 values are indicated close to each residue. E, view of the area around Glu-418 in the hASIC1a model. Subunit A is shown in yellow (palm) and orange (β-ball), and subunit B in pink, and subunit C (β10 and β9 removed for visibility) in gray. Side chains of residues pointing toward the central axis are shown from bottom to top in turquoise (Leu-77 and Ile-420), cornflower blue (Glu-79 and Glu-418), pink (Gln-276 and Gln-278), orange (Arg-371), and dark blue (Glu-413).
The pHIn50 was shifted to more alkaline values by mutation to Ala, Cys, Val, Met, and Lys and was similar to WT or more acidic for the other mutations tested (Fig. 6C). This figure shows that there was a graded shift in pHIn50 by different mutations, which likely depends on the physicochemical properties of the replacing side chain. Fig. 6D plots the hydrophobicity (39) of the replacing amino acid residues as a function of their side chain van der Waals volume. The diagonal line in Fig. 6D separates residues that showed a pHIn50 of around 7.45 from the other residues, illustrating that residues inducing an alkaline shift were rather hydrophobic and small, and residues inducing an acidic shift were, except for Phe, hydrophilic or charged.
As illustrated in Fig. 6E, Glu-418 and Glu-413 are localized in a densely filled structure that is formed by the β-sheets of the lower palm domains of all three subunits and is located just above the “central cavity” (25, 26). From these β-sheets, several layers of residues, pointing from each of the three subunits toward the central axis of the channel, can be distinguished. From bottom to top, these are two hydrophobic residues (L77 and I420, turquoise in Fig. 6E), the acidic residues Glu-79 and Glu-418 (light blue), two polar residues (Q276 and Q278, magenta), and two residues of opposite charge (R371, orange, and E413, dark blue). Glu-418 forms a pair with Glu-79 (calculated pKa > 8), and it is therefore expected that all mutations of Glu-418 will affect the protonation state of Glu-79. As the crystal structure corresponds to the inactivated state conformation of ASIC1a, we hypothesize that during inactivation the palm domains of the ASIC subunits move toward each other, consistent with the steric effects of Glu-418 mutations and modification and the charge effect of Glu-413 (repulsion between MTSET-modified E413C and Arg-371). For Glu-79, located adjacent to Glu-418, it has been shown in ASIC3 that when mutated to Cys it can be modified by MTSET in the closed state but not the inactive state conformation of the channel (40), consistent with a movement that changes its accessibility. E418C of ASIC1a in contrast is also accessible in the inactivated state of ASIC1a, because in our experiments the sulfhydryl reaction was efficient at pH 7.4, where the channel is inactivated (Fig. 6A). Mutation of Glu-418 to the large, hydrophilic Lys shifted the pHIn50 to a more alkaline value. The G418K mutant did therefore not show the same correlation between amino acid properties and pHIn50 as the other mutants of Glu-418 (Fig. 6D). The Lys residue introduced at position 418 likely formed a salt bridge with Glu-79, thereby reducing the repulsion between the acidic residues (i.e. Glu-79 and Glu-418) of different subunits and favoring inactivation. Mutation of Glu-418 to small, hydrophobic residues likely enlarged the hydrophobic zone at the bottom of this conical structure (Fig. 6E) and removed a constraint in its hydrophilic part, favoring the movement toward the central vertical axis and thereby favoring inactivation and leading to the observed shifts in pHIn50.
In the closed and open conformation, the palm domains of different subunits are likely farther away from each other than in the crystal structure, consistent with the observation that modification of E418C has no steric or charge effects in the context of activation. The different dependence for activation and inactivation on the Glu-418 side chain suggests that the palm domain adopts the conformation of the crystal structure only in the inactivated state.
DISCUSSION
In this study, we used a Poisson-Boltzmann continuum approach to calculate the pKa values of acidic amino acid side chains of ASIC1a from its crystal structure and to identify residues with pKa values within the pH range at which channel gating occurs. We have tested the functional relevance of these residues by neutralizing them one at a time and measuring the pH dependence of activation and inactivation of the mutant channels. This combined approach identified a number of acidic residues that are potential pH sensors for ASIC gating. The combination of mutations generally increased the pH shift observed, although pH-dependent gating was preserved in all mutant channels. Many mutations affected both activation and inactivation, suggesting a strong structural link between these two processes. An extended analysis of Glu-418 of the palm region allowed us to deduce conformational changes that likely occur in this region during ASIC gating.
Basis for pKa Calculations
The pKa calculations are based on the initial chicken ASIC1 structure at a resolution of 1.9 Å (PDB code 2QTS (25)). We consider this structure the more appropriate basis than the recently published structure of a functional, less truncated channel, which has a resolution of only 3 Å (3HGC (26)). The pKa values in the unprotonated protein are provided for models based on either of the two structures, 2QTS and 3HGC, in supplemental Table 2. For most residues, similar pKa values were obtained from both structural models, confirming the robustness of the computational approach. However, some residues would have been attributed to a different pKa category based on the 3HGC model. Having used the 2QTS-based pKa calculation to select potential pH sensors, we need to take a closer look at residues that have a higher pKa in the 3HGC-based than in the 2QTS-based calculation, because these are potential false-negatives of our computational approach. One of the few obvious differences in the extracellular domain between the 2QTS and 3HGC structure concerns the loop just N-terminal of the α4 thumb helix, comprising acidic residues Asp-296, Asp-298, Asp-300, and Asp-303. Because of the different orientation, the pKa values of Asp-296, Asp-298, and Asp-300 are >8 when calculated based on the 3HGC structure, whereas they are <5 in the calculation based on the 2QTS structure. The human ASIC1a clone has an Asp-Leu insertion with regard to the chicken ASIC1 structure after position 297, and therefore this part of the human model is not reliable. For this reason, and because this loop is not constrained in the structure and therefore the conformation adopted in the 3HGC-based model appears somewhat unlikely, we have not further analyzed these residues. The D303N mutation has been analyzed and did not affect ASIC pH dependence (Figs. 2 and 3). The other substantially positive shifts in the 3HGC, as compared with the 2QTS-based calculation, concern the residues Asp-313, Asp-357, and Glu-427. Two of these residues have been analyzed previously. The D357N mutation did not shift pH50 in rat ASIC1a but required higher amounts of cRNA for normal current expression (rASIC1a D355N (23)). However, mutation of Asp-357 to Ala in hASIC1a induced an acidic shift of −0.6 units in pH50 (41), suggesting a potentially important role of Asp-357 in the pH dependence of activation. Mutation of Glu-427 to Gly was shown to result in an acidic shift of pH50 of −0.15 units (rASIC1a E425G (20)), whereas the mutation of Asp-313 has not been described so far. We included it in the functional analysis and found no differences to the WT pH dependence (Figs. 2 and 3). Therefore, as judged from these controls, the choice of the 2QTS model as basis for the pKa calculation did, except for possibly Asp-357, most likely not lead to the missing of important residues.
Gonzales et al. (26) had soaked the crystals from which the 3HGC structure was obtained in a solution containing Cs+ and identified several Cs+ in the structure determined from this crystal (PDB code 3IJ4). In the normal channel environment, these sites may be occupied by cations. To test the influence of the bound Cs+ ions on pKa values in their proximity, we placed the Cs+ ions in the appropriate positions in the 3HGC-based model and calculated the pKa values of surrounding Asp, Glu, and His residues. As shown in supplemental Table S4, the Cs+ ions in the pore entry lowered the pKa values of the neighboring residues Glu-63, Glu-427, Asp-434, and to a much lesser extent His-70 and His-72. The presence of Cs+ 468 did not affect any pKa values, whereas Cs+ 467 induced a small shift in the pKa of Glu-219.
The pKa values calculated by the Poisson-Boltzmann approach do not represent exact, absolute pKa values of these residues, rather they give an estimate of the pKa value and provide the probable order of protonation of the different residues within a protein (35). As discussed under “Results,” the fact that the crystal structure corresponds to the inactivated conformation of the channel adds an uncertainty to the pKa calculation. To compensate in part for these uncertainties, we have set the range of pKa values for the selection for further functional analysis to values between 8 and 5, thus wider than the range of gating pH of ASIC1a. Because all residues with pKa > 8 are located in the proximity of other acidic residues and may at least indirectly affect ASIC pH dependence, we have also mutated and characterized those residues with pKa > 8 whose neutralization mutants have not been described so far (Glu-97, Glu-177, and Glu-277).
Interpretation of the Calculated pKa Values
With regard to their contribution to ASIC gating, we can consider three categories of acidic residues as follows: (i) residues with side chains that are protonated at pH ≥ 7.4 and are therefore neutral in all three conformational states of ASIC1a (closed, open, and inactivated); (ii) those that are protonated in the pH range 7.4 to 5 and that are likely involved in pH-dependent gating; and (iii) those that are not protonated at pH values as acidic as pH 5 and therefore remain negatively charged in all three conformational states.
The pKa calculation yielded per subunit 12 acidic residues with pKa > 8, 16 with a pKa between 5 and 7.4, and 39 Asp, Glu, or His residues with pKa < 5, corresponding to the three above-mentioned categories. Of the residues with pKa < 5, 22 are located on the protein surface and have no substantial electrostatic interactions with other side chains, 4 form ion pairs with positively charged side chains, and 5 interact with acidic residues. The pKa of these five residues, Glu-219, Asp-227, Asp-237, Asp-313, and Glu-375, fell to values below 5 after protonation of neighboring residues. The eight remaining residues with pKa < 5 are located in the interior of the protein but have no close interactions with other residues.
Residues of categories I and II and Glu-219, Asp-227, Asp-237, Asp-313, and Glu-375 of category III are closely related because of the following: 1) they are located in close proximity to other acidic residues in the structure, and 2) their pKa value depends on the presence of these neighboring acidic residues and on their protonation state. Of these residues, only those of category II are, theoretically, the real pH sensors. They are unprotonated at pH 7.4 and are protonated by the acidification that leads to ASIC opening. The residues of category I and other residues interacting with category II residues (i.e. Glu-219, Asp-227, Asp-237, Asp-313, and Glu-375) are closely involved and similarly important for pH sensing because they co-determine the pKa value of the pH sensors but are not the sensors themselves.
Possible Bias of the pKa Calculation Because of Conformational Changes
Differences between the closed conformation of the channel, relevant for the pKa values of Asp, Glu, and His residues, and the inactivated crystal structure may have shifted some of the calculated pKa values. Such changes likely concern mainly residues that are found in proximity to the other acidic residues in the crystal structure, for the following reason. Protonation neutralizes Glu and Asp residues and adds a positive charge to a neutral His and therefore, by removing electrostatic repulsion, favors closer contact among acidic side chains and between acidic side chains and His residues. In the crystal structure of the inactivated and thus protonated ASIC, we would expect as a consequence that protonated residues are close to other Asp, Glu, or His residues.
Conformational changes will thus mainly affect residues that are found in the crystal structure in close proximity of other acidic residues. Such residues are part of categories I and II, including the category III residues interacting with other acidic side chains (Glu-219, Asp-227, Asp-237, Asp-313, and Glu-375), but not other category III residues, which are not in proximity of other acidic side chains. The calculated pKa values of concerned residues would be based on a structure in which acidic residues are closer to each other than they are in the closed conformation and consequently would be shifted to more alkaline values. The actual pKa values in the closed conformation would therefore be lower for residues that have undergone conformational changes than the calculated pKa values based on the inactivated conformation.
Identification of Residues That Are Involved in pH-dependent Gating and May Be pH Sensors
The pKa calculation yielded for 16 acidic residues a pKa between 5 and 8, suggesting that these residues may be protonated during an acidification that activates and inactivates ASIC1a. The functional approach showed that conservative mutation of eight of them affected ASIC pH dependence. This confirms their functional relevance and suggests that they may be pH sensors for ASIC gating. Of these eight residues, Asp-347 is exclusively involved in activation; Glu-113, Glu-254, Glu-315, and Glu-413 play a role in inactivation, and Glu-235, Glu-355, and Glu-418 participate in both activation and inactivation. Several of these residues have been mutated and studied previously for their role in activation but not inactivation (23, 24). The supplemental Table S5 compares our data with those of previous studies, showing that pH50 values of this study correlate well with data obtained with rat ASIC1a (23). In a study with ASIC2a, mutation D182N (corresponding to hASIC1a Asp-183) induced a substantial shift in pH50 (24), which was not found in the context of hASIC1a.
As detailed above, category I and II residues and category III residues that interact with titratable residues are closely related. The functional analysis cannot distinguish between residues that are pH sensors themselves or that influence pH sensing. Therefore, we conclude that these residues that had a calculated pKa between 5 and 8 and whose mutation affected activation and/or SSIN pH dependence are part of the pH-sensing mechanism of ASIC1a, either as pH sensors or by affecting the pKa of neighboring pH-sensing residues.
Of the 12 residues for which we have calculated a pKa > 8, several have previously been functionally investigated (20, 23, 25). Table 1 lists published shifts in pH50 relative to WT of several mutants, as well as data from this study. Of the four residues with pKa > 8 that have not been described previously, Glu-315 is localized close to the Cl− ion in the structure and displayed, even after protonation of one oxygen, a pKa of 6.4 on its second side chain oxygen and was therefore mutated and functionally characterized (Figs. 2 and 3). To complete the series, we have mutated and characterized the three other residues with pKa > 8, Glu-97, Glu-177, and Glu-277. Table 1 shows that most of these mutations induced pH50 shifts of 0.1–0.3 units, with the strongest effects observed by mutations of Asp-78 and Asp-409.
TABLE 1.
Summary of observed effects of neutralization mutation of acidic residues with calculated pKa > 8 from the literature or this study
The abbreviations used are as follows: c, chicken; h, human; and r, rat.
| Residue | Species | pH50-shift relative to WT | Ref. |
|---|---|---|---|
| Glu-63 | r | <0.1a | 23 |
| Asp-78 | r | −0.3a | 23 |
| Glu-79 | r | +0.15 | 23 |
| Glu-97 | h | +0.15 | b |
| Glu-177 | h | <0.1 | b |
| Glu-238 | r | <0.1 | 23 |
| Glu-242 | r | −0.15 | 23 |
| Glu-277 | h | −0.15c | b |
| Glu-315 | h | <0.1 | b |
| Asp-351 | c | <0.1d | 25 |
| Asp-409 | r | +0.2 | 23 |
| Asp-434 | r | −0.2 | 20 |
a When this mutation was combined with the double mutation E425G/D432C (corresponding to Glu-427 and Asp-434 in hASIC1a), the H+-induced current was completely suppressed.
b Data are from this study. All data are from mutation of Glu to Gln or Asp to Asn, except for Asp-434, which was mutated to Cys. In data from Refs. 20, 23, values are from the condition with 1.8 mm Ca2+.
c Difference to WT pH50 is statistically shown (p < 0.05).
d Strong decrease in Hill coefficient of activation was noted.
Of the category III residues interacting with other acidic residues, several have been mutated and functionally analyzed by Paukert et al. (23). The E219Q mutation did not affect pH50, and D227N induced a shift of +0.2 pH units, and the D237N and E375Q mutations induced shifts of −0.4 and −0.2 units in pH50, respectively (23).
In conclusion, we list here the Asp and Glu residues that we consider as potentially important for pH sensing (including not only the sensors themselves), based on the literature and this study, and fulfilling the following criteria: 1) they belong to category I or II according to the pKa calculation (pKa > 5), to the category III residues that interact with other acidic residues (Glu-219, Asp-227, Asp-237, and Glu-375), or have a pKa > 5 in the calculation based on the 3HGC model; and 2) their conservative mutation induces a statistically significant shift in pH50 or a shift of at least 0.15 units where no statistical information is available. These residues include the following: Asp-78, Asp-79, Asp-227, Glu-235, Asp-237, Glu-242, Glu-277, Asp-347, Asp-351, Glu-355, Asp-357, Glu-375, Asp-409, Glu-418, and Asp-434. The localization of these residues in an ASIC1a subunit is shown in Fig. 7A. Interestingly, most of these residues are either located in the thumb-β-ball domain or in the palm.
FIGURE 7.

Overview of residues important for ASIC gating and scheme of predicted conformational changes. A, Asp and Glu residues, that are potentially important for pH sensation in ASIC activation (based on pKa calculation and functional data from this and previous studies, as detailed in the text) are shown on an ASIC1a subunit. B, residues shown in functional studies to affect ASIC1a pH dependence (see text), shown on one ASIC1a subunit. His, Arg, and Lys, magenta; Asp and Glu, blue (pKa > 8), yellow (8 > pKa > 5), orange (pKa < 5); other residues, turquoise. This figure is also represented as a supplemental video. C, illustration of the predicted conformational changes induced by acidification. The contours of the channel are indicated in gray, and the vertical central axis is indicated by a black line. One subunit with its six subdomains is shown in color (red, transmembrane segments; yellow, palm; orange, β-ball; blue, thumb; purple, finger; turquoise, knuckle), and the contours of a second subunit are indicated by an interrupted gray line. During ASIC activation, the thumb moves toward the β-ball (indicated by red arrows), leading to opening and subsequent inactivation. Inactivation involves a movement of the palm domains toward the central vertical axis, as indicated by the blue arrows. D, regions in an hASIC1a subunit are colored depending on their b-factor in the 2QTS PDB file: yellow for high b-factor, orange for intermediate, and green for low b-factor.
We expected that addition of a constant negative charge by mutation to Cys and the subsequent MTSES modification would have the strongest effects on category I mutants, which are in all conformational states protonated and therefore uncharged. MTSES but not MTSET modification induced an acidic shift in the pH50 of E315C, which may thus belong to category I. Mutation of category III residues may affect pH-dependent gating due to the removal of the negative charge. Asp-107 belongs to category III and likely forms an ion pair with Arg-160. Mutation of Asp-107 to Asn induced indeed an acidic shift of pH50 (23).
Most of the neutralization mutations induced relatively small changes in pH50 or pHIn50 values in our study. This finding is not unexpected, considering that many different residues contribute to pH sensing. The strongest shifts due to neutralization of a putative pH-sensing residue were found with ∼0.2 pH units for Asp-347 and Glu-418. For less conservative mutations, shifts of higher amplitude (i.e. ≤0.7 units) were observed (Fig. 5).
Residues Involved in ASIC Gating
Fig. 7B and the supplemental video show on a single ASIC1a subunit residues whose mutation has affected ASIC pH dependence in this and previous functional studies. For clarity, we use the numbering of hASIC1a in the discussion of mutations in hASIC1a and other ASIC subunits. The original numbering and the reference of each of the cited mutations is presented in supplemental Table S6. So far, most studies have mainly analyzed ASIC activation and much less SSIN. Mutations of residues of the α5 helix of the thumb (Asp-347, Asp-351, and Glu-355), of the β-ball (β4-β5 loop, Arg-190; β7-β8 loop, Asp-253 and Glu-254), and on the interacting finger loop that originates in the strands β6 and β7 of the β-ball (Glu-235, Asp-237, and Glu-238) affected ASIC activation (this work and see Refs. 23, 25, 42), consistent with the hypothesis of the paper of the first ASIC structure (25) that the interaction between the thumb and the β-ball is critically involved in the activation process. Further confirming the importance of the thumb, residues at the lower end of the thumb helix α5 (Asp-357, Gln-358, and Glu-359) also affect ASIC activation when mutated (22, 41). We show here that Glu-315 and Glu-355 in the thumb and Glu-235 and Glu-254 on different loops originating in the β-ball are involved in SSIN. Replacement of the residues downstream of α4, down to β10, and thus the short α4-α5 loop and the α5 helix of the thumb as well as the loop connecting it to β10 on the palm, by the corresponding ASIC2a sequence (corresponding to residues 323–370 in hASIC1a), resulted in a channel with the same low pH50 (∼4) as ASIC2a (41). The residue Trp-287 is part of the second loop connecting the thumb with the palm. At the lowest position of the loop, Trp-287 points down on Tyr-71 at the extracellular end of the first transmembrane segment. Mutation of Trp-287 or Tyr-71 also affected ASIC pH dependence (43). The finger is located at the uppermost part of the extracellular domain, and its main part contains three short α-helices, α1–α3. Three residues in the α1 helix of the finger, Lys-105, Asn-106, and Asp-107, profoundly affect the pH dependence of ASIC activation and SSIN when mutated (15, 23), and cleavage by trypsin at Arg-145 on α2 also shifts the pH dependence of both activation and inactivation (36). In the palm, above the central cavity, Asp-78 on β1 points downward, whereas its neighboring residue Glu-79 points upward, parallel to the adjacent Glu-418 on β12. Glu-413 points down toward them from the loop connecting β11 and β12. Glu-418 and Asp-78 are involved in activation (this work and see Ref. 23), and we show here the importance of Glu-413 and Glu-418 in SSIN. The residue corresponding to Glu-79 in ASIC3 has been shown to induce an alkaline shift in SSIN when mutated (40).
Because His residues have an intrinsic pKa value of ∼6.1, His residues were initially proposed to contribute to pH sensing in ASICs, and it was found that mutation of His-72 of ASIC2a, corresponding to His-73 of ASIC1a, resulted in nonfunctional channels (44). In the study on ASIC2a His-72, it was not investigated whether the mutant protein was made and was expressed at the cell surface, and therefore the loss of function may be due to other causes than a defect in pH sensing. In ASIC1a, Paukert et al. (23) showed that single mutations of His residues did not affect pH dependence for residues His-72, His-163, His-250, and His-327, whereas the nonconservative H73A mutation shifted the pH50 by −0.5 units, confirming the importance of this residue. A second His residue, His-72, is located next to His-73 in the ASIC1a sequence. Double mutation of these residues suppressed ASIC current but not expression at the cell surface (23). We calculated pKa values <5 for all His residues. His-72 and His-73 are located on top of the first transmembrane helix, next to Tyr-71 that interacts with Trp-287 of the loop between the thumb and the palm, and they are part of a domain that is highly important for ASIC function (23, 43). His-73 is oriented toward and interacts with Asp-78 of a neighboring subunit (for this reason the interaction is not obvious on Fig. 7B that shows a single subunit). Asp-78 has been shown to play a role in pH dependence (23). In our model, the Asp-78 side chain oxygen pointing toward His-73 has a pKa of 8.1 and is therefore protonated at physiological pH. This precludes an additional protonation of His-73, which had even without protonation of Asp-78 a pKa of only slightly above 5. However, the functional data, the structure, and our calculation agree that one of these two residues must be protonated to stabilize the conformation and that mutation of either of the two residues will affect the protonation state of the other residue and may thereby affect ASIC pH dependence.
His-163 is located in a zone where the finger, β-ball, and upper palm domains interact with each other. Although its mutation to Asn did not affect ASIC pH dependence (23), we recently observed that its mutation to Cys and subsequent sulfhydryl modification almost completely suppressed ASIC current, suggesting that His-163 is important for ASIC function, although likely not as pH sensor (46).
Activation and Inactivation Are Structurally Coupled
The pH dependence of ASIC1a WT is steeper for inactivation than for activation (nH = 10.1 ± 0.2 for SSIN and 2.9 ± 0.0 for activation), which may indicate that more residues participate in inactivation than in activation. Another important difference is the time scale at which activation and inactivation occur. The time constant of activation of ASIC1a has been measured from excised patches and is around 6 ms at pH 6 (45), whereas the time constant of SSIN for ASIC1a at pH 7.05 is ∼80 s, thus 10,000 times slower than activation (15). After opening, ASIC1a channels enter the inactivated state via open channel inactivation, which has a time constant of ∼1 s at pH 6.0 in whole-cell measurements (17) (∼0.4 s in excised outside-out patches)4 thus still 100 (or 40) times slower than activation. Despite the different kinetics and steepness of pH dependence of activation and SSIN, these two processes are not only functionally coupled but also depend to a considerable extent on the same residues. In this study, we were not able to uncouple these two processes by selectively combining mutations. Together, these observations suggest that the same parts are involved in activation and inactivation. The amplitude of the effects of mutations suggests a slightly more important role of the thumb and β-ball region for activation and of the palm domain for inactivation.
Hypothesis on ASIC Gating
The pKa calculation and the functional data suggest that in the closed conformation the thumb is located farther away from the β-ball and the finger than it is in the crystal structure, due to the repulsion of negatively charged residues. As discussed above, it is likely that in the closed and in the open conformation the palm domains of different subunits are more distant from each other than what they are in the crystal structure. The results presented in this work, together with previous studies, provide strong evidence that ASIC gating does not depend on the protonation and deprotonation of only a few pH-sensing residues but that many different residues in each subunit contribute to pH sensing for ASIC gating.
Fig. 7C illustrates the conformational changes of the ASIC protein during activation and inactivation, based on the available functional information. Upon acidification to pH values that activate the channel, the protonation of negatively charged residues on α5 (Asp-347 and Glu-355) and possibly on the β6-β7 β-ball-finger loop (Glu-235) allows the approaching of the thumb toward the β-ball (red arrows in Fig. 7C). This movement induces channel opening by a mechanism that involves in addition the finger and the palm domain. These conformational changes are likely transmitted to the channel gate via the palm and by the interaction between Trp-287 and Tyr-71 of the first transmembrane segment (42, 43). At this point, Asp-78 and His-73 may also contribute to the transmission of the signal (23). Inactivation follows either channel activation or occurs directly from the closed conformation and depends on residues in the finger, thumb, and β-ball and involves movement of the palm domains toward the central vertical axis of the channel as indicated by the blue arrows in Fig. 7C. These predicted conformational changes are consistent with an estimate of the inherent flexibility of the ASIC protein (42) and with the b-factors of the different parts of the ASIC subunits. A recent study estimated the inherent flexibility of the different parts of the ASIC protein by normal mode analysis and suggested that proton binding induces collective motions between thumb and finger and a rotational movement of the extracellular domain (42). An estimate of the flexibility or uncertainty in the position of the different atoms in a structure is provided by the b-factor in the PDB file. Fig. 7D shows an ASIC1a subunit, in which the regions with highest b-factors (thus highest flexibility) are shown in yellow, those with intermediate values in orange, and the regions with the lowest b-factors in green. According to the b-factors, the finger and the transmembrane domains have the highest flexibility, the upper palm and a part of the β-ball are the least flexible domains, and the other domains are of intermediate flexibility. From this information, it is conceivable that rigid body movements can occur in the upper parts of the extracellular domain, and due to the flexibility, the movements in the extracellular regions closer to the membrane are less predictable.
In conclusion, this combined computational and mutational analysis identifies new ASIC1a residues involved in pH-dependent gating that likely contribute to pH sensing. Together with previous studies, it provides evidence that ASIC gating depends on protonation of many different sites in the protein. Most parts of the extracellular domain participate in both activation and inactivation. The functional analyses suggest that the thumb/finger/β-ball region has a more important role in activation, and the palm domain is mostly critical for inactivation. The approach applied here should be relevant to the study of the mechanisms of the pH dependence of other proteins.
Supplementary Material
Acknowledgments
We thank Laurent Schild, Aurélien Boillat, Maxime Blanchard, and Miguel van Bemmelen for comments on a previous version of the manuscript and for many discussions.
This work was supported by Grant 31003A0-117717 from the Swiss National Science Foundation (to S. K.) and by SCORE Grants 3232B0-103172 and 3200B0-103173 from the Swiss National Science Foundation (to O. M.).

The on-line version of this article (available at http://www.jbc.org) contains supplemental Figs. S1 and S2, video, Tables S1–S6, and additional references.
S. Kellenberger, unpublished data.
- ASIC
- acid-sensing ion channel
- h
- human
- DMBE-MTS
- methanesulfonothioic acid 3,3-dimethylbutyl ester
- MTS
- methanethiosulfonate
- MTSES
- 2-sulfonatoethyl methanethiosulfonate
- MTSET
- 2-trimethylammonium-ethyl methanethiosulfonate
- pH50
- pH of half-maximal activation
- pHIn50
- pH of half-maximal inactivation
- SSIN
- steady-state inactivation
- WT
- wild type
- MES
- 4-morpholineethanesulfonic acid
- PDB
- Protein Data Bank.
REFERENCES
- 1.Krishtal O. (2003) Trends Neurosci. 26, 477–483 [DOI] [PubMed] [Google Scholar]
- 2.Wemmie J. A., Price M. P., Welsh M. J. (2006) Trends Neurosci. 29, 578–586 [DOI] [PubMed] [Google Scholar]
- 3.Kellenberger S., Schild L. (2002) Physiol. Rev. 82, 735–767 [DOI] [PubMed] [Google Scholar]
- 4.Sutherland S. P., Benson C. J., Adelman J. P., McCleskey E. W. (2001) Proc. Natl. Acad. Sci. U.S.A. 98, 711–716 [DOI] [PMC free article] [PubMed] [Google Scholar]
- 5.Sluka K. A., Price M. P., Breese N. M., Stucky C. L., Wemmie J. A., Welsh M. J. (2003) Pain 106, 229–239 [DOI] [PubMed] [Google Scholar]
- 6.Deval E., Noël J., Lay N., Alloui A., Diochot S., Friend V., Jodar M., Lazdunski M., Lingueglia E. (2008) EMBO J. 27, 3047–3055 [DOI] [PMC free article] [PubMed] [Google Scholar]
- 7.Mogil J. S., Breese N. M., Witty M. F., Ritchie J., Rainville M. L., Ase A., Abbadi N., Stucky C. L., Séguéla P. (2005) J. Neurosci. 25, 9893–9901 [DOI] [PMC free article] [PubMed] [Google Scholar]
- 8.Wemmie J. A., Chen J., Askwith C. C., Hruska-Hageman A. M., Price M. P., Nolan B. C., Yoder P. G., Lamani E., Hoshi T., Freeman J. H., Jr., Welsh M. J. (2002) Neuron 34, 463–477 [DOI] [PubMed] [Google Scholar]
- 9.Wemmie J. A., Askwith C. C., Lamani E., Cassell M. D., Freeman J. H., Jr., Welsh M. J. (2003) J. Neurosci. 23, 5496–5502 [DOI] [PMC free article] [PubMed] [Google Scholar]
- 10.Xiong Z. G., Zhu X. M., Chu X. P., Minami M., Hey J., Wei W. L., MacDonald J. F., Wemmie J. A., Price M. P., Welsh M. J., Simon R. P. (2004) Cell 118, 687–698 [DOI] [PubMed] [Google Scholar]
- 11.Hesselager M., Timmermann D. B., Ahring P. K. (2004) J. Biol. Chem. 279, 11006–11015 [DOI] [PubMed] [Google Scholar]
- 12.Yagi J., Wenk H. N., Naves L. A., McCleskey E. W. (2006) Circ. Res. 99, 501–509 [DOI] [PubMed] [Google Scholar]
- 13.Lingueglia E., de Weille J. R., Bassilana F., Heurteaux C., Sakai H., Waldmann R., Lazdunski M. (1997) J. Biol. Chem. 272, 29778–29783 [DOI] [PubMed] [Google Scholar]
- 14.Waldmann R., Bassilana F., de Weille J., Champigny G., Heurteaux C., Lazdunski M. (1997) J. Biol. Chem. 272, 20975–20978 [DOI] [PubMed] [Google Scholar]
- 15.Babini E., Paukert M., Geisler H. S., Grunder S. (2002) J. Biol. Chem. 277, 41597–41603 [DOI] [PubMed] [Google Scholar]
- 16.Benson C. J., Xie J., Wemmie J. A., Price M. P., Henss J. M., Welsh M. J., Snyder P. M. (2002) Proc. Natl. Acad. Sci. U.S.A. 99, 2338–2343 [DOI] [PMC free article] [PubMed] [Google Scholar]
- 17.Poirot O., Vukicevic M., Boesch A., Kellenberger S. (2004) J. Biol. Chem. 279, 38448–38457 [DOI] [PubMed] [Google Scholar]
- 18.Immke D. C., McCleskey E. W. (2003) Neuron 37, 75–84 [DOI] [PubMed] [Google Scholar]
- 19.Zhang P., Sigworth F. J., Canessa C. M. (2006) J. Gen. Physiol. 127, 109–117 [DOI] [PMC free article] [PubMed] [Google Scholar]
- 20.Paukert M., Babini E., Pusch M., Gründer S. (2004) J. Gen Physiol. 124, 383–394 [DOI] [PMC free article] [PubMed] [Google Scholar]
- 21.Adams C. M., Snyder P. M., Price M. P., Welsh M. J. (1998) J. Biol. Chem. 273, 30204–30207 [DOI] [PubMed] [Google Scholar]
- 22.Coric T., Zheng D., Gerstein M., Canessa C. M. (2005) J. Physiol. 568, 725–735 [DOI] [PMC free article] [PubMed] [Google Scholar]
- 23.Paukert M., Chen X., Polleichtner G., Schindelin H., Gründer S. (2008) J. Biol. Chem. 283, 572–581 [DOI] [PubMed] [Google Scholar]
- 24.Smith E. S., Zhang X., Cadiou H., McNaughton P. A. (2007) Neurosci. Lett. 426, 12–17 [DOI] [PubMed] [Google Scholar]
- 25.Jasti J., Furukawa H., Gonzales E. B., Gouaux E. (2007) Nature 449, 316–323 [DOI] [PubMed] [Google Scholar]
- 26.Gonzales E. B., Kawate T., Gouaux E. (2009) Nature 460, 599–604 [DOI] [PMC free article] [PubMed] [Google Scholar]
- 27.Martí-Renom M. A., Stuart A. C., Fiser A., Sánchez R., Melo F., Sali A. (2000) Annu. Rev. Biophys. Biomol. Struct. 29, 291–325 [DOI] [PubMed] [Google Scholar]
- 28.Shen M. Y., Sali A. (2006) Protein Sci. 15, 2507–2524 [DOI] [PMC free article] [PubMed] [Google Scholar]
- 29.Melo F., Feytmans E. (1997) J. Mol. Biol. 267, 207–222 [DOI] [PubMed] [Google Scholar]
- 30.Laskowski R. A., MacArthur M. W., Moss D. S., Thornton J. M. (1993) J. Appl. Crystallogr. 26, 283–291 [Google Scholar]
- 31.Pettersen E. F., Goddard T. D., Huang C. C., Couch G. S., Greenblatt D. M., Meng E. C., Ferrin T. E. (2004) J. Comput. Chem. 25, 1605–1612 [DOI] [PubMed] [Google Scholar]
- 32.Bashford D., Karplus M. (1990) Biochemistry 29, 10219–10225 [DOI] [PubMed] [Google Scholar]
- 33.Im W., Beglov D., Roux B. (1998) Comp. Phys. Commun. 111, 59–75 [Google Scholar]
- 34.Brooks B. R., Bruccoleri R. E., Olafson B. D., States D. J., Swminathan S., Karplus M. (1983) J. Comp. Chem. 4, 187–217 [Google Scholar]
- 35.Roux B., Bernèche S., Im W. (2000) Biochemistry 39, 13295–13306 [DOI] [PubMed] [Google Scholar]
- 36.Vukicevic M., Weder G., Boillat A., Boesch A., Kellenberger S. (2006) J. Biol. Chem. 281, 714–722 [DOI] [PubMed] [Google Scholar]
- 37.Sánchez R., Sali A. (2000) Methods Mol. Biol. 143, 97–129 [DOI] [PubMed] [Google Scholar]
- 38.Hidalgo P., MacKinnon R. (1995) Science 268, 307–310 [DOI] [PubMed] [Google Scholar]
- 39.Eisenberg D., McLachlan A. D. (1986) Nature 319, 199–203 [DOI] [PubMed] [Google Scholar]
- 40.Cushman K. A., Marsh-Haffner J., Adelman J. P., McCleskey E. W. (2007) J. Gen. Physiol. 129, 345–350 [DOI] [PMC free article] [PubMed] [Google Scholar]
- 41.Sherwood T., Franke R., Conneely S., Joyner J., Arumugan P., Askwith C. (2009) J. Biol. Chem. 284, 27899–27907 [DOI] [PMC free article] [PubMed] [Google Scholar]
- 42.Yang H., Yu Y., Li W. G., Yu F., Cao H., Xu T. L., Jiang H. (2009) PLoS Biol. 7, e1000151. [DOI] [PMC free article] [PubMed] [Google Scholar]
- 43.Li T., Yang Y., Canessa C. M. (2009) J. Biol. Chem. 284, 4689–4694 [DOI] [PMC free article] [PubMed] [Google Scholar]
- 44.Baron A., Schaefer L., Lingueglia E., Champigny G., Lazdunski M. (2001) J. Biol. Chem. 276, 35361–35367 [DOI] [PubMed] [Google Scholar]
- 45.Bässler E. L., Ngo-Anh T. J., Geisler H. S., Ruppersberg J. P., Gründer S. (2001) J. Biol. Chem. 276, 33782–33787 [DOI] [PubMed] [Google Scholar]
- 46.Bargeton B., Kellenberger S. (2010) J. Biol. Chem. 285, 13816–13826 [DOI] [PMC free article] [PubMed] [Google Scholar]
Associated Data
This section collects any data citations, data availability statements, or supplementary materials included in this article.