Abstract
A dual-channel imaging system with single fluorophore sensitivity was assembled in this lab. Inclusion of an integrated laser combiner was introduced to facilitate simultaneous dual-channel imaging. The imaging system has been applied to study the structure, stoichiometry, distance and function of the phi29 DNA packaging motor. Approaches including single molecule photobleaching, single molecule FRET and binomial distribution quantification were carried out to clarify the stoichiometry and distance of pRNA on the biologically active packaging motor. The results were statistically analyzed to access the copy number of pRNA, and the distance constraint was used to verify the 3D structure of the computer model of phi29 DNA packaging motor.
I. INSTRUCTION
Single molecule fluorescence imaging has been widely applied in biological studies. Investigation at the single molecule level provides more detailed information of complex bio-systems than bulk assays [1,2]. Conventional optical microscopy is usually limited by the diffraction of light in resolving two closely located molecules. The spatial resolution is about half of the wavelength, which is in the range of hundreds of nanometers. However, bio-complexes such as biomotors are usually only a few tens of nanometers in size. Methods such as single molecule photobleaching [3–7], single molecule FRET [8–11], nanometer localization [12–15], and stochastic optical reconstruction [16] have been used to elucidate the stoichiometry or to determine the structural changes for bio-complexes that cannot be resolved by conventional optical microscopy. To reduce background noise and enhance the sensitivity, total internal reflection fluorescent microscopy (TIRF) has been developed [17][18].
Single molecule imaging is challenging as it requires the detection of weak signals from a single fluorophore. A good imaging system requires high quality optics that ensures minimal loss of the signals, minimal background noise, and a highly sensitive detector for signal collection. A customized single-molecule dual-channel TIRF imaging system [4,5] was assembled in our lab. The system is capable of detecting single molecules, as well as two different dyes simultaneously. The system is equipped with a laser combiner for easy manipulation of lasers with different wavelengths for dual channel analysis.
II. CUSTOMIZED SINGLE MOLECULE DUAL-CHANNEL TIRF
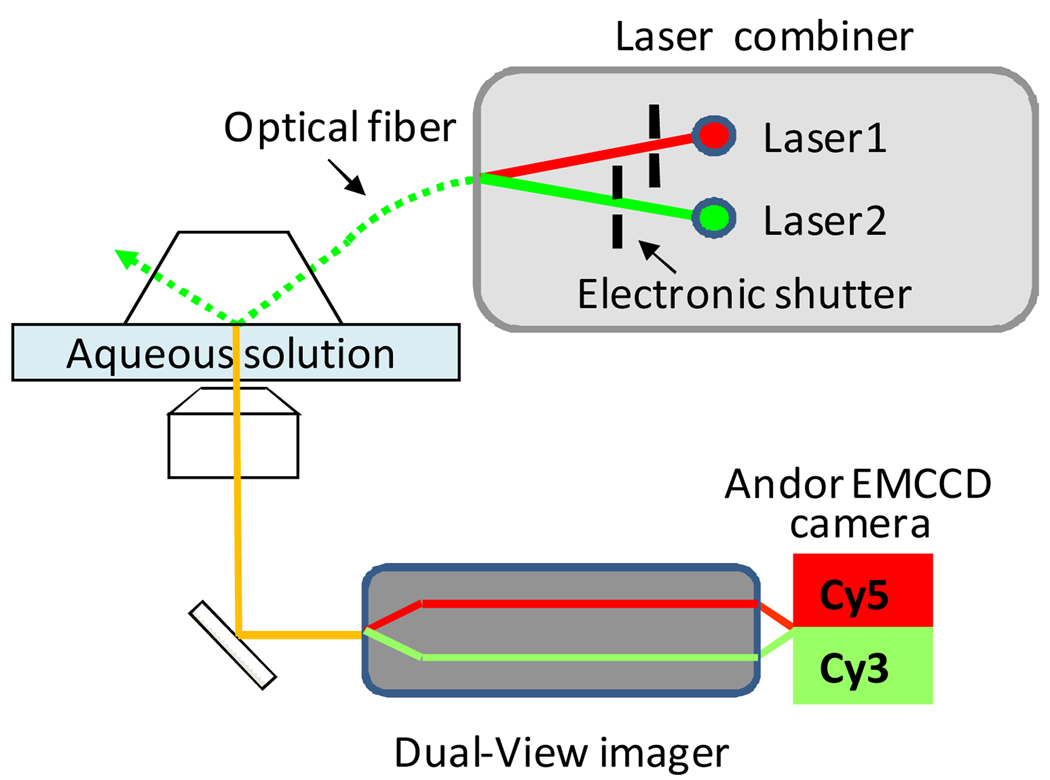
The setup of the imaging system is based on the prism-type total internal reflection fluorescence microscope (Fig.1). For easier and safer use of the lasers, a laser combiner was used in the imaging system (Fig.1). The laser combiner combines two beams from solid state lasers, one of 532 nm and the other of 635 nm. The co-alignment inside the combiner is achieved with a series of mechanical and optical assemblies. The co-aligned beams were delivered into a single mode optical fiber for illumination of the TIRF system. The laser beams are individually shuttered so that they can be turned on separately for single-color, or simultaneously for dual-channel operation by software-control (Andor iQ). The use of the laser combiner with the optical fiber has several advantages such as saving space, rapid switching, and easy manipulation of the beam. The closed box of the combiner also minimizes the risk of inadvertent exposure to the laser beam.
Fig. 1.
Single molecule dual-channel TIRF setup.
A highly sensitive back-illuminated electron-multiplying CCD (EMCCD) camera (Andor Technology) was used to record the data. The operating temperature of −70 °C for the camera greatly reduces the dark noise and enhances EMGain performance which is widely used in single molecule imaging. The recorded signals were separated into two channels according to their wavelengths by the Dual-View imager (Optical Insights). Once the physical alignment has been performed, each image in a sequence contains two channels and Andor iQ software was used to split these channels and register them with high precision. One of the primary advantages of using a field splitter for simultaneous imaging is that co-localization of fluorophores is free from time-shift artifacts.
III. SINGLE MOLECULE PHOTOBLEACHING IN STOICHIMOETRY STUDY
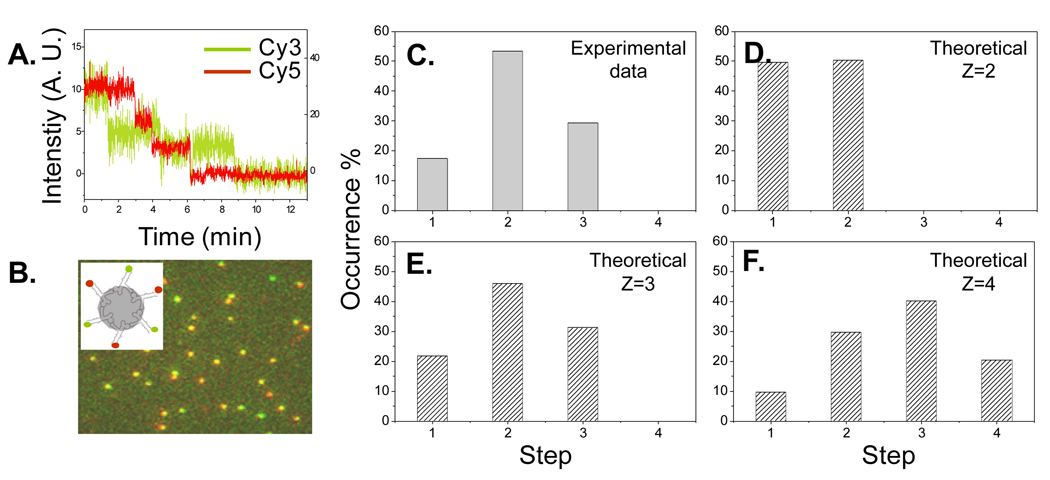
The customized imaging system has been successfully applied to study the stoichiometry of fluorescent pRNA on the phi29 DNA packaging motor [4,5,19]. This motor is less than 50 nm in size, which is beyond the optical resolution limit. It is our goal to resolve individual pRNA molecules within the motor, and therefore the method of single molecule photobleaching was applied. The pRNA was labeled in such a way that no more than one fluorophore was attached to each pRNA molecule. The copy number of pRNA molecules on the motor could be inferred from the time traces of fluorescence intensities of labeled pRNA, as each quantized step represents one single fluorescent pRNA molecule (Fig. 2A). When the motor was constructed with two groups of differently labeled pRNAs, such as Cy3 and Cy5 (Fig. 2B inset), photobleaching traces for both of the fluorophores could be obtained simultaneously. Using the laser combiner and proper shutter control, two laser beams of 532 nm and 635 nm co-excited the same area of the sample chamber. Both Cy3 and Cy5 underwent the photobleaching process. The signals were separated into two channels by the dual-view imager and detected at the same time. The motor containing both labels was localized after overlaying the images from the two channels at the same time point (Fig. 2B). Further analysis processed the overlapped fluorescent spots into time traces of intensities, and thus revealed the copy number of pRNA molecules labeled with Cy3 or Cy5 on the same motor (Fig. 2A).
Fig. 2.
(A) Time traces of intensities to show three Cy3- and three Cy5- pRNA bound to phi29 motor. (B) Overlayed fluorescence image of phi29 motor with different-color labeled pRNAs. Green represents Cy3, red represents Cy5, and yellow represents colocalization of Cy3 and Cy5. Inset shows the construct of the motor. (C–F) Comparison of experimental results with theoretical binomial distributions, based on 67% labeling efficiency. Z represents the possible copy numbers of pRNA studied.
For dual-color labeled samples, photobleaching and imaging the fluorophores sequentially poses a couple difficulties in co-localization due to position shifts during time intervals or loss of information due to pre-bleaching of one fluorophore during imaging of the other. Such problems will not exist when using the dual-channel imaging system, as simultaneous detection of both fluorophores ensures matching of the two channels and also preserves the complete photobleaching events for both fluorophores. Another challenge encountered in dual-channel analysis is the different stabilities of the fluorophore pair. For example Cy5 will photobleach much faster than Cy3. An oxygen-depleting solution [20] was used to reduce the bleach-rate of Cy5. Another confounding factor in the application of the dual-channel single molecule analysis is the quantum yield and signal steadiness. Although the quantum yield of FITC, Alexa, and Rodamine is much higher than Cy3 and Cy5, the pair of Cy3/Cy5 is preferred due to their signal stabilities.
IV. STATISTICAL ANALYSIS
The number of steps in the photobleaching traces indicates the number of fluorescent molecules within each motor. If the fluorescent labeling efficiency of the target molecule is 100%, the number will represent the true copy number of the components in the complex. However, if the labeling is less than 100%, the number obtained from the photobleaching steps does not reflect the true stoichiometry of the components, e. g., pRNA, directly. In order to get the correct stoichiometry of pRNA molecules, instead of fluorescent pRNA molecules, statistical analysis has to be included. Usually, many individual motors were studied to obtain information about the number of fluorescent pRNA molecules by analyzing their photobleaching traces. The information was then summarized into a histogram of the occurrence versus number of steps in photobleaching. The histogram should follow a binomial distribution. Labeling efficiency of pRNA could be obtained from its UV/Vis absorbance spectrum. The theoretical binomial distribution with the measured labeling efficiency could be speculated for different possible copy numbers (Z = 2, 3, or 4, as in Fig. 2D–F). The experimental result (Fig. 2C) was then compared with these theoretical distributions to conclude the exact copy number of pRNA molecules. It was found that the stoichiometry of the pRNA on phi29 DNA packaging motor is the common multiple of 2 and 3. That is, each motor contains six copies of pRNA before or during the motor action.
V. SINGLE MOLECULE FRET FOR DISTANCE DETERMINATION IN NANO-BIOCOMPLEXES
A 3-D model of the pRNA hexamer on phi29 DNA packaging motor has been published [21]. The refinement and verification of the 3D structure of the motor requires data concerning the distance constraint between/among the pRNAs or pRNA and other motor components. The single-molecule dual-channel TIRF system was applied to study the nanometer distance between pRNA molecules within the motor complexes by single molecule FRET (Fluorescence Resonance Energy Transfer). To overcome the diffraction limit, many methods have been developed, among which FRET has been widely used. FRET occurs when two fluorophores, such as Cy3 (donor) and Cy5 (acceptor), come into close proximity. FRET efficiency is proportional to the distance of the two fluorophores (within 10nm), and thus can be used to calculate the distance or to study the structure, conformation, and motion of bioparticles.
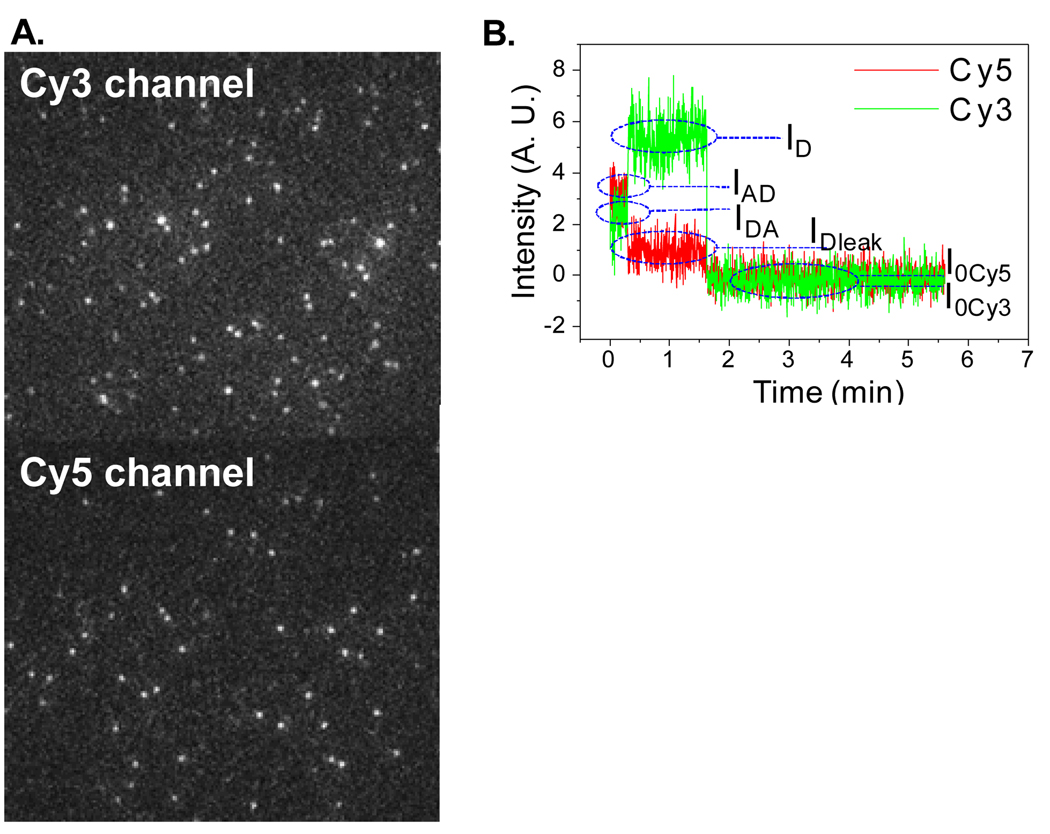
The biggest challenge in FRET is to label the components with the fluorophore donor and accepter pair at the desired positions. Our unique single labeling strategies by the bottom-up assembly RNA nanotechnology [22] ensure the precise labeling at the desired bases with only one fluorophore. The intermolecular distances between two bases within the complexes were therefore studied by single molecule FRET. A green laser of 532 nm in wavelength was used for excitation of Cy3. Signal was detected in both Cy3 and Cy5 channels (Fig. 3A). If the Cy3 and Cy5 were close to each other (2–8 nm) within one complex, signal from Cy5 would appear, although no excitation source of Cy5 is applied. Accordingly, the signal of Cy3 in that motor complex would be weaker than normal, due to the energy transfer. Using the dual-channel FRET system, both Cy3 and Cy5 signals were detected at the same time. Cy3 and Cy5 were co-localized by the software and time traces of fluorescence intensities for both fluorophores were plotted (Fig. 3B). Under continuous laser illumination, both Cy3 and Cy5 were photobleached - Cy5 faded faster than Cy3 most of the times. The traces of Cy3 and Cy5 were inversely correlated with each other for a typical FRET pair. It is therefore easy to determine whether FRET does or does not exist for each complex by simultaneous imaging of the two fluorophores. Once a FRET event was found, information of the distance between the two fluorophores was calculated from the equations below:
Fig. 3.
(A) Fluorescence images of dual-labeled pRNA in the complex, with the excitation for Cy3 only. (B) Typical time traces of fluorescence intensities of Cy3 and Cy5 FRET pair. ID: Intensity of donor without acceptor; IDA: Intensity of donor with acceptor; IAD: Intensity of acceptor due to FRET; IDleak: Intensity of donor leakage to acceptor channel; I0Cy3, I0Cy5: Baseline intensities for Cy3, Cy5.
The distance is therefore calculated as:
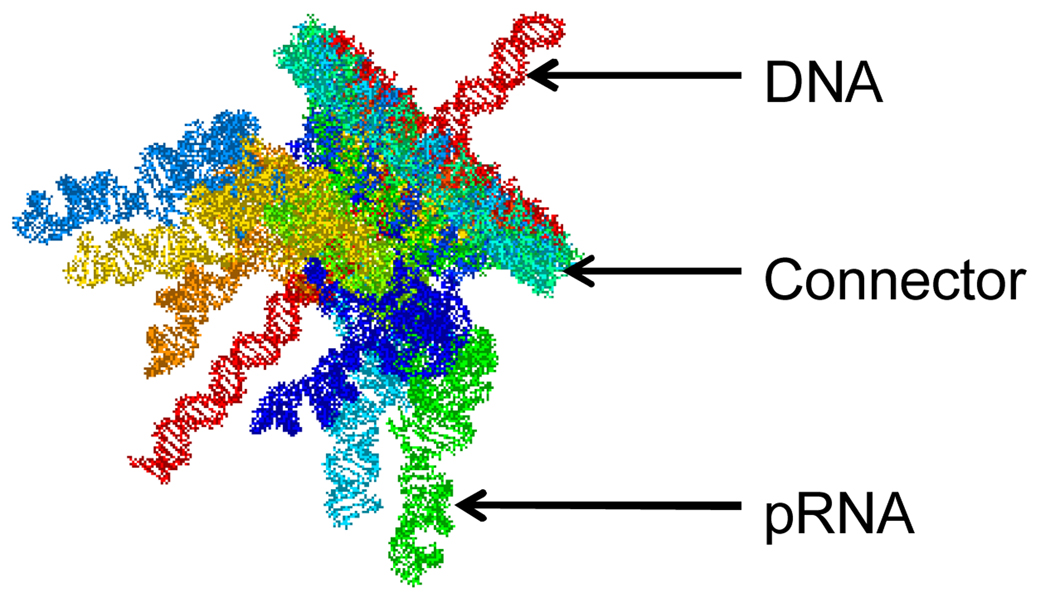
For single molecule FRET, the FRET efficiency of each RNA complex was determined. Gaussian fitting was applied to the histogram to obtain the mean value of efficiency for the sample, and therefore the distance between the two labeled pRNAs. The distance was compared to that from the computer models of the motor complex. The data was used to refine the 3D structure of the computer model of the motor as shown in Fig.4.
Fig. 4.
Computer model of phi29 motor.
VI. NANOMETER LOCALIZATION
As noted above, the refinement and verification of the 3D structure of the motor requires data concerning the distance constraint between/among the pRNAs or pRNA and other motor components. FRET resolves the distance in a range of 2–8 nm. However, there are uncovered ranges for less than 2 nm and from 10 nm to 200 nm. The highly sensitive dual-channel single molecule imaging system is ideal for the nanometer localization using a technique based on FIONA [12,23][15], the nanometer-localized multiple single-molecules (NALMS) [14], or Single-molecule High-resolution Imaging with Photobleaching (SHRImP) [13]. A Gaussian distribution was used to fit the point spread function (PSF) of the fluorescence image of a nanoparticle to calculate the centroid of the particle [24]. A similar algorithm was applied to fluorescence images of single fluorophores for centroid determination with high accuracy, when enough photons were captured. When two fluorophores of the same dye are located within the diffraction limit, methods such as FIONA cannot resolve them. As a result, SHRImP and NALMS were developed independently (Fig. 5), and both methods combine Gaussian fitting with photobleaching. One of the fluorophores was photobleached, leaving the other one localized by Gaussian fitting to its PSF. The centroid of the first fluorophore was therefore calculated from the difference of the images before and after photobleaching, allowing the distance between the two fluorophores to be determined. The method has been shown to resolve distances from 8 nm to 132 nm [13]. Besides the localization of the fluorophores of same dye, approaches were developed for two fluorescent probes of different dyes [25][26]. The distance was measured with nanometer precision.
Fig. 5.
Application of SHRImP to analyze the distance of two fluoroscopes on the pRNA of phi29 DNA packaging motor using the single molecule dual-channel TIRF.
For all the methods in nanometer localization referred to above, high quantum efficiency, low background noise, and suitable pixel size of the detector are required to obtain high resolution in centroid determination for single fluorophores. Our imaging system, with its highly sensitive single molecule detection and dual-color imaging ability, meets the requirements.
ACKNOWLEDGEMENT
We thank Wulf-Dieter Moll, David Rueda, Nils Walter, Chris Meiners, Meredith Lambert, Peter Stockley, Taekjip Ha, Toshio Yanagida, Faqing Huang, Masasuke Yoshida, Kazuhiko Kinosita Jr. and Eckhard Jankowsky for their kind assistance and valuable comments. The work is supported by NIH grants, GM59944, EB003730, and PN2 EY018230 from NIH Nanomedicine Development Center for Phi29 DNA Packaging Motor for Nanomedicine through NIH Roadmap for Medical Research.
REFERENCES
- 1.Weiss S. Science. 1999;vol. 283:1676–1683. doi: 10.1126/science.283.5408.1676. [DOI] [PubMed] [Google Scholar]
- 2.Ha T. Methods. 2001;vol. 25:78–86. doi: 10.1006/meth.2001.1217. [DOI] [PubMed] [Google Scholar]
- 3.Leake MC, Chandler JH, Wadhams GH, Bai F, Berry RM, Armitage JP. Nature. 2006;vol. 443:355–358. doi: 10.1038/nature05135. [DOI] [PubMed] [Google Scholar]
- 4.Shu D, Zhang H, Jin J, Guo P. EMBO J. 2007;vol. 26:527–537. doi: 10.1038/sj.emboj.7601506. [DOI] [PMC free article] [PubMed] [Google Scholar]
- 5.Zhang H, Shu D, Huang F, Guo P. RNA. 2007;vol. 13:1793–1802. doi: 10.1261/rna.587607. [DOI] [PMC free article] [PubMed] [Google Scholar]
- 6.Das SK, Darshi M, Cheley S, Wallace MI, Bayley H. Chembiochem. 2007;vol. 8:994–999. doi: 10.1002/cbic.200600474. [DOI] [PubMed] [Google Scholar]
- 7.Robinson MA, Wood JP, Capaldi SA, Baron AJ, Gell C, Smith DA, Stonehouse NJ. Nucleic Acids Res. 2006;vol. 34:2698–2709. doi: 10.1093/nar/gkl318. [DOI] [PMC free article] [PubMed] [Google Scholar]
- 8.Myong S, Bruno MM, Pyle AM, Ha T. Science. 2007;vol. 317:513–516. doi: 10.1126/science.1144130. [DOI] [PMC free article] [PubMed] [Google Scholar]
- 9.Zhuang X, Kim H, Pereira MJ, Babcock HP, Walter NG, Chu S. Science. 2002;vol. 296:1473–1476. doi: 10.1126/science.1069013. [DOI] [PubMed] [Google Scholar]
- 10.Rueda D, Bokinsky G, Rhodes MM, Rust MJ, Zhuang X, Walter NG. Proc. Natl. Acad. Sci. U. S. A. 2004;vol. 101:10066–10071. doi: 10.1073/pnas.0403575101. [DOI] [PMC free article] [PubMed] [Google Scholar]
- 11.Gell C, Sabir T, Westwood J, Rashid A, Smith DAM, Harris SA, Stockley PG. J Mol Biol. 2008;vol. 384:264–278. doi: 10.1016/j.jmb.2008.08.088. [DOI] [PubMed] [Google Scholar]
- 12.Yildiz A, Forkey JN, McKinney SA, Ha T, Goldman YE, Selvin PR. Science. 2003;vol. 300:2061–2065. doi: 10.1126/science.1084398. [DOI] [PubMed] [Google Scholar]
- 13.Gordon MP, Ha T, Selvin PR. Proc. Natl. Acad. Sci. U. S. A. 2004;vol. 101:6462–6465. doi: 10.1073/pnas.0401638101. [DOI] [PMC free article] [PubMed] [Google Scholar]
- 14.Qu XH, Wu D, Mets L, Scherer NF. Proc. Natl. Acad. Sci. U. S. A. 2004;vol. 101:11298–11303. doi: 10.1073/pnas.0402155101. [DOI] [PMC free article] [PubMed] [Google Scholar]
- 15.Balci H, Ha T, Sweeney HL, Selvin PR. Biophys. J. 2005;vol. 89:413–417. doi: 10.1529/biophysj.105.060608. [DOI] [PMC free article] [PubMed] [Google Scholar]
- 16.Rust MJ, Bates M, Zhuang XW. Nature Methods. 2006;vol. 3:793–795. doi: 10.1038/nmeth929. [DOI] [PMC free article] [PubMed] [Google Scholar]
- 17.Funatsu T, Harada Y, Tokunaga M, Saito K, Yanagida T. Nature. 1995;vol. 374:555–559. doi: 10.1038/374555a0. [DOI] [PubMed] [Google Scholar]
- 18.Ambrose WP, Goodwin PM, Nolan JP. Cytometry. 1999;vol. 36:224–231. doi: 10.1002/(sici)1097-0320(19990701)36:3<224::aid-cyto12>3.3.co;2-a. [DOI] [PubMed] [Google Scholar]
- 19.Xiao F, Zhang H, Guo P. Nucleic Acids Res. 2008;vol. 36(20):6620–6632. doi: 10.1093/nar/gkn669. [DOI] [PMC free article] [PubMed] [Google Scholar]
- 20.Ha T, Rasnik I, Cheng W, Babcock HP, Gauss GH, Lohman TM, Chu S. Nature. 2002;vol. 419:638–641. doi: 10.1038/nature01083. [DOI] [PubMed] [Google Scholar]
- 21.Hoeprich S, Guo P. J Biol. Chem. 2002;vol. 277(23):20794–20803. doi: 10.1074/jbc.M112061200. [DOI] [PubMed] [Google Scholar]
- 22.Shu D, Moll D, Deng Z, Mao C, Guo P. Nano Lett. 2004;vol. 4:1717–1724. doi: 10.1021/nl0494497. [DOI] [PMC free article] [PubMed] [Google Scholar]
- 23.Chiocca AE, Choi BB, Cai W, DeLuca NA, Schaffer PA, DiFiglia M, Breakefield XO, Martuza RL. New Biol. 1990;vol. 2:739–746. [PubMed] [Google Scholar]
- 24.Thompson RE, Larson DR, Webb WW. Biophysical Journal. 2002;vol. 82:2775–2783. doi: 10.1016/S0006-3495(02)75618-X. [DOI] [PMC free article] [PubMed] [Google Scholar]
- 25.Mettenleiter T, Rauh I. J Virol Meth. 1990;vol. 30:55–66. doi: 10.1016/0166-0934(90)90043-f. [DOI] [PubMed] [Google Scholar]
- 26.Agrawal A, Deo R, Wang GD, Wang MD, Nie SM. Proc. Natl. Acad. Sci. U. S. A. 2008;vol. 105:3298–3303. doi: 10.1073/pnas.0712351105. [DOI] [PMC free article] [PubMed] [Google Scholar]


