

Abstract
Specific chromosomal alterations are recognized as important prognostic factors in chronic lymphocytic leukemia (CLL). Array-based karyotyping is gaining acceptance as an alternative to the standard fluorescence in situ hybridization (FISH) panel for detecting these aberrations. This study explores the optimum single nucleotide polymorphism (SNP) array probe density for routine clinical use, presents clinical validation results for the 250K Nsp Affymetrix SNP array, and highlights clinically actionable genetic lesions missed by FISH and conventional cytogenetics. CLL samples were processed on low (10K2.0), medium (250K Nsp), and high (SNP6.0) probe density Affymetrix SNP arrays. Break point definition and detection rates for clinically relevant genetic lesions were compared. The 250K Nsp array was subsequently validated for routine clinical use and demonstrated 98.5% concordance with the standard CLL FISH panel. SNP array karyotyping detected genomic complexity and/or acquired uniparental disomy not detected by the FISH panel. In particular, a region of acquired uniparental disomy on 17p was shown to harbor two mutated copies of TP53 that would have gone undetected by FISH, conventional cytogenetics, or array comparative genomic hybridization. SNP array karyotyping allows genome-wide, high resolution detection of copy number and uniparental disomy at genomic regions with established prognostic significance in CLL, detects lesions missed by FISH, and provides insight into gene dosage at these loci.
Chronic lymphocytic lymphoma (CLL) is a clinically heterogeneous B-cell lymphoid neoplasm with variable clinical course.1 Prognostic factors include clinical staging, lymphocyte doubling time, immunophenotyping for CD38 and ZAP-70, mutational status of the immunoglobulin heavy chain, and specific chromosomal copy number changes. Chromosomal copy number changes are typically assessed clinically using conventional karyotyping and/or a CLL-specific fluorescent in situ hybridization (FISH) panel with probes for 6q22-q23 (MYB), 11q22.3 (ATM), chromosome 12/MDM2, 13q14 (D13S319), and 17p13.1 (TP53). Although conventional karyotyping provides a genome-wide assessment, the resolution is too coarse to reliably detect small deletions.2 Conversely, FISH can assess only those regions of the genome targeted by the panel. Importantly, neither FISH nor conventional karyotyping can distinguish between a normal, bi-parental diploid state and acquired uniparental disomy (aUPD).
Recently, platforms for generating high-resolution karyotypes in silico from disrupted DNA have emerged, such as array comparative genomic hybridization (arrayCGH) and single nucleotide polymorphism (SNP) microarrays. Array-based karyotyping can provide dramatically higher resolution than conventional cytogenetics, does not require cell culture, and avoids subjective interpretation of fluorescent signals. Limitations of array-based karyotyping include the inability to detect balanced translocations and inversions; inability to assess regions of the genome not represented on the array; and decreased performance at low levels of tumor. CLL is an ideal neoplasm to study with copy number arrays because 1) the genetic lesions with known clinical relevance are chromosomal gains and losses rather than balanced translocations and inversions, 2) DNA from a fresh sample is generally available, making the analysis more straightforward than for formalin-fixed paraffin embedded tissue, 3) tumor burden is known from the flow cytometry results and can help guide downstream analysis, 4) tumor burden tends to be relatively high in the peripheral blood, and 5) enrichment for B lymphocytes or CLL cells is simple, cost-effective, amenable to routine clinical use, and minimizes the effect of ‘normal clone contamination.’3
Array-based karyotyping can be done with several different platforms. The arrays themselves can be genome-wide (probes distributed over the entire genome) or targeted (probes for genomic regions known to be involved in a specific disease) or a combination of both. In addition, the probes on the arrays may be polymorphic (ie, SNP-containing) or nonpolymorphic (ie, copy number only probes) or a combination of both. The probe types used for nonpolymorphic arrays include cDNA, BAC clones (eg, BlueGnome LTD, London, UK), and oligonucleotides (eg, Agilent, Santa Clara, CA or Nimblegen, Madison, WI). Commercially available SNP arrays can be solid phase (Affymetrix, Santa Clara, CA) or bead-based (Illumina, SanDiego, CA).
Both copy number only arrays and SNP arrays generate chromosome copy number values by comparing the hybridization intensity value of test versus normal for each probe on the array. The normal values may be obtained from either a patient-matched sample, an anonymous reference sample (single or pooled), or from an in silico reference library. By convention, the comparative hybridization intensity is given as a log2ratio of test/reference. When both the test and the reference sample have a diploid content (2 copies) the log2ratio is 0. The copy number is inferred from the log2ratio obtained from each probe on the array. The analysis software cross-references the address of each probe on the array with the address of each probe in the genome and reconstructs the genome by plotting the log2ratio for each probe in chromosomal order. With higher density arrays, tens to thousands of consecutive probes can be involved in a single genetic lesion, thus increasing the confidence in the call. In addition, with SNP arrays, the genotype at each locus can also be obtained, aligned in chromosomal order, and assessed for consecutive probes without heterozygous calls (ie, loss of heterozygosity, LOH). Because the included SNPs have a >30% rate of heterozygosity, long stretches of homozygous calls would not be expected to occur by chance. Thus, LOH can be inferred from long stretches of no AB calls.
The ability to detect both copy number and LOH is a distinct advantage of SNP arrays for karyotyping tumors, as they can detect both copy loss LOH (ie, a deletion) and copy neutral LOH (ie, gene conversion or aUPD). FISH, conventional cytogenetics, and arrayCGH can only detect copy loss LOH. SNP array karyotyping has revealed that aUPD is a common event in many types of cancer, serving as an alternative to a deletion as the ‘second hit’ in the Knudson two hit hypothesis of tumorigenesis (Figure 1).4,5
Figure 1.

Acquired uniparental disomy. Acquisition of a second hit via deletion (top) versus acquired UPD (bottom). Blue cells represent the FISH results for each scenario. Both arrayCGH and SNP array karyotyping would generate the same blue copy number plot. Loss of heterozygous calls (green bars) and allele-specific analysis (red/green plots) can only be obtained using SNP-based array karyotyping.
Several groups have recently described the performance of array-based karyotyping for detecting clinically relevant chromosomal aberrations in CLL using different types of arrays, including: custom BAC arrays,6,7,8 Affymetrix 10K and 50K SNP arrays,9,10 and custom oligonucleotide arrays.2 Their results demonstrate the feasibility of using array-based karyotyping for prognostic assessment in CLL. Studies using SNP arrays show that aUPD occurs in regions of the genome with prognostic relevance in CLL.9,10 Therefore, SNP arrays were chosen for clinical validation to detect aUPD.
SNP microarrays are available in a range of resolutions from 10,000 to 1.8 million probes, with a 2.7 million probe array anticipated in the near future. In this study, we examined the performance characteristics of three SNP arrays to determine the optimal SNP array probe density for virtual karyotyping of CLL in the clinical laboratory. CLL samples of varying tumor burden were processed on Affymetrix 10K2.0, 250K Nsp, and SNP6.0 arrays. We compared the ability of each array to detect clinically relevant lesions in CLL, the break point resolution, and the detection rate of lesions with uncertain clinical significance (LUS). Other factors considered were ease of data management and analysis, the cost of arrays and reagents, and technologist time. Based on the results of these comparisons, the 250K Nsp array was validated for routine clinical use and a showed a concordance of 98.5% with the standard FISH panel. Importantly, SNP array karyotyping detected clinically relevant genetic lesions that would not be detectable by FISH, conventional cytogenetics, and/or arrayCGH.
Materials and Methods
Samples
All samples were obtained and used in compliance with Institutional Review Board regulations at University of Pittsburgh Medical Center (UPMC) and Creighton University. The array density experiments were performed using archived DNA from peripheral blood samples obtained for routine clinical CLL analysis. The percentage of CD5+/CD19+ CLL cells ranged from 26% to 85% by flow cytometry. The clinical validation cohort consisted of 18 archived DNA samples and 11 clinical samples processed in parallel with the standard CLL FISH panel. CLL FISH panel, cytogenetics, and flow cytometry were performed clinically (all results were not available for all samples). The percentage of CD5+/CD19+ CLL cells in each sample was obtained by multiplying the percentage of cells in the lymphocyte gate by the percentage of CD5+/CD19+ cells. Four additional CLL samples without associated CLL FISH panel or cytogenetics were processed and analyzed by array-based karyotyping (CLL01, CLL04, CLL05, CLL17) but excluded from the clinical validation cohort. For the array density experiments, all eight samples were analyzed on the Affymetrix 10K2.0 array, and six samples were selected for additional analysis on Affymetrix 250K Nsp and SNP6.0 arrays. Virtual karyotypes were generated with the investigator (J.M.H.) blind to the results of FISH/conventional cytogenetics.
Fluorescent in Situ Hybridization and Conventional Cytogenetics
FISH was performed clinically at the UPMC Cytogenetics Laboratory or the University of Nebraska Medical Center Human Genetics Laboratory with the following chromosomal target regions: 11q22.3 (ATM), 12 cen (D12Z3), 12q14.3-q15 (MDM), 13q14 (D13S319), 13q34 (LAMP1), 14q32.3 (IGH), and 17p13.1 (TP53). Samples from UPMC also included a 6q22-q23 (c-MYB) probe in the routine CLL panel (Vysis, Abbott Molecular, Downers Grove, IL). Analyses were performed on bone marrow (n = 1) or peripheral blood (n = 28) samples that had been maintained in culture without stimulation for 24 hours. For each probe, at least 200 interphase nuclei were enumerated. Conventional cytogenetic analysis was performed using standard Geimsa-banding techniques from samples that had either been maintained in culture without stimulation for 24 hours or stimulated with lipopolysaccharide for 72 hours.
B-Cell Enrichment and DNA Extraction
Six peripheral blood samples (CLL08 to CLL13) underwent negative selection, density-based B-cell enrichment before DNA extraction and were processed in parallel with un-enriched counterparts (RosetteSep, Stem Cell Technologies, Vancouver, BC). The expected purity is 83 ± 8% CD19+ cells with a recovery of 71 ± 39% per the manufacturer's product information sheet. The percentage of CD5+/CD19+ cells post enrichment was estimated by first dividing the percentage of CD5+/CD19+ cells by the percentage of B-cells (CD19+/CD3−) and then multiplying by the expected B-cell purity. Genomic DNA was extracted using the Qiagen DNeasy extraction protocol for tissue (bone marrow, n = 1) or blood (peripheral blood, n = 32) according to the manufacturer's instructions (Qiagen, Valencia, CA).
Arrays
SNP mapping assays were performed according to the manufacturer's protocol (Affymetrix, Santa Clara, CA). Briefly, 250 ng of gDNA was digested with XbaI (10K2.0), Nsp (250K), or both Nsp and Sty in independent parallel reactions (SNP6.0) restriction enzymes, ligated to the adaptors, and amplified by PCR using a universal primer. After purification of PCR products with SNPClean magnetic beads (Agencourt Biosciences, Beverly MA), amplicons were quantified, fragmented, labeled, and hybridized to 10K2.0, 250K Nsp, or SNP6.0 arrays. After washing and staining, the arrays were scanned to generate. cel files for downstream analysis. All steps of the assay were performed in two separate laboratories (University of Pittsburgh Clinical Genomics Facility and the Clinical Genomics Laboratory of Creighton Medical Laboratories) to confirm the interlaboratory reproducibility of this platform. Performance of the virtual karyotype was compared with clinical cytogenetics, FISH panel, and to the literature. The samples used for clinical validation were processed on the 250K Nsp array and analyzed in the Clinical Genomics Laboratory at Creighton Medical Laboratories.
Analysis
Affymetrix GeneChip Genotyping Analysis Software (GTYPE4.1) was used for genotype call and quality control assessments for the 10K2.0 and 250K Nsp arrays, and Affymetrix Genotyping Console (GTC3.0.1) was used for genotyping and copy number analysis of the 250K Nsp and SNP6.0 data. The SNP ‘call rate’ is an indicator of overall performance of the assay; it represents the percentage of SNPs on the array that could be successfully genotyped. Samples in this study had an average call rate of 97.8%, exceeding the manufacturer's recommendation of >93%. Virtual karyotypes were generated using CNAG3.011 for 10K2.0 and 250K arrays and CNAG3.2 and Affymetrix GTC3.0.1 for SNP6.0 arrays. The results of the clinical validation study were annotated and compiled using oneClickCGH and CGH Fusion (InfoQuant, Ltd, London, UK) following direct importation of the CNAG3.0, CNAG3.2, and/or GTC3.0.1 data files. CNAG software uses best-fit references selected from a library of normal samples. Our in-house normal library files come from samples processed on the same thermocycler (same laboratory) as well as different thermocyclers (eg, from www.HapMap.org, last accessed on 08/05/2009). The GTC3.0.1 copy number algorithm uses a reference file created from HapMap samples. Performance of the virtual karyotype was compared with results from clinical cytogenetics, FISH panel, and to the literature.
Sequence Analysis of TP53
Primer selection was performed with Mutation Discovery (http://mutationdiscovery.com/md/MD.com/home_page.jsp, Transgenomic, Inc, Omaha, NE, last accessed on 08/05/2009). Primers were designed to amplify exons 2-11 of TP53, exon-intron boundaries. The standard PCR was in performed in a 50 μl reaction [20 ng gDNA template, 15 pmol of each primer, 0.25 mmol/L each dNTP, 2.5 mmol/L MgCl2, 5 units of AmpliTaq Gold polymerase (Applied Biosystems), in 1× Taq Gold buffer (Applied Biosystems)]. For exons 2 and 3, 0.5 × Q solution (Qiagen) was used following the manufacturer's protocol. Touchdown PCR parameters were as follows: 95°C for 12 minutes × 1; 15 cycles of 95°C for 30 s, Tm + 7.5°C for 30 seconds (with −0.5°C per cycle), and 72°C for 30 s; followed by 22 cycles of 95°C for 30 s, Tm for 30 s, and 72°C for 30 s; and a final extension cycle of 72°C for 10 minutes. Specificity and yield of each PCR product was assessed by gel electrophoresis (2% agarose, 1× TAE buffer).
Denaturing high-performance liquid chromatography analysis was performed on a WAVE System (Transgenomic, Omaha, NE). Each PCR product was denaturated for 5 minutes at 95°C and then gradually re-annealed by decreasing the sample temperature from 95 to 25°C (with a temperature ramp of 1°C/min) over a period of 70 minutes. Two to five μl of PCR product was then applied to a pre-heated C18 reverse-phase column (DNASep, Transgenomic) and eluted with a mobile phase consisting of a mixture of 0.1 mol/L Triethylammonium acetate (TEAA) pH 7.0 (Transgenomic) and 0.1 mol/L TEAA with 25% acetonitrile in a linear gradient, at a flow rate of 1.5 ml/min. The conditions for mutation analysis were based on the melting behavior of the wild-type amplicon sequence.12 Temperature for successful resolution of heteroduplex molecules was determined by using the WAVE NAVIGATOR software (Transgenomic) and the Stanford denaturing high-performance liquid chromatography program. PCR amplicons showing abnormal denaturing high-performance liquid chromatography patterns were sequenced directly by chain termination sequencing on an ABI 3100 (Applied Biosystems). Sequencing data were analyzed by using the Sequencher program (Gene Codes, Ann Arbor, MI).
Results
Effect of Array Density on Ability to Detect Clinically Relevant Lesions in CLL
DNA from six CLL samples was processed on Affymetrix10K2.0, 250K Nsp, and SNP6.0 arrays to assess whether there were differences in the ability to identify clinically relevant genetic lesions. The virtual karyotypes were evaluated for the following: detection of cytogenetically confirmed aberrations, performance at low tumor percentage, detection of copy number variants (CNVs) and lesions of uncertain significance (LUS), break point resolution, and genes included in a deletion. The sample characteristics and array performance are summarized in Table 1. The percentage of tumor cells (CD5+/CD19+) present in each sample ranged from 26% (CLL32) to 85% (CLL33). One sample (CLL29) had no genetic abnormalities detected by the standard CLL FISH panel. The 10K2.0 array failed to detect a 976kb 13q14 deletion in CLL30 (41% CLL cells), and thus lacks adequate resolution to reliably detect small 13q14 deletions. There was not enough genomic DNA from CLL30 to analyze it on the SNP6.0 array.
Table 1.
Characteristics of Samples Used to Compare Performance of 10K2.0, 250K Nsp, and SNP6.0 Arrays
| FISH Panel |
Array |
||||||||||
|---|---|---|---|---|---|---|---|---|---|---|---|
| CLL# | %CLL CD19+/ CD5+ | MYB 6q22-q23 | ATM 11q22.3 | MDM2 12q14.3-q15 | 13q 13q14.3/ 13q34 | IgH 14q32.3 | p53 17p13.1 | 10K2.0 | 250K | 6.0 | Comment |
| CLL28 | 0.67 | 2.4% | 79.8% | 73.0% | 0.0% | 0.5% | 0.0% | OK | OK | OK | FISH missed 13q14 deletion |
| CLL29 | 0.44 | 1.5% | 0.0% | 0.0% | 2.9% | 0.0% | 2.0% | OK | OK | OK | |
| CLL30 | 0.41 | 2.0% | 1.0% | 0.0% | 62.7% | 1.5% | 0.0% | Fail | OK | ND | 10K resolution too low |
| CLL31 | 0.66 | 1.0% | 86.0% | 0.0% | 2.0% | 0.0% | 0.0% | OK | OK | OK | |
| CLL32 | 0.26 | 1.5% | 1.0% | 23.1% | 0.0% | 1.5% | 1.0% | OK | OK | Fail/OK | SNP6.0 fails at low percent tumor using GTC |
| CLL33 | 0.85 | 0.5% | 0.5% | 0.0% | 95.3% | 0.0% | 0.0% | OK | OK | OK | |
The percentage of cells showing significant abnormalities by FISH are underlined.
CLL32 was used to compare the performance of each array density at low tumor burden (Figure 2). CLL32 had a cytogenetically confirmed trisomy 12 present in 23% of cells by FISH (26% CD5+/CD19+ CLL cells by flow cytometry). The trisomy 12 was clearly detected by visual examination of the log2ratio plot and the copy number Hidden Markov Model (HMM) using the data from the 10K2.0 array. The copy number HMM stutters when the same sample is analyzed with the 250K Nsp array, but the trisomy is still detectable by visual inspection of the log2ratio plot. For the SNP6.0 array, neither the copy number HMM (GTC3.0.1) or the segment reporting tools (GTC3.0.1 and oneClickCGH) detected the trisomy 12 in this sample. This trisomy was robustly detected by CNAG3.2. The CNAG software detected the low-level trisomy 12 using data from all three array densities. Thus, the choice of analysis software can significantly impact results.
Figure 2.
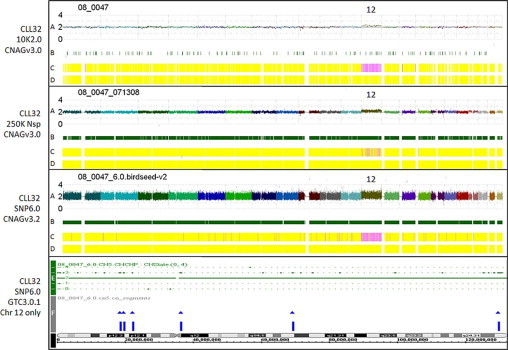
Comparison of array density and software performance at a low percentage of CLL cells. CLL32 has a cytogenetically-confirmed trisomy 12 as the only genetic lesion (26% CLL cells by flow cytometry). Four karyotypes from different array densities and softwares are shown. GTC software cannot provide an equivalent whole genome image, so only chromosome 12 is shown (bottom plot). Graph Key: A: Linear log2ratio (copy number) smoothed over 10 SNPs is plotted in chromosomal order along the x axis (chromosome 1 on the left, chromosome 22 on the right). B: Heterozygous call bars indicating an AB genotyping call made in the tumor sample at that SNP. C: Hidden Markov Model (HMM) for copy number with dark blue = 0, aqua = 1, yellow = 2, pink = 3, pink-red = 4, red-pink = 5, and bright red >5. D: HMM for LOH likelihood with yellow = low LOH likelihood, blue = high LOH likelihood. E: Copy number HMM generated by GTC3.0.1. F: Segment report results obtained with the GTC3.0.1 segment reporting tool.
The Affymetrix SNP6.0 array has 202,000 probes targeting 5677 CNV regions from the Toronto Database of Genomic Variants, and thus is enriched to detect copy number variants. At the time of this writing, there is no clinical utility to detecting these variants, and, in fact, they result in a complicated report that can obscure the clinically actionable genetic lesions. The Affymetrix GTC3.0.1 analysis package was used to compare the detection rate of clinically relevant lesions and CNV/LUSs in the 5 CLL samples that were run on all three arrays. The 250K Nsp array detected all clinically significant genetic lesions in the array density cohort, as validated by FISH and/or cytogenetics. The SNP6.0 array did not detect clinically relevant lesions missed by 250K Nsp arrays and there was no clinical significance to the higher break point resolution of the SNP6.0 array. However, the SNP6.0 array identified an average of 21.4 autosomal LUS/CNVs per sample, while the 250K Nsp array identified an average of seven autosomal LUS/CNVs per sample.
We compared the break point resolution of the different arrays at the 11q and 13q14 loci. Of the five samples run on all three arrays, only three had 11q or 13q14 deletions providing a total of four lesions for genomic position break point comparison. Using the genomic break points and width of deletion obtained from the SNP6.0 as the point of reference, width differences were calculated for each density of array for each deletion (Table 2). The break point differences between the 250K Nsp and SNP6.0 did not affect the set of CLL-implicated genes included in the deletion.
Table 2.
Width Differences of Deletions
| Comparison | Width difference (kb) | % of total width |
|---|---|---|
| Inter-run, 250K | 24 ± 28 | 1.4% |
| Inter-lab, 250K | 105 ± 199 | 11.6% |
| 10K versus 250K | 718 ± 524 | 32.4% |
| 250K versus 6.0 | 74 ± 50 | 3.8% |
| 250K CNAG versus GTC | 81 ± 34 | 3.8% |
Thus, the SNP6.0 array is superior to the 250K Nsp array for detecting small aberrations of uncertain significance. However, the SNP6.0 array is equivalent to 250K Nsp array for detecting clinically relevant lesions in CLL. Due to its relatively poor resolution, the 10K2.0 array is not suitable for routine clinical use for CLL prognostic assessment. Operational costs are an important consideration for array-based assays due to current limited reimbursement in the United States with existing CPT codes. The cost for 10K2.0 and 250K Nsp arrays are 60% and 35%, respectively, of the 6.0 platform. Based on these data and considerations, the 250K Nsp array was felt to offer the best combination of clinical resolution and cost-effectiveness. An additional 27 samples were studied comparing FISH and 250K Nsp array results as a clinical validation cohort.
Clinical Validation Study: Concordance, Sensitivity, and Specificity
The overall concordance of the 250K Nsp virtual karyotypes and the CLL FISH panel was 98.5% based on 134 FISH probe hybridization events (Table 3). Discordant events occurred in two samples, each with a low percentage of cells harboring the abnormality: CLL12 had a 13q14 deletion (16%) and CLL13 had a 17p13 deletion (11%) by FISH, yet neither was detected by SNP array karyotype. This was unexpected because all B lymphocytes in these samples were CLL cells, and both samples underwent B-cell enrichment. Possible explanations include over-estimation of the percentage of cells carrying the deletion by FISH or laboratory errors at the enrichment step. Considering all samples, the sensitivity of the 250K Nsp array for detecting CLL FISH panel abnormalities was 92.3% with no limit placed on the minimum percentage of CLL cells.
Table 3.
Clinical Validation Cohort
| CLL FISH panel |
||||||||
|---|---|---|---|---|---|---|---|---|
| Sample | % CLL | 6q23 | 11q22.3 | 12 | 13q14 | 17p | Other 1 | Other 2 |
| CLL02 | 77% | n/d | 97% | 89% | ||||
| CLL03 | 85% | n/d | 51% | |||||
| CLL06 | 66% | n/d | 90% | |||||
| CLL07 | 47% | n/d | 67% | 70% | ||||
| CLL08-E | 17% | n/d | 56% | |||||
| CLL09-E | 11% | n/d | 5p gain (62%) | 7q loss (78%) | ||||
| CLL10-E | 74% | n/d | 66% | |||||
| LPL11-E | 27% | n/d | 62% | |||||
| CLL12-E | 35% | n/d | 16% | |||||
| CLL13-E | 37% | n/d | 70% | 11% | ||||
| CLL14 | 90% | n/d | ||||||
| CLL15 | 61% | 34% | ||||||
| CLL16 | 65% | 3q gain CG | ||||||
| CLL18 | 69% | |||||||
| CLL19 | 36% | 26% | ||||||
| CLL20 | 88% | 17% | ||||||
| CLL21 | 73% | 62% | ||||||
| CLL22 | 94% | 98% | ||||||
| CLL23 | 12% | 7q loss CG | 10q loss CG | |||||
| CLL24 | 43% | 14 loss CG | ||||||
| CLL25 | 59% | 69% | ||||||
| CLL26 | 87% | 95% | ||||||
| CLL27 | 85% | 92% | ||||||
| CLL28 | 67% | 80% | 73% | |||||
| CLL29 | 44% | |||||||
| CLL30 | 41% | 63% | ||||||
| CLL31 | 66% | 86% | ||||||
| CLL32 | 26% | 23% | ||||||
| CLL33 | 85% | 95% | ||||||
| Samples with gain/loss | 3 | 6 | 16 | 1 | ||||
| Percent | 10.3% | 20.7% | 55.2% | 3.4% | ||||
CLL FISH panel columns indicate % abnormal cells detected using standard FISH panel. Other indicates additional abnormalities seen (if any) with an extended FISH panel. Bolded underlined text indicate deletions that were detected by FISH but not detected by 250K Nsp array-based karyotyping. The percentage of cells each sample with the gain/loss as determined by FISH is given in each box.
CG, conventional cytogenetics; nd, not done; E, enriched for B cells; %CLL, percentage of cells marking CD19+/CD5+.
A B-cell enrichment strategy was used for samples CLL08 to CLL13, as these samples were obtained as peripheral blood rather than archived DNA. A demonstration of the effectiveness of B cell enrichment for CLL has been published elsewhere.3 For samples undergoing enrichment, the average estimated percentage of CLL cells present in the sample post enrichment was 80% (57% to 89%). If the other samples in our cohort had undergone enrichment before DNA extraction, the average percentage of CLL cells would have been 79% (53% to 87%).
Four CLL samples were negative for chromosomal abnormalities by FISH panel. The virtual karyotypes for these loci also showed no copy number abnormalities. In addition, 14 non-neoplastic samples were processed by the same protocol in the same laboratory and all produced normal/diploid karyotypes (data not shown). The peripheral blood from CLL0 contained only 1.6% CLL cells by flow cytometry and generated a normal/diploid virtual karyotype.
Three samples in the validation cohort did not have chromosomal gains/losses identified by the standard CLL FISH panel, but they did have genetic abnormalities detected by an extended FISH panel or conventional cytogenetics (Table 3, right panel). All chromosomal gains and losses were concordant with the virtual karyotypes results. Figure 3 shows the whole genome view of CLL09, a sample that had no abnormalities detected by the standard CLL FISH panel. In contrast, the SNP array karyotype captures the genomic complexity of this particular CLL sample, including acquired UPD at 1q32.1-q44 and 10q.
Figure 3.

Whole genome view of CLL09 using 250K Nsp SNP array. This CLL sample did not show any copy number abnormalities by the standard CLL FISH panel. Graph key: Plots (A) and (B) are as described in Figure 2, with a log2ratio of zero = copy number of 2. C: Allele-specific copy number analysis in which each allele is plotted separately. In a normal/diploid region, both the red and the green plots will run along the zero line, indicating that there is one copy of each for an overall copy number of two. In regions of UPD, there are two copies of the red allele and zero copies of the green allele for an overall copy number of two. This is supported by the HMM plots and the lack of heterozygous call bars in the region (black arrowheads); D = copy number HMM; and E = LOH likelihood HMM.
Assay precision was tested by processing three samples in different runs (interrun reproducibility) and five samples in different laboratories (interlaboratory reproducibility). In both experiments, all of the genomic abnormalities were accurately replicated in all samples and cytogenetic break points were identical. Interestingly, break points at the level of genomic position did not show complete fidelity (Table 2), although they did include the same set of CLL-implicated genes in each genetic lesion.
Quality Assessment of Downstream Analysis
The call rate is an indicator of the overall performance of the assay and represents the percentage of SNPs on the array that could be successfully genotyped. The manufacturer's protocol recommends a minimum call rate of 93% for samples undergoing downstream analysis. The samples used in this study had an average call rate of 97.8%. The CNAG3.0 software used for copy number and LOH analysis uses best-fit references selected out of a library of data files from normal samples. Our in-house library of normal data files consists of samples processed on the same thermocycler (same laboratory) and those run on different thermocyclers (eg, from www.HapMap.org, last accessed on 08/05/2009). One metric of the quality of the virtual karyotype is the SD of the log2ratio. When the software was limited to selecting best-fit references from HapMap samples, the average SD of the log2ratio for all samples in the clinical validation study was 0.276 (range 0.229 to 0.342). When the software was allowed to select the best-fit references for each sample from the entire library, it always selected normals that were run on the same thermocycler, and the average SD of the log2ratio dropped to 0.211 (range 0.150 to 0.274). Thus, compiling a library of normal reference samples processed on the same thermocycler as the clinical samples resulted in higher quality virtual karyotypes when using the CNAG3.0 software. The effect of in-house normals on the SD of the log2ratios obtained via GTC3.0.1 could not be assessed because the software does not provide this information.
The ability to correctly quantify the number of copies lost or gained was a function of the software package used for analysis and not the array density. With both 250K Nsp and SNP6.0 data files, GTC3.0.1 failed to correctly call a FISH-confirmed 13q14 homozygous deletion as nullisomy in CLL33. CNAG software correctly detected this as nullisomy of 13q14. When FISH-confirmed homozygous deletions were present (n = 7), CNAG software detected them with 100% sensitivity. GTC3.0.1 failed to identify the deletions as homozygous with either 250K Nsp data or SNP6.0 data.
Atypical Deletions
Atypical deletions are those that do not include the FISH probe hybridization site, but do include genes implicated in the pathogenesis of CLL. In this study, atypical deletions were detected at the 11q22.3 and 13q14 loci. The genomic break points for all genetic lesions for samples in this study are available in Supplemental Table S1 at http://jmd.amjpathol.org. An atypical 11q22.3 deletion was detected in sample CLL05. This deletion did not include the FISH probe hybridization site for the ATM FISH probe, but did include RDX and FDX1 genes, which have both been implicated in the pathogenesis of CLL.13 In addition, four CLL samples in our study had deletions at 11q22.3 that were centromeric to ATM and not included in the FISH probe hybridization site (CLL03, CLL07, CLL09, CLL33). An atypical 13q14 deletion was identified in sample CLL28, which had a 7.9Mb 13q14 deletion not detected by the commercial FISH probe for this locus. The genomic break points for this deletion include the RB1 and RCBTB2 genes, but it does not include other CLL-implicated genes at this locus, such as TRIM13, DLEU1, DLEU2, C13orf1, RCBTB1, and SETDB2 and micro-RNAs mir-15a and mir-16-1.14,15
Uniparental Disomy
Four samples demonstrated UPD at regions with clinical relevance in CLL. Sample CLL06 had a 17 Mb region of acquired UPD spanning most of the p arm of chromosome 17, including the TP53 locus. Sequence analysis of key exons in TP53 detected a homozygous R248Q mutation, which is one of the most common somatic mutations in TP53.16 This confirms that the acquired UPD seen at 17p represents two mutated copies of TP53. Sample CLL23 showed a 4.8 Mb region of homozygosity spanning 11q22.3 including ATM, RDX, and FDX1 genes. The robustness of the allele-specific log2ratios suggests that this is a germline segment of autozygosity rather than acquired UPD. Samples CLL25 and CLL27 both demonstrated 13q UPD with homozygous deletions of 13q14.
13q14 Length and Copy Number Heterogeneity
The percentage of CLL cases in this study with 13q14 deletion was 55% (n = 18) by SNP array karyotyping. The deletion was mono-allelic in nine cases, bi-allelic in one case, and mixed mono- and bi-allelic in seven cases. Deletion sizes ranged from 0.812 Mb to 31.369 Mb (average 3.65 Mb) and genomic break points of each are provided in Table 4. In addition to length heterogeneity, each 13q14 allele may have different break points. This results in copy number/gene dosage heterogeneity at the 13q14 locus. Figure 4 shows examples of copy number and/or length heterogeneity at the 13q14 locus and highlights the variability in gene dosage at the 13q14 locus.
Table 4.
13q14 Genomic Position Break Points
| FISH | Sample | CLL% | Chr | Start (Mb) | Stop (Mb) | Mb | Gain/loss | ISCN nomenclature (Mb) | Comment |
|---|---|---|---|---|---|---|---|---|---|
| ND | CLL01 | 44% | 13 | 46.2987 | 50.3930 | 4.094 | Loss | arr cgh 13q14.2q14.3(46.29874->50.39298)×1 | No FISH or CG |
| 51% | CLL03 | 85% | 13 | 49.4434 | 50.3801 | 0.937 | Loss | arr cgh 13q14.3(49.44335->50.38009)×0∼1 | |
| ND | CLL05 | 69% | 13 | 49.5071 | 50.7293 | 1.222 | Loss | arr cgh 13q14.3(49.50706->50.72928)×1 | No FISH or CG |
| 90% | CLL06 | 66% | 13 | 48.1926 | 50.9431 | 2.750 | Loss | arr cgh 13q14.2q14.3(48.19262->50.94309)×1 | |
| 70% | CLL07 | 47% | 13 | 49.5952 | 50.3930 | 0.798 | Loss | Arr cgh 13q14.3(49.59519->50.39298)×0 | |
| 56% | CLL08-E | 17% | 13 | 49.5071 | 50.2706 | 0.763 | Loss | arr cgh 13q14.3(49.50706->50.27055)×0∼1 | |
| 66% | CLL10-E | 74% | 13 | 47.8443 | 51.0717 | 3.227 | Loss | arr cgh 13q14.2q14.3(47.84428->51.07168)×1 | |
| 16% | CLL12-E | 35% | 13 | Loss | del 13q14 by FISH | ||||
| 70% | CLL13-E | 37% | 13 | 49.2442 | 50.7183 | 1.474 | Loss | arr cgh 13q14.3(49.24423->50.71834)×1 | |
| 26% | CLL19 | 36% | 13 | 48.1047 | 79.4740 | 31.369 | Loss | arr cgh 13q14.2q31.1(48.10474->79.47401)×1 | |
| 17% | CLL20 | 88% | 13 | 48.0631 | 49.0213 | 0.958 | Loss | arr cgh 13q14.2q14.3(48.06305->49.02132)×1 | |
| 62% | CLL21 | 73% | 13 | 49.5071 | 50.3801 | 0.873 | Loss | arr cgh 13q14.3(49.50706->50.38009)×0∼1 | |
| 98% | CLL22 | 94% | 13 | 45.8033 | 50.4834 | 4.680 | Loss | arr cgh 13q14.12q14.3(45.80327->50.48339)×1 | |
| 69% | CLL25 | 59% | 13 | 49.5071 | 50.3930 | 0.886 | Loss | arr cgh 13q14.3(49.50706->50.39298)×0∼1 | |
| CLL25 | 59% | 13 | 18.2098 | 114.0634 | 95.854 | UPD | arr cgh 13q11q32(18.20978->114.063361)UPD | UPD 13q | |
| 95% | CLL26 | 87% | 13 | 49.4042 | 50.3192 | 0.915 | Loss | arr cgh 13q14.3(49.4023->50.31915)×1 | |
| 92% | CLL27 | 85% | 13 | 49.5071 | 50.4877 | 0.981 | Loss | arr cgh 13q14.3(49.50706->50.48768)×0∼1 | |
| CLL27 | 85% | 13 | 18.2098 | 114.0634 | 95.854 | UPD | arr cgh 13q11q32(18.20978->114.063361)UPD | UPD 13q | |
| CLL28 | 67% | 13 | 40.4761 | 48.4013 | 7.925 | Loss | arr cgh 13q14.11q14.2(40.4761–>48.40126)×1\t(9;13), loss of RB1 on 13q | ||
| 63% | CLL30 | 41% | 13 | 49.4041 | 50.3801 | 0.976 | Loss | arr cgh 13q14.3(49.40406–>50.38009)×0∼1 | |
| 95% | CLL33 | 85% | 13 | 49.5071 | 50.3192 | 0.812 | Loss | arr cgh 13q14.3(49.50706–>50.31915)×0∼1 |
Genetic lesions detected by FISH, but not identified by array karyotyping, are bolded. Genetic lesions detected by array karyotyping, but not identified by FISH, are bolded and italicized.
Figure 4.
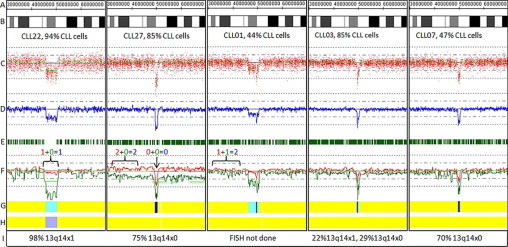
Copy number and length heterogeneity at the 13q14 locus in CLL. Genomic position (A); ideogram (B); raw log2ratios for each probe (C); smoothing average of log2ratio over 10 probes (D); heterozygous call bars (E); allele-specific analysis (F) (AsCNAR algorithm), as in Figure 3; hidden Markov model for copy number (G), as in Figure 2; hidden Markov Model for LOH likelihood (H) as in Figure 2; and FISH results (I) for 13q14 locus. The percentage of CLL cells present in the sample as determined by flow cytometry is provided below the ideogram. CLL22: heterozygous deletion; CLL27: homozygous deletion with aUPD of 13q; CLL01, CLL03, CLL07: Examples of partially heterozygous and partially homozygous deletions.
Discussion
Copy number changes are detectable by FISH analysis in 50 to 80% of CLL samples, and are commonly used as prognostic indicators in this disease. If a CLL patient has poor prognostic factors, such as 11q or 17p deletion, a more aggressive treatment might be selected. Conversely, no chromosomal abnormalities or an isolated 13q14 deletion may support a “watch and wait” approach to patient management. Conventional cytogenetics and FISH, although useful for detecting copy number changes, have either limited resolution or breadth of coverage. Array-based karyotyping combines both increased resolution and genomic coverage into a single robust, relatively inexpensive, high-yield assay for clinical use in CLL prognostication. SNP arrays, in particular, detect both copy number abnormalities and copy neutral events, such as UPD that cannot be identified by copy number only platforms such as FISH or arrayCGH.10,17
The objective of this study was to determine which SNP array density was best suited for routine clinical detection of copy number alterations in CLL patients and to establish performance characteristics for these arrays. Our studies have demonstrated that virtual karyotypes from Affymetrix SNP6.0 arrays achieve higher resolution, but are no more clinically informative than results obtained from less costly and easier to manage 250K Nsp arrays. Maciejewski et al5 have reported similar conclusions regarding array density. The lower resolution 10K2.0 arrays also performed well but lacked sufficient resolution to detect a small 13q14 deletion in one sample. Data from 10K2.0 and 250K arrays were also considerably easier to manipulate and evaluate with existing software and both of these platforms were less expensive in terms of arrays, associated reagents, and technologist time required.
Based on these considerations, we validated the Affymetrix 250K Nsp arrays for clinical use, demonstrating 98.5% concordance with CLL FISH panel results. Other studies using array-based karyotyping to evaluate CLL have also reported high concordance with FISH panel results, and instances of nonconcordance were explained by low tumor burden (<25 to 30% CLL cells in the sample), the presence of small subclones, array resolution, and/or differences in the populations of cells used for each assay.2,6,7 Sensitivities of 100% with >25% CLL cells in the sample2,6 or 100% with >53% tumor8 have been reported in other array-based karyotyping studies of CLL.
Tumor Burden and Software Considerations
It is important to understand the strengths and limitations of different array platforms, densities, and analysis tools when using array-based karyotyping as a clinical test for CLL. Virtually all clinical tumor samples contain some ‘normal clone contamination’ from non-neoplastic cells. This will dampen the signals from the tumor and cause failure of both copy number and genotyping algorithms. The exact point of failure of a copy number algorithm, in terms of the ratio of tumor/normal cells, will depend on the particular platform and algorithm. For example, the GTC software from Affymetrix failed to identify a low-level trisomy (Figure 2) and could not reliably distinguish between heterozygous and homozygous deletions (data not shown), while an alternative software option (CNAG) could discriminate between these clinically relevant genetic lesions. Furthermore, genotyping algorithms optimized for SNP array whole genome association studies, such as BRLMM used by Affymetrix GTYPE software for 250K array data, tend not to tolerate ‘normal clone contamination’ greater than ∼20%. In such cases, heterozygous call bars will be partially or fully maintained in a region of copy loss and the HMM for LOH will not trigger (Figure 4, compare CLL22 to CLL01).
To overcome these limitations, we use a copy number algorithm developed for Affymetrix SNP array data files that uses allele-specific copy number from anonymous references (AsCNAR), which is optimized for use on samples with normal clone contamination.11 It is an algorithm that is based on both heterozygous SNP calls in tumors (thus, not confounded by normal clone contamination) and hybridization intensity values. Titration studies show robust performance of the AsCNAR algorithm down to 20% tumor cells.11 Thus, when analyzing samples with <80% tumor cells, LOH can be reliably inferred from the AsCNAR plot. In addition, we have incorporated B-cell enrichment before DNA extraction.3 In our hands, enrichment for B cells enables more equitable comparisons of log2ratios among samples and also helps resolve lesions in samples with low tumor burden or small subclones. With these optimizations, the sensitivity of SNP array karyotyping approaches that of FISH for CLL prognostic assessment while retaining its additional advantages.
Gunn and colleagues6 found that ∼80% of CLL cases had genomic lesions with prognostic significance by aCGH and recommend that such cases can be signed out without additional testing. In the 20% of cases found to be normal by aCGH, approximately half of these had clonal cell populations below the detection limit (30% in their study) that could be identified by FISH. Thus, a cost-effective clinical algorithm may be to perform array-based karyotyping as the first-line test and triage negative samples for FISH testing to rule-out low-level clones.
250K Nsp Array Provides Adequate Resolution for CLL Prognostic Assessment
The 250K Nsp array and the SNP6.0 arrays both have adequate theoretical and practical resolution to detect the known, clinically relevant chromosomal lesions in CLL. The 250K Nsp array has a mean intermarker distance of 11 kb (median 4.8 kb), providing a theoretical resolution of ∼ 11 kb. However, if analysis parameters are set to require 10 consecutive SNPs, the practical resolution of the 250K Nsp array is ∼110 kb. The SNP6.0 array has 1.8 million polymorphic and non-polymorphic markers with a mean intermarker distance of 1.7 kb (median 670 bases) providing a theoretical resolution of ∼1 kb and a practical resolution of 10 to 20 kb.
We compared the break point resolution of the different arrays at the 11q and 13q14 loci. The average difference between deletion sizes determined with the 250K Nsp array and those determined with the SNP6.0 array was 74 kb (SD 50 kb) or 3.6% of the total deletion width. This variability in break point resolution is comparable with what we saw with interrun samples, interlaboratory samples, and even intersoftware analysis of the same data file (Table 2). Importantly, the break point differences between the 250K Nsp and SNP6.0 did not affect the cytoband break points or the set of CLL-implicated genes included in the deletion. Thus, the 250K Nsp and SNP6.0 arrays generated virtual karyotypes with identical clinical relevance.
The smallest minimally deleted region with known clinical significance in CLL is at the 13q14 locus. The consensus minimally deleted region for 13q14 is approximately 600 kb between chromosomal locations D13S273 and D13S25.15 However, various reports describe smaller regions in the 350 to 550 kb range18,19,20 based largely on observations from one or two cases. The ∼600 kb consensus 13q14 minimally deleted region has 79 SNPs on 250K Nsp array within that region. Likewise, there are 36 SNPs on this array in the 347kb 13q14 MDR reported by Migliazza et al20 Hehir-Kwa et al21 performed a statistical power analysis to determine how many consecutive probes are needed to detect a single copy loss or gain using the Affymetrix 250K Nsp array. They determined that four consecutive probes are needed to detect a copy number loss while seven consecutive probes are needed to detect a gain (95% power). They determined that the probability of detecting a 300 kb single copy number loss is 0.95 and single copy number gain is 0.94. Based on the SNP coverage of the 250K Nsp array at the smallest minimally deleted region (36 probes), the number of probes needed to reliably detect a deletion on the 250K Nsp array, (4) and the probability of detecting a 300 kb deletion with a 250K Nsp array (0.95), it was determined that the 250K Nsp array has adequate resolution for clinical use in CLL. This is supported by the results of array density comparisons reported in this study.
Deletions at Clinically Relevant Loci Not Detected by FISH
The ability to detect chromosomal deletions missed by commercial FISH panels is a significant advantage of array-based karyotyping. As depicted in Figure 3, a targeted FISH panel may fail to capture genomic complexity. Acquisition of additional genomic aberrations is indicative of clonal evolution, which has been shown by Stilgenbauer and colleagues22 to shorten CLL survival in CLL to a median of 21.7 months. Gunn and colleagues6 reported that 21% of patients in their CLL cohort had significant genome-wide aberrations involving loci not interrogated by conventional commercially available FISH panels, making genomic complexity the second most common cytogenetic prognostic marker, exceeded only by the frequency of 13q14 deletions. In our cohort, 7/33 (21%) of cases also demonstrated genomic aberrations at loci that are not assessed by the standard FISH panel.
In addition to missing genomic complexity when using a targeted FISH panel, the region-specific FISH probes may fail to detect a deletion, if the deletion break points do not include the FISH probe binding site. For example, the loss of the ATM tumor suppressor gene (TSG) at 11q22.3 is often implicated in the pathogenesis of CLL, and the FISH probe used by many cytogenetics laboratories in their CLL FISH panel (Vysis LSI ATM) hybridizes to a ∼500 kb sequence that spans the entire ATM gene, as well as CUL5, ACAT, and NPAT. However, it is thought to be unlikely that ATM is the sole cause of the 11q abnormality since the minimally deleted region of 11q contains other potential candidate TSGs, such as RDX and FDX1,13 and not all CLL patients with deletions of 11q have evidence of an ATM mutation in the remaining allele.15 There is also evidence, including data from SNP arrays,10 suggesting a slightly more telomeric but overlapping region that does not include ATM may be involved in the pathogenesis of CLL.15,23,24 Sample CLL05 in this study showed a nonstandard 11q22.3 deletion with a proximal break point telomeric to the ATM gene, thus including RDX and FDX1 genes but not the ATM gene. This deletion was not detected by the 11q22.3 FISH probe. Gunn et al25 recently highlighted atypical 11q deletions, one of which was telomeric to ATM and included the RDX and FDX1 genes, similar to our sample CLL05. In addition, four CLL samples in our study had deletions at 11q22.3 centromeric to ATM and not included in the FISH probe hybridization site (CLL03, CLL07, CLL09, CLL33). None of these contained ATM, RDX, or FDX1 and the distal genomic position break points were centromeric to the ATM gene. The clinical significance of these atypical 11q22.3 deletions has yet to be explored. However, it seems unlikely that a single FISH probe can capture all clinically relevant genetic lesions at this locus.
The Importance of Acquired Uniparental Disomy in Cancer
Surprisingly, copy neutral LOH (aUPD) has been reported to constitute as much as 50% to 80% of the LOH seen in human cancers, both solid and liquid.4,26,27,28,29,30 Acquired UPD can be due to segmental deletions and subsequent replacement of the lost fragment by a copy of the remaining allele or mitotic recombination during carcinogenesis.5 The term “gene conversion” may also be used when referring to smaller, gene locus–sized regions.31 Genomic regions that undergo UPD are likely to contain important genes that drive neoplastic transformation and give the cells a competitive growth advantage.32 When mutation precedes mitotic recombination, aUPD can act as the ‘second hit’ of the Knudson two-hit hypothesis, similar to a deletion, resulting in no functional copies of a TSG (Figure 1).33 In addition, aUPD may lead to the duplication of an activating somatic mutation or homozygosity for a disease-prone minor allele present in the germ line DNA.5 Acquired UPD can also result in duplication or deletion of a methylation pattern that impacts gene expression5 or in the duplication of an allele carrying a deleted region (the ‘first hit’), thus converting it into a homozygous deletion (the ‘second hit,’ Figure 4, CLL27).
There is mounting evidence in the literature that detection of aUPD in cancer is clinically relevant and desirable. A recent review summarizes bi-allelic mutations that have been reported in regions of aUPD in hematological malignancies.5 Examples include, the acquired activating mutation of the JAK2 tyrosine kinase in myeloproliferative disorders and homozygous mutations of the WT1, FLT3, CEBPA, and RUNX1 genes in acute myeloid leukemia.5,32 Yin et al34 reports that 17p aUPD is nearly as common as 17p deletion in glioblastoma, and that ∼70% of cases with aUPD in 17p harbored a homozygous inactivating point mutation of TP53. Glioblastoma patients with either a TP53 deletion or aUPD demonstrated significantly shorter survival time. Additionally, Tuna and colleagues4 have summarized the mechanisms underlying UPD in cancer, its reported frequency, and the biological consequences.
In our study, SNP array karyotyping identified aUPD of most of the p arm of chromosome 17 in sample CLL06. Sequence analysis of TP53 in this sample confirmed that the region of UPD on 17p corresponded to two mutated copies of the TP53 (homozygous R248Q), and thus has the same clinical significance as a 17p deletion in CLL prognostic assessment (Figure 1). Acquired UPD of 17p in CLL patients has also been reported by others.10,17
In the context of the Knudson two-hit hypothesis, aUPD suggests that a homozygous mutation may be present in an underlying TSG, just as FISH suggests that the remaining allele of a tumor suppressor gene may carry a disabling point mutation (Figure 1). Not all aUPD is pathogenetic nor are all deletions. However, the ability to detect UPD is a key advantage of SNP array karyotyping, since UPD at specific loci (eg, TP53) would suggest the possible presence of a clinically relevant homozygous mutation, which could then be verified by other methods. If a copy number only technique is used, this possibility is never raised. Our case CLL06 is an example in which SNP array karyotyping could identify a TP53 abnormality that current testing methods would not detect. This has a direct impact on patient management decisions sinceTP53 status in CLL is a prognostic indicator for response to therapy, disease progression after therapy, survival, and is the major determinant of response to MDM2 inhibitors in CLL.17
In our study, UPD was also detected at 11q22.3/ATM (CLL23). Deletion of 11q is considered a high-risk genetic defect and an independent indicator of poor prognosis.35 Acquired UPD at the 11q locus has not been reported by other groups. The robust allele-specific log2ratio for this lesion suggests that this is an autozygous (germline) region of homozygosity rather than aUPD in cancer cells. The clinical relevance of an autozygous segment,36 which encompasses several TSGs in the 11q22 region is currently unknown, but it may be associated with an increased cancer risk in individuals carrying many autozygous segments.31,37
We also detected aUPD of the q arm of chromosome 13 in two cases (CLL25, CLL27). The aUPD converted the original heterozygous deletion at 13q14 to a homozygous deletion with identical break points on both alleles (Figure 4, CLL27).3 Thus the aUPD of 13q reflects clonal evolution, and it was detected by FISH as a homozygous deletion of 13q14 in both cases. However, depending on the break point on each allele (see Figure 4), clonal evolution at the 13q14 locus may or may not be detected by a single FISH probe. Other groups using SNP array karyotyping to study CLL have reported the similar findings in samples with homozygous 13q14 deletions.9,10
Copy Number and Length Heterogeneity at 13q14 in CLL
Deletion of 13q14 in CLL is not monolithic, but can vary in both copy number and length. The loss of chromosomal material, including the genomic marker D13S319 on chromosome 13 (known as deletion 13q14), is the most common cytogenetic abnormality by FISH analysis in CLL (55%).14,15 Mono-allelic deletion of 13q14 carries a favorable prognosis when it is the sole abnormality.38 Studies evaluating the impact of bi-allelic or mixed mono- and bi-allelic deletion of 13q14, results have been conflicting but it may correlate with a worse prognosis.9,10,39 Recently, the use of array-based karyotyping for CLL has highlighted length heterogeneity at the 13q14 locus.2,7 In addition, deletion of the second 13q14 allele often occurs with different break points on each chromosome 13, resulting in ‘regional copy number heterogeneity’ (Figure 4). Regional copy number heterogeneity has been reported by others,6,10 and is discussed in a recent editorial3; however, its clinical significance, if any, is still unknown. Candidate genes associated with tumor behavior at the 13q14 locus include RB1, ARL11, C13orf1, DLEU1, DLEU2, RCBTB1, SETDB2, TRIM13, as well as micro-RNAs mir-15and mir-16-1.14,15 It is possible that changes in specific gene dosage combinations are contributing to tumor behavior in CLL. Array-based karyotyping allows determination gene dosage at the 13q14 locus. Future directions of this project include correlation of atypical deletions, acquired UPD, and gene dosage with clinical outcome.
Conclusions
SNP array karyotyping is a cost-effective alternative to a FISH panel and conventional cytogenetics for prognostic assessment in CLL that is amenable to routine clinical use. We have shown that virtual karyotypes obtained with Affymetrix 250K Nsp arrays show adequate resolution for detection of clinically relevant copy number alterations in CLL patients. Furthermore, we have shown that virtual karyotyping with SNP arrays improves on resolution and breadth of coverage compared with conventional cytogenetics and FISH analysis. Our validation data showed that the 250K Nsp arrays have 98.5% concordance with CLL FISH panel results and detected additional lesions of clinical relevance at 17p, 11q22, and 13q14. Detection of acquired UPD is a distinct advantage of SNP array karyotyping over copy number only techniques. Furthermore, the use of array-based platforms is uncovering previously unknown genetic heterogeneity in regions of copy number gain/loss. Future studies are needed to determine the clinical relevance of these new findings.
Acknowledgements
We thank Joel Gradowski, M.D., and Steven H. Swerdlow, M.D., for contributing to discussion on the experimental design; Yuri Nikiforov, M.D., Ph.D., for providing reference DNA; Hina Naushad, M.D., and Qinglong Hu, M.D., for contributing CLL samples; the Clinical Genomics Facility at UPMC for processing samples; the clinical cytogenetics laboratories at UPMC and the University of Nebraska; and Lukasz Gondek, M.D., for discussions concerning data analysis.
Footnotes
Supplemental material for this article can be found on http://jmd.amjpathol.org.
Web Extra Material
References
- 1.Rozman C, Montserrat E. Chronic lymphocytic leukemia. NEJM. 1995;333:1052–1057. doi: 10.1056/NEJM199510193331606. [DOI] [PubMed] [Google Scholar]
- 2.Sargent R, Jones D, Abruzzo LV, Yao H, Bonderover J, Cisneros M, Wierda WG, Keating MJ, Luthra R. Customized oligonucleotide array-based comparative genomic hybridization as a clinical assay for genomic profiling of chronic lymphocytic leukemia. J Mol Diagn. 2009;11:25–34. doi: 10.2353/jmoldx.2009.080037. [DOI] [PMC free article] [PubMed] [Google Scholar]
- 3.Hagenkord JM, Chang CC. The rewards and challenges of array-based karyotyping for clinical oncology applications. Leukemia. 2009;23:829–833. doi: 10.1038/leu.2009.24. [DOI] [PubMed] [Google Scholar]
- 4.Tuna M, Knuutila S, Mills GB. Uniparental disomy in cancer. Trends Mol Med. 2009;15:120–128. doi: 10.1016/j.molmed.2009.01.005. [DOI] [PubMed] [Google Scholar]
- 5.Maciejewski JP, Tiu RV, O'Keefe C. Application of array-based whole genome scanning technologies as a cytogenetic tool in haematological malignancies. Br J Haematol. 2009;146:479–488. doi: 10.1111/j.1365-2141.2009.07757.x. [DOI] [PubMed] [Google Scholar]
- 6.Gunn SR, Mohammed MS, Gorre ME, Cotter PD, Kim J, Bahler DW, Preobrazhensky SN, Higgins RA, Bolla AR, Ismail SH, de Jong D, Eldering E, van Oers MHJ, Mellink CHM, Keating MJ, Schlette EJ, Abruzzo LV, Robetorye RS. Whole-genome scanning by array comparative genomic hybridization as a clinical tool for risk assessment in chronic lymphocytic leukemia. J Mol Diagn. 2008;10:442–451. doi: 10.2353/jmoldx.2008.080033. [DOI] [PMC free article] [PubMed] [Google Scholar]
- 7.Patel A, Kang SH, Lennon PA, Li YF, Rao PN, Abruzzo L, Shaw C, Chinault AC, Cheung SW. Validation of a targeted DNA microarray for the clinical evaluation of recurrent abnormalities in chronic lymphocytic leukemia. Am J Hematol. 2008;83:540–546. doi: 10.1002/ajh.21145. [DOI] [PubMed] [Google Scholar]
- 8.Schwaenen C, Nessling M, Wessendorf S, Salvi T, Wrobel G, Radlwimmer B, Kestler HA, Haslinger C, Stilgenbauer S, Dohner H, Bentz M, Lichter P. Automated array-based genomic profiling in chronic lymphocytic leukemia: development of a clinical tool and discovery of recurrent genomic alterations. Proc Natl Acad Sci USA. 2004;101:1039–1044. doi: 10.1073/pnas.0304717101. [DOI] [PMC free article] [PubMed] [Google Scholar]
- 9.Pfeifer D, Pantic M, Skatulla I, Rawluk J, Kreutz C, Martens UM, Fisch P, Timmer J, Veelken H. Genome-wide analysis of DNA copy number changes and LOH in CLL using high-density SNP arrays. Blood. 2007;109:1202–1210. doi: 10.1182/blood-2006-07-034256. [DOI] [PubMed] [Google Scholar]
- 10.Lehmann S, Ogawa S, Raynaud SD, Sanada M, Nannya Y, Ticchioni M, Bastard C, Kawamata N, Koeffler HP. Molecular allelokaryotyping of early-stage, untreated chronic lymphocytic leukemia. Cancer. 2008;112:1296–1305. doi: 10.1002/cncr.23270. [DOI] [PubMed] [Google Scholar]
- 11.Yamamoto G, Nannya Y, Kato M, Sanada M, Levine RL, Kawamata N, Hangaishi A, Kurokawa M, Chiba S, Gilliland DG, Koeffler HP, Ogawa S. Highly sensitive method for genomewide detection of allelic composition in nonpaired, primary tumor specimens by use of affymetrix single-nucleotide-polymorphism genotyping microarrays. Am J Hum Genet. 2007;81:114–126. doi: 10.1086/518809. [DOI] [PMC free article] [PubMed] [Google Scholar]
- 12.Jones AC, Austin J, Hansen N, Hoogendoorn B, Oefner PJ, Cheadle JP, O'Donovan MC. Optimal temperature selection for mutation detection by denaturing HPLC and comparison to single-stranded conformation polymorphism and heteroduplex analysis. Clin Chem. 1999;45:1133–1140. [PubMed] [Google Scholar]
- 13.Stilgenbauer S, Liebisch P, James MR, Schroder M, Schlegelberger B, Fischer K, Bentz M, Lichter P, Dohner H. Molecular cytogenetic delineation of a novel critical genomic region in chromosome bands 11q22.3–923.1 in lymphoproliferative disorders. Proc Natl Acad Sci USA. 1996;93:11837–11841. doi: 10.1073/pnas.93.21.11837. [DOI] [PMC free article] [PubMed] [Google Scholar]
- 14.Ouillette P, Erba H, Kujawski L, Kaminski M, Shedden K, Malek SN. Integrated genomic profiling of chronic lymphocytic leukemia identifies subtypes of deletion 13q14. Cancer Res. 2008;68:1012–1021. doi: 10.1158/0008-5472.CAN-07-3105. [DOI] [PubMed] [Google Scholar]
- 15.Cotter FE, Auer RL. Genetic alteration associated with chronic lymphocytic leukemia. Cytogenetic Genome Res. 2007;118:310–319. doi: 10.1159/000108315. [DOI] [PubMed] [Google Scholar]
- 16.Wong KB, DeDecker BS, Freund SM, Proctor MR, Bycroft M, Fersht AR. Hot-spot mutants of p53 core domain evince characteristic local structural changes. Proc Natl Acad Sci USA. 1999;96:8438–8442. doi: 10.1073/pnas.96.15.8438. [DOI] [PMC free article] [PubMed] [Google Scholar]
- 17.Saddler C, Ouillette P, Kujawski L, Shangary S, Talpaz M, Kaminski M, Erba H, Shedden K, Wang S, Malek SN. Comprehensive biomarker and genomic analysis identifies p53 status as the major determinant of response to MDM2 inhibitors in chronic lymphocytic leukemia. Blood. 2008;111:1584–1593. doi: 10.1182/blood-2007-09-112698. [DOI] [PubMed] [Google Scholar]
- 18.Bullrich F, Fujii H, Calin G, Mabuchi H, Negrini M, Pekarsky Y, Rassenti L, Alder H, Reed JC, Keating MJ, Kipps TJ, Croce CM. Characterization of the 13q14 tumor suppressor locus in CLL: identification of ALT1, an alternative splice variant of the LEU2 gene. Cancer Res. 2001;61:6640–6648. [PubMed] [Google Scholar]
- 19.Wolf S, Mertens D, Schaffner C, Korz C, Dohner H, Stilgenbauer S, Lichter P. B-cell neoplasia associated gene with multiple splicing (BCMS): the candidate B-CLL gene on 13q14 comprises more than 560 kb covering all critical regions. Hum Mol Genet. 2001;10:1275–1285. doi: 10.1093/hmg/10.12.1275. [DOI] [PubMed] [Google Scholar]
- 20.Migliazza A, Bosch F, Komatsu H, Cayanis E, Martinotti S, Toniato E, Guccione E, Qu X, Chien M, Murty VV, Gaidano G, Inghirami G, Zhang P, Fischer S, Kalachikov SM, Russo J, Edelman I, Efstratiadis A, Dalla-Favera R. Nucleotide sequence, transcription map, and mutation analysis of the 13q14 chromosomal region deleted in B-cell chronic lymphocytic leukemia. Blood. 2001;97:2098–2104. doi: 10.1182/blood.v97.7.2098. [DOI] [PubMed] [Google Scholar]
- 21.Hehir-Kwa JY, Egmont-Petersen M, Janssen IM, Smeets D, van Kessel AG, Veltman JA. Genome-wide copy number profiling on high-density bacterial artificial chromosomes, single-nucleotide polymorphisms, and oligonucleotide microarrays: a platform comparison based on statistical power analysis. DNA Res. 2007;14:1–11. doi: 10.1093/dnares/dsm002. [DOI] [PMC free article] [PubMed] [Google Scholar]
- 22.Stilgenbauer S, Sander S, Bullinger L, Benner A, Leupolt E, Winkler D, Krober A, Kienle D, Lichter P, Dohner H. Clonal evolution in chronic lymphocytic leukemia: acquisition of high-risk genomic aberrations associated with unmutated VH, resistance to therapy, and short survival. Haematologica. 2007;92:1242–1245. doi: 10.3324/haematol.10720. [DOI] [PubMed] [Google Scholar]
- 23.Zhu Y, Monni O, El-Rifai W, Siitonen SM, Vilpo L, Vilpo J, Knuutila S. Discontinuous deletions at 11q23 in B cell chronic lymphocytic leukemia. Leukemia. 1999;13:708–712. doi: 10.1038/sj.leu.2401405. [DOI] [PubMed] [Google Scholar]
- 24.Auer RL, Jones C, Mullenbach RA, Syndercombe-Court D, Milligan DW, Fegan CD, Cotter FE. Role for CCG-trinucleotide repeats in the pathogenesis of chronic lymphocytic leukemia. Blood. 2001;97:509–515. doi: 10.1182/blood.v97.2.509. [DOI] [PubMed] [Google Scholar]
- 25.Gunn S, Hibbard M, Ismail S, Lowery-Nordberg M, Mellink C, Bahler D, Abruzzo L, Enriquez E, Gorre M, Mohammed M, Robetorye R. Atypical 11q deletions identified by array CGH may be missed by FISH panels for prognostic markers in chronic lymphocytic leukemia. Leukemia. 2009;23:1011–1107. doi: 10.1038/leu.2008.393. [DOI] [PubMed] [Google Scholar]
- 26.Beroukhim R, Lin M, Park Y, Hao K, Zhao X, Garraway LA, Fox EA, Hochberg EP, Mellinghoff IK, Hofer MD, Descazeaud A, Rubin MA, Meyerson M, Wong WH, Sellers WR, Li C. Inferring loss-of-heterozygosity from unpaired tumors using high-density oligonucleotide SNP arrays. PLoS Comput Biol. 2006;2:e41. doi: 10.1371/journal.pcbi.0020041. [DOI] [PMC free article] [PubMed] [Google Scholar]
- 27.Huang J, Wei W, Zhang J, Liu G, Bignell GR, Stratton MR, Futreal PA, Wooster R, Jones KW, Shapero MH. Whole genome DNA copy number changes identified by high density oligonucleotide arrays. Hum Genomics. 2004;1:287–299. doi: 10.1186/1479-7364-1-4-287. [DOI] [PMC free article] [PubMed] [Google Scholar]
- 28.Ishikawa S, Komura D, Tsuji S, Nishimura K, Yamamoto S, Panda B, Huang J, Fukayama M, Jones KW, Aburatani H. Allelic dosage analysis with genotyping microarrays. Biochem Biophys Res Commun. 2005;333:1309–1314. doi: 10.1016/j.bbrc.2005.06.040. [DOI] [PubMed] [Google Scholar]
- 29.Lo KC, Bailey D, Burkhardt T, Gardina P, Turpaz Y, Cowell JK. Comprehensive analysis of loss of heterozygosity events in glioblastoma using the 100K SNP mapping arrays and comparison with copy number abnormalities defined by BAC array comparative genomic hybridization. Genes Chromosomes Cancer. 2008;47:221–237. doi: 10.1002/gcc.20524. [DOI] [PubMed] [Google Scholar]
- 30.Gondek LP, Tiu R, O'Keefe CL, Sekeres MA, Theil KS, Maciejewski JP. Chromosomal lesions and uniparental disomy detected by SNP arrays in MDS, MDS/MPD, and MDS-derived AML. Blood. 2008;111:1534–1542. doi: 10.1182/blood-2007-05-092304. [DOI] [PMC free article] [PubMed] [Google Scholar]
- 31.Bacolod MD, Schemmann GS, Giardina SF, Paty P, Notterman DA, Barany F. Emerging paradigms in cancer genetics: some important findings from high-density single nucleotide polymorphism array studies. Cancer Res. 2009;69:723–727. doi: 10.1158/0008-5472.CAN-08-3543. [DOI] [PMC free article] [PubMed] [Google Scholar]
- 32.Walsh CS, Ogawa S, Scoles DR, Miller CW, Kawamata N, Narod SA, Koeffler HP, Karlan BY. Genome-wide loss of heterozygosity and uniparental disomy in BRCA1/2-associated ovarian carcinomas. Clin Cancer Res. 2008;114:7645–7651. doi: 10.1158/1078-0432.CCR-08-1291. [DOI] [PMC free article] [PubMed] [Google Scholar]
- 33.Mao X, Young BD, Lu YJ. The application of single nucleotide polymorphism microarrays in cancer research. Curr Genomics. 2007;8:219–228. doi: 10.2174/138920207781386924. [DOI] [PMC free article] [PubMed] [Google Scholar]
- 34.Yin D, Ogawa S, Kawamata N, Tunici P, Finocchiaro G, Eoli M, Ruckert C, Huynh T, Liu G, Kato M, Sanada M, Jauch A, Dugas M, Black KL, Koeffler HP. High-resolution genomic copy number profiling of glioblastoma multiforme by single nucleotide polymorphism DNA microarray. Mol Cancer Res. 2009;7:665–677. doi: 10.1158/1541-7786.MCR-08-0270. [DOI] [PubMed] [Google Scholar]
- 35.Krober A, Seiler T, Benner A, Bullinger L, Bruckle E, Lichter P, Dohner H, Stilgenbauer S. V(H) mutation status, CD38 expression level, genomic aberrations, and survival in chronic lymphocytic leukemia. Blood. 2002;100:1410–1416. [PubMed] [Google Scholar]
- 36.McQuillan R, Leutenegger AL, Abdel-Rahman R, Franklin CS, Pericic M, Barac-Lauc L, Smolej-Narancic N, Janicijevic B, Polasek O, Tenesa A, Macleod AK, Farrington SM, Rudan P, Hayward C, Vitart V, Rudan I, Wild SH, Dunlop MG, Wright AF, Campbell H, Wilson JF. Runs of homozygosity in European populations. Am J Hum Genet. 2008;83:359–372. doi: 10.1016/j.ajhg.2008.08.007. [DOI] [PMC free article] [PubMed] [Google Scholar]
- 37.Bacolod MD, Schemmann GS, Wang S, Shattock R, Giardina SF, Zeng Z, Shia J, Stengel RF, Gerry N, Hoh J, Kirchhoff T, Gold B, Christman MF, Offit K, Gerald WL, Notterman DA, Ott J, Paty PB, Barany F. The signatures of autozygosity among patients with colorectal cancer. Cancer Res. 2008;68:2610–2621. doi: 10.1158/0008-5472.CAN-07-5250. [DOI] [PMC free article] [PubMed] [Google Scholar]
- 38.Dohner H, Stilgenbauer S, Benner A, Leupolt E, Krober A, Bullinger L, Dohner K, Bentz M, Lichter P. Genomic aberrations and survival in chronic lymphocytic leukemia. NEJM. 2000;343:1910–1916. doi: 10.1056/NEJM200012283432602. [DOI] [PubMed] [Google Scholar]
- 39.Chena C, Avalos JS, Bezares RF, Arrossagaray G, Turdo K, Bistmans A, Slavutsky I. Biallelic deletion 13q14.3 in patients with chronic lymphocytic leukemia: cytogenetic, FISH and clinical studies. Eur J Haematol. 2008;81:94–99. doi: 10.1111/j.1600-0609.2008.01086.x. [DOI] [PubMed] [Google Scholar]
Associated Data
This section collects any data citations, data availability statements, or supplementary materials included in this article.