

Abstract
We investigate several questions concerning the inference of the distribution of fitness effects (DFE) of new mutations from the distribution of nucleotide frequencies in a population sample. If a fixed sequencing effort is available, we find that the optimum strategy is to sequence a modest number of alleles (approx. 10). If full genome information is available, the accuracy of parameter estimates increases as the number of alleles sequenced increases, but with diminishing returns. It is unlikely that the DFE for single genes can be reliably estimated in organisms such as humans and Drosophila, unless genes are very large and we sequence hundreds or perhaps thousands of alleles. We consider models involving several discrete classes of mutations in which the selection strength and density apportioned to each class can vary. Models with three classes fit almost as well as four class models unless many hundreds of alleles are sequenced. Large numbers of alleles need to be sequenced to accurately estimate the distribution's mean and variance. Estimating complex DFEs may therefore be difficult. Finally, we examine models involving slightly advantageous mutations. We show that the distribution of the absolute strength of selection is well estimated if mutations are assumed to be unconditionally deleterious.
Keywords: mutation, selection, distribution of effects, parameter inference
1. Introduction
The effect of a new mutation is often classified as being deleterious, neutral or advantageous. However, in reality, mutations have a continuous distribution of fitness effects (DFE), ranging from lethal or very strongly deleterious, through to slightly deleterious, to neutral, slightly advantageous and strongly advantageous. The nature of this DFE of new mutations is central to many problems in genetics, including the maintenance of quantitative and molecular genetic variation (Charlesworth et al. 1995), the evolution of sex and recombination (Peck et al. 1997), the consequences of small population size (Schultz & Lynch 1997), the molecular clock (Ohta 1992) and the rate of genomic decay owing to Muller's ratchet (Loewe 2006). Brian Charlesworth has made a number of important contributions to the study of the DFE. He was the first to appreciate that the proportion of adaptive substitutions could be inferred by adapting the McDonald–Kreitman test (McDonald & Kreitman 1991; Charlesworth 1994). He was also one of the first to use the DFE in a population genetic analysis when he used parameter estimates from Mukai and Ohnishi's mutation accumulation experiments in Drosophila (Keightley 1994) to test whether background selection could explain how patterns of DNA diversity vary with the level of recombination in Drosophila (Charlesworth 1996). More recently, he has developed, with Laurence Loewe, a method to infer the DFE for deleterious mutations using DNA sequence data (Loewe et al. 2006).
To date, two approaches have been used to infer parameters of the DFE. ‘Direct’ methods estimate the fitness effects of new mutations induced or accumulated within organisms, and ‘indirect’ methods estimate the DFE from DNA sequence data (reviewed in Eyre-Walker & Keightley 2007). These two approaches are expected to yield information from different extremes of the spectrum of selective effects. Direct estimates from experiments to study induced or accumulated mutations are informative about mutations with relatively strong effects, whereas indirect approaches involving the analysis of DNA sequence data give us detailed information about relatively weakly selected mutations. In this paper, we investigate the information that can be gained about the DFE from an indirect approach.
DNA sequence data can be used in a number of ways to infer properties of the DFE. As the fate of a new mutation depends on the effective population size, Ne, contrasting patterns of substitution and/or polymorphism between species of different Ne can be used to infer the DFE (Eyre-Walker et al. 2002; Nielsen & Yang 2003; Loewe et al. 2006). Loewe and Charlesworth (Loewe & Charlesworth 2006; Loewe et al. 2006) have implemented this approach by fitting gamma and lognormal DFEs to the non-synonymous and synonymous diversity in two species of Drosophila that have different effective population sizes.
Alternative methods infer the DFE from the distribution of allele frequencies in polymorphism datasets (Eyre-Walker et al. 2006; Keightley & Eyre-Walker 2007; Boyko et al. 2008). These methods estimate the DFE by fitting a distribution of selective effects to the site frequency spectrum (SFS), i.e. the allele frequency distribution in a population sample. The data consist of SFSs for sets of sites under selection and neutral sites. The neutral site SFS is used to help estimate the population mutation rate and to control for the effects of demography. Three methods have been developed to infer the DFE from polymorphism data, which differ mainly in how they deal with the effects of demography. The methods of Keightley & Eyre-Walker (2007) and Boyko et al. (2008) estimate the DFE while simultaneously fitting a demographic model to the data, whereas the method of Eyre-walker et al. (2006) controls for demographic effects using a simple approximation. All three methods appear to give similar parameter estimates for most datasets. Recently, Eyre-Walker & Keightley (2009) have extended their method to estimate the proportion of adaptive substitutions by incorporating between-species divergence data (see also Boyko et al. 2008).
In developing the above approaches to estimate parameters of the DFE, simulations have been used to check the performance of the methods, including how well they perform when the data depart substantially from the model assumptions. For example, although all three methods assume that there is free recombination, simulations suggest that they are robust to substantial departures from free recombination, unless linkage is extremely tight (Boyko et al. 2008; Eyre-Walker & Keightley 2009). However, there are still a number of questions related to what information can be inferred about the DFE based on the distribution of allele frequencies. In the present paper, we shall use simulations to address some of these issues. First, we shall look at questions relating to how much and what type of data are required to infer the DFE. For example, we shall investigate whether it is better to sequence more loci from a small number of individuals, or sequence fewer loci from a greater number of individuals. We will then go onto to address a more subtle question: how much information can we gain about the extremes of the DFE based on DNA sequence data with a reasonable sequencing effort?
2. Material and methods
(a). Assumptions
We assume a random mating population of effective size Ne. We assume that there are Ls neutral and Ln selected unlinked nucleotide sites at mutation–selection–drift balance with up to two alleles segregating at each site. The mutation rate per site is defined by the parameter Neμ, which is assumed to be constant across neutral and selected sites. In the simulations, we assume a value for Neμ of 0.001. This would generate equilibrium autosomal diversity in a diploid of 4Neμ = 0.004, which is in the range of silent nucleotide diversity levels typical of human and Drosophila populations (Li & Stadler 1991; Cargill et al. 1999; Andolfatto 2001). In the analysis, and in most of the simulations, mutations at the selected sites are assumed to have deleterious additive effects such that the fitnesses of the three genotypes are 1, 1−s/2 and 1−s. Selective effects of mutations are measured as a product of the effective population size, as the effective population size and selection coefficient cannot be separately estimated. We investigated cases in which mutational effects are drawn from a gamma distribution with parameters scale α and shape β:
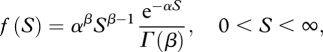 |
where S = 4Nes and Γ(β) is the gamma function.
We also investigated the effect on DFE parameter inference of advantageous mutations by simulating data under the ‘partially reflected’ distribution model of Piganeau & Eyre-Walker (2003). In this model, each site can be occupied by one of two alleles. One allele has an advantage of +s and the other allele has a disadvantage of −s. The probability density function of this partially reflected distribution is given by
Thus, for S → 0, the density of positive- and negative-effect mutations of equal absolute selective effects tends to equality. For large |S|, the density of advantageous mutations becomes very small relative to deleterious mutations of equivalent absolute effect.
(b). Generating the expected SFS
We used a simplified version of the method of Eyre-Walker et al. (2006; hereafter EWWP2006) based on equilibrium diffusion theory results to calculate the expected number of sites showing j derived single nucleotide polymorphisms (SNPs) in a sample of n alleles from the population. The vector of such expected numbers of sites is known as the expected SFS. This was used both to generate the simulated data and in parameter inference. We simplified the EWWP2006 model by ignoring the correction for demography, so terms rj in eqns (1) and (2) of EWWP2006 are set to 1. This greatly accelerated computations and allowed more simulations to be run. We used the GNU Scientific Library (http://www.gnu.org/software/gsl/) routines for numerical integration over allele frequency in evaluating eqn (1) of EWWP2006 and for integrating over the gamma distribution of selective effects. We also investigated a model with m discrete mutational effects, si, in which we evaluated the SFSs for each mutational effect and calculated a weighted selected SFS, where the weights are pi, and Σpi = 1.
(c). Simulated data
To generate simulated SFSs, we first generated expected SFSs for neutral and selected sites as described above, then sampled randomly from these. Let cs (cn) be the cumulative number of sites with alleles segregating in the expected neutral (selected) SFS. We generated a random Poisson deviate (x) with mean cs (cn), then randomly sampled x times from the neutral (selected) expected SFS in proportion to the relative frequencies of derived alleles numbers. The remaining Ls − x (or Ln − x) sites were therefore not segregating.
(d). Parameter inference
For a given set of parameter values (i.e. Neμ,  , β), we calculated the likelihood of the simulated neutral and selected SFSs using the expected SFSs, assuming that the numbers of SNPs in each frequency category are Poisson distributed about their expectation (eqn (6), EWWP2006). We used folded SFSs throughout, i.e. we assumed that the direction of each mutation was unknown. The overall log likelihood was the sum of the log likelihoods for the neutral and selected SFSs. We computed maximum likelihood (ML) estimates of the parameters using the simplex algorithm (Nelder & Mead 1965) as implemented in Press et al. (1992). This is different to the method described in EWWP2006, which used a Monte Carlo Markov chain to compute Bayesian parameter estimates.
We also considered inference of the DFE under a model with m discrete mutational effects classes in which the strength of selection and the proportion of density were parameters in the model; thus, the number of parameters to estimate is 2m, and as m increases the possibility of multiple maxima in the likelihood space increases. In order to search the parameter space under this model, we used 10 different simplex maximization runs with random starting values for si and pi (i.e. the starting value for Nesi was 1000u4, where u is uniformly distributed between 0 and 1, with the constraint that Nesi > 0.1, and the starting value for pi was uniformly distributed between 0 and 1, with the constraint that Σpi = 1). ML parameter estimates were obtained from the simplex run that gave the highest log likelihood. In test runs with 20 different sets of starting values, the same maxima were obtained as with 10 sets of starting values (data not shown).
We compared estimated (Xi) and true parameter values (Xtrue) in replicate simulations (of Nr runs, typically 100). We also calculated root mean squared error, r.m.s.e. = (Σ(Xi − Xtrue)2/Nr)1/2, which simultaneously measures the variability among parameter estimates (Xi) and bias. For a perfectly unbiased estimator, r.m.s.e. is equivalent to the standard deviation among estimates from a large sample of independent simulation runs. Fit was compared independently for the different parameters, although it should be noted that the parameter estimates may be correlated.
3. Results
(a). Fixed total sequencing effort
In a sequencing experiment, one is usually faced with the question of how sequencing effort should be divided between the number of alleles (n) sequenced and the length of those sequences (Ls and Ln). To investigate this, we held Ls and Ln constant but varied n. We investigated simulated parameter values in the range of those typically inferred for amino acid-changing mutations in humans and Drosophila under a gamma distribution of selective effects (Eyre-Walker et al. 2006; Loewe et al. 2006; Keightley & Eyre-Walker 2007; Boyko et al. 2008). Mean parameter estimates and r.m.s.e. for 100 replicate simulations in which n was varied from 4 to 128 with Lsn = Lnn = 4 × 10⁵ and 4 × 10⁶ are shown in tables 1 and 2, respectively. In cases with a total effort of 4 × 10⁵ sites, estimates of the arithmetic mean  are extremely noisy, and essentially meaningless, so are not shown. In these simulations, we also found that estimates of
  and β can be unstable, such that ML estimates of either parameter can apparently approach infinity (→ ∞). This behaviour seems to be connected with the presence of a ridge in the likelihood surface between
  and β. If there are few data, high values of
  coupled with low values of β can give similar likelihoods to low values of
  and high values of β. However, the results suggest that parameters are estimated most accurately, both in terms of proportional difference from their true means and r.m.s.e., for modest numbers of alleles sequenced. In the cases shown, about 10 alleles are close to the optimum. The results also suggest that β can be accurately estimated; however, even with large numbers of sites sequenced
  tends to be poorly estimated, particularly if the distribution of effects is strongly leptokurtic (table 2). The difficulty in accurately estimating the mean mutational effect has been noted previously, as standard errors have typically been very large (Keightley & Eyre-Walker 2007; Boyko et al. 2008). This arises because the arithmetic mean is strongly affected by extreme values.
Table 1.
Mean estimates and r.m.s.e. for β for a fixed experimental effort of 4 × 10⁵ alleles × sites. There were equal numbers of neutral and selected sites. Neμ = 0.001. Results for 100 replicates are reported. The numbers of simulation replicates for which the estimate of β → ∞ are shown in square brackets.
| no. alleles, n | no. sites, Ls and Ln | β | r.m.s.e. |
|---|---|---|---|
 = 100, β = 0.5 = 100, β = 0.5 | |||
| 4 | 100 000 | 0.59 | 0.47 |
| 6 | 66 666 | 0.50 | 0.21 |
| 8 | 50 000 | 0.51 | 0.12 |
| 10 | 40 000 | 0.50 | 0.19 |
| 16 | 25 000 | 0.54 | 0.22 |
| 32 | 12 500 | 0.54 | 0.28 |
| 64 | 6250 | 0.67 [11] | 0.59 |
| 128 | 3125 | 0.91 [6] | 1.83 |
 = 1000, β = 0.25 = 1000, β = 0.25 | |||
| 4 | 100 000 | 0.28 | 0.19 |
| 6 | 66 666 | 0.28 | 0.16 |
| 8 | 50 000 | 0.27 | 0.15 |
| 10 | 40 000 | 0.27 | 0.14 |
| 16 | 25 000 | 0.27 | 0.12 |
| 32 | 12 500 | 0.25 | 0.13 |
| 64 | 6250 | 0.61 [2] | 3.3 |
| 128 | 3125 | 0.40 [1] | 0.51 |
Table 2.
Mean parameter estimates and r.m.s.e. for a fixed experimental effort of 4 × 10⁶ alleles × sites. There were equal numbers of neutral and selected sites. Neμ = 0.001. Results for 100 replicates are reported. The numbers of simulation replicates for which the estimate of  → ∞ are shown in square brackets.
| no. alleles, n | no. sites, Ls and Ln |  |
r.m.s.e. | β | r.m.s.e. |
|---|---|---|---|---|---|
 = 100, β = 0.5 = 100, β = 0.5 | |||||
| 4 | 1 000 000 | 323 | 1730 | 0.51 | 0.10 |
| 6 | 666 667 | 132 | 98 | 0.50 | 0.076 |
| 8 | 500 000 | 119 | 69 | 0.50 | 0.061 |
| 10 | 400 000 | 117 | 58 | 0.50 | 0.061 |
| 16 | 250 000 | 117 | 84 | 0.50 | 0.061 |
| 32 | 125 000 | 114 | 43 | 0.50 | 0.058 |
| 64 | 62 500 | 115 | 59 | 0.51 | 0.072 |
| 128 | 31 250 | 118 | 97 | 0.51 | 0.089 |
 = 1000, β = 0.25 = 1000, β = 0.25 | |||||
| 4 | 1 000 000 | 29 985 | 121 280 [13] | 0.24 | 0.088 |
| 6 | 666 667 | 47 418 | 439 737 [1] | 0.26 | 0.055 |
| 8 | 500 000 | 15 030 | 90 431 | 0.24 | 0.051 |
| 10 | 400 000 | 5619 | 34 217 | 0.25 | 0.048 |
| 16 | 250 000 | 8558 | 34 479 | 0.25 | 0.045 |
| 32 | 12 500 | 2932 | 7392 | 0.25 | 0.044 |
| 64 | 62 500 | 6027 | 19 871 | 0.25 | 0.053 |
| 128 | 31 250 | 21 099 | 119 176 | 0.25 | 0.056 |
(b). Increasing the number of alleles sequenced
We then investigated simulations in which the number of individuals sequenced is increased, but Ls and Ln are constant (tables 3 and 4). Table 3 is intended to represent the case of whole genome sequence data (i.e. very large number of sites sequenced per individual). Capturing the genomes of large numbers of individuals is now feasible using high throughput sequencing technologies. The results (table 3) suggest that  and β estimates are close to unbiased unless the number of alleles sequenced is small, in which case the upwards bias previously noted is manifest. As expected, r.m.s.e. drops as the number of alleles sequenced increases. However, the rate of decline of r.m.s.e. for both
  and β is less than linear with sqrt(n).
Table 3.
Mean parameter estimates and r.m.s.e. for a sequencing effort of 1 000 000 sites per individual. The numbers of simulation replicates for which the estimate of  →∞ are shown in square brackets.
| no. alleles, n |  |
r.m.s.e. | β | r.m.s.e. |
|---|---|---|---|---|
 = 100, β = 0.5 = 100, β = 0.5 | ||||
| 4 | 221 | 435 | 0.49 | 0.10 |
| 6 | 118 | 62 | 0.50 | 0.057 |
| 8 | 118 | 54 | 0.49 | 0.054 |
| 10 | 106 | 28 | 0.50 | 0.035 |
| 16 | 101 | 19 | 0.50 | 0.026 |
| 32 | 100 | 14 | 0.50 | 0.023 |
| 64 | 101 | 9.3 | 0.50 | 0.016 |
| 128 | 101 | 7.4 | 0.50 | 0.016 |
 = 1000, β = 0.25 = 1000, β = 0.25 | ||||
| 4 | 155 327 | 910 350 [4] | 0.27 | 0.094 |
| 6 | 12 231 | 59 839 [1] | 0.25 | 0.051 |
| 8 | 2478 | 4905 | 0.24 | 0.033 |
| 10 | 1272 | 1132 | 0.25 | 0.025 |
| 16 | 1498 | 1621 | 0.25 | 0.024 |
| 32 | 1128 | 561 | 0.25 | 0.016 |
| 64 | 1093 | 273 | 0.25 | 0.011 |
| 128 | 1040 | 238 | 0.25 | 0.010 |
Table 4.
Mean parameter estimates and r.m.s.e. for a sequencing effort of 5000 sites per individual.  = 100, β = 0.5 and θ = 0.004. The numbers of simulation replicates for which the estimate of β → ∞ are shown in square brackets.
| no. alleles, n | β | r.m.s.e. |
|---|---|---|
| 8 | 1.3 [18] | 4.0 |
| 16 | 0.70 [6] | 1.2 |
| 32 | 0.59 [6] | 0.51 |
| 64 | 0.70 [1] | 0.59 |
| 128 | 0.70 [5] | 0.68 |
| 256 | 0.64 [3] | 0.52 |
We then addressed the question of the amount of information on the DFE that can be obtained by analysing polymorphism data from one gene or a small number of genes. To do this, we simulated cases in which the numbers of selected and neutral sites (Ln and Ls) are relatively small. In simulations with Neμ = 0.001 and Ls = Ln = 1000, which would represent the number of amino acid sites in a gene of typical length, parameter estimates were essentially uninformative, even for very large numbers of alleles sequenced (results not shown). For Ls = Ln = 5000, which would represent the number of sites in a large gene or a small group of average-sized genes, a sample size of at least 200 alleles appears to be needed to obtain close to unbiased estimates of β and reasonable precision (table 4). However, estimates of  are noisy and upwardly biased (results not shown), implying that much larger numbers of sites are apparently needed in order to obtain good estimates.
(c). Alternative models to the gamma distribution
Previous analysis to infer the DFE using the SFSs for humans and Drosophila have focused on estimating parameters of certain distributions of effects (e.g. a gamma distribution or a lognormal distribution). However, the true DFE is certain to be different from the distribution assumed. For example, the true distribution may have multiple modes. A potentially more flexible way of performing such an analysis is to estimate the effects and relative frequencies of a number of discrete classes of mutational effects in the model. We investigated the behaviour of models of this kind by simulating data under the gamma distribution of mutational effects, then analysing the data under the assumption of m discrete classes of effects. We computed the mean log likelihood difference from the best-fitting model. As expected, this was always the model with the highest number of effects classes (table 5). For datasets with many hundreds of alleles, an appreciable improvement in fit was apparent by changing from a three- to a four-effects model. We also computed the estimated mean and mean-squared mutational effect and compared these with expectation. The results suggest that upwards of 1000 alleles are required to obtain accurate estimates of the mean effect (table 5). To estimate the mean-squared effect, an even higher numbers of alleles would be needed (table 5).
Table 5.
Analyses assuming m mutation effects classes. Parameter values: β = 0.5,  = 100. Results are the mean of 20 simulation runs. There were 106 neutral and selected sites simulated. Some runs contained replicates that produced unstable numerical behaviour, and would not converge; such estimates are marked ‘—’.
| no. of effects, m |
||||||||
|---|---|---|---|---|---|---|---|---|
| no. alleles, n | 1 | 2 | 3 | 4 | ||||
| mean log likelihood difference from best-fitting model | ||||||||
| 16 | −704 | −0.9 | −0.0 | 0 | ||||
| 64 | −1563 | −6.9 | −0.1 | 0 | ||||
| 256 | −2034 | −28 | −0.7 | 0 | ||||
| 1024 | −2401 | −60 | −2.8 | 0 | ||||
| no. of effects, m | ||||||||
| 1 | 2 | 3 | 4 | |||||
| no. alleles, n |  |
r.m.s.e. |  |
r.m.s.e. |  |
r.m.s.e. |  |
r.m.s.e. |
estimates of  . The true value is 100 . The true value is 100 | ||||||||
| 16 | 3.87 | 96 | 30.3 | 70 | — | — | — | — |
| 64 | 3.63 | 96 | 36.3 | 64 | — | — | — | — |
| 256 | 3.57 | 96 | 43.3 | 57 | 82.3 | 33 | — | — |
| 1024 | 3.59 | 96 | 47.1 | 53 | 76.9 | 26 | 99.7 | 22 |
| no. of effects, m | ||||||||
| 1 | 2 | 3 | 4 | |||||
| no. alleles, n | NeE(s2) | r.m.s.e. | NeE(s2) | r.m.s.e. | NeE(s2) | r.m.s.e. | NeE(s2) | r.m.s.e. |
| estimates of NeE(s2). The true value is 30 000 | ||||||||
| 16 | 15.0 | 29 985 | 1087 | 28 913 | — | — | — | — |
| 64 | 13.2 | 29 986 | 1586 | 28 414 | — | — | — | — |
| 256 | 12.7 | 29 987 | 2339 | 27 661 | 14 946 | 21 668 | — | — |
| 1024 | 12.9 | 29 987 | 2822 | 27 179 | 10 549 | 19 889 | 30 834 | 26 248 |
Under the gamma distribution considered above, all mutations are assumed to be deleterious. However, some mutations may have very slightly deleterious effects and it is therefore probable that there will also be a class of slightly advantageous mutations. There is some empirical evidence for this. There is evidence that species that have apparently increased in population size tend to show an increase in their evolutionary rate, which is consistent with the presence of slightly advantageous mutations (Charlesworth & Eyre-Walker 2007). Does the presence of slightly advantageous mutations radically change our ability to estimate the DFE for deleterious mutations? To investigate this, we simulated data based on the method of EWWP2006 while including advantageous mutations under a partially reflected gamma distribution (Piganeau & Eyre-Walker 2003), and inferred the distribution under the standard gamma distribution (table 6). Under the partially reflected gamma model, it is assumed that each site can be occupied by one of two alleles; an advantageous mutation of selection strength +s, and a deleterious mutation of selection strength −s. If we assume that the absolute strength of selection is gamma distributed, the realized distribution becomes partially reflected around the y-axis. Sites in which Ne|s| ≪ 1 are equally likely to produce advantageous or deleterious mutations, whereas sites in which Ne|s| ≫ 1 only generate deleterious mutations because the site is always occupied by the advantageous allele. Sites with Ne|s| ≈ 1 largely produce deleterious mutations, but have some advantageous mutations. Our results suggest that the presence of slightly advantageous mutations does not greatly affect the estimates of the DFE, particularly if at least modest numbers of alleles are sampled (8 or greater). Under these conditions, both the shape and the mean effect are well estimated, so the distribution of the absolute strength of selection is well estimated.
Table 6.
Mean parameter estimates and r.m.s.e. for the case of a partially reflected gamma distribution simulated, with the unreflected distribution assumed in the analysis.  = 100, β = 0.5, and there was a sequencing effort of 106 sites per individual assumed.
| no. alleles, n |  |
r.m.s.e. | β | r.m.s.e. |
|---|---|---|---|---|
| 4 | 156 | 184 | 0.49 | 0.094 |
| 6 | 137 | 76 | 0.47 | 0.065 |
| 8 | 125 | 47 | 0.47 | 0.052 |
| 10 | 117 | 38 | 0.47 | 0.042 |
| 32 | 109 | 16 | 0.48 | 0.028 |
| 64 | 108 | 13 | 0.48 | 0.026 |
| 128 | 107 | 12 | 0.48 | 0.025 |
4. Discussion
We have considered a number of issues concerning estimation of the DFE based on information in the SFS of polymorphism data. We first considered cases where the distribution simulated and the distribution assumed in the analysis were both gamma distributions. It is evident that sequencing a modest number of alleles is optimal. Thus, under a fixed sequencing effort, it is best to obtain as large an amount of sequence as possible in a modest number of alleles. The shape parameter of the distribution requires smaller sample sizes to be accurately estimated than the mean of the distribution, particularly if the distribution is leptokurtic. If a fixed amount of sequence per allele can be obtained, the accuracy of parameter estimates increases with diminishing returns as a function of the number of alleles sequenced. If the true distribution is highly leptokurtic, it may be necessary to sequence many tens of alleles to obtain unbiased, accurate estimates of the mean of the distribution. Unfortunately, estimating the DFE for individual genes seems difficult. We simulated data with a population mutation rate, θ, of 0.004, which is about four times higher than in human populations (Li & Stadler 1991; Cargill et al. 1999), and a few-fold lower than Drosophila (Andolfatto 2001). For sequences of length 1000 bp, the method gave essentially meaningless estimates. With a sequence of 5000 bp, we could obtain meaningful estimates, but only if 256 alleles and above are sequenced. Given that the average gene length is approximately 1300 bp in humans (International Human Genome Sequencing Consortium 2001) and approximately 1800 bp in Drosophila (Adams et al. 2000), this shows that it will generally be difficult to obtain gene-specific estimates of the DFE in humans, but this may be possible for longer genes in Drosophila if sufficient alleles are sequenced.
The DFE is often modelled using a simple distribution, such as the gamma distribution (Keightley 1994; Piganeau & Eyre-walker 2003; Eyre-Walker et al. 2006; Loewe et al. 2006; Keightley & Eyre-Walker 2007; Boyko et al. 2008) or the lognormal distribution (Loewe & Charlesworth 2006). However, in reality, the distribution is likely to be more complex than these simple distributions, and may even be multimodal (Eyre-Walker & Keightley 2007). It is therefore desirable to try to fit distributions of arbitrary complexity. We can envisage a number of ways of doing this. One possibility is to fit a ‘stepped distribution’ in which the x-axis is subdivided into a number of separate portions containing uniform density of Nes within each portion. The boundaries between portions and probability densities associated with each portion could be estimated in the model. For the present paper, we have instead chosen to investigate a more simple ‘spike model’ in which we modelled the DFE as a series of spikes with the positions and associated probability densities of each spike free to vary. For m spikes, there are therefore 2m − 1 parameters used to model the DFE. Our results suggest that if the true distribution is a gamma distribution, unless very large numbers of alleles are sequenced (i.e. >1000), a three-spike model generally fits the data nearly as well as a four-spike model (i.e. there is little improvement in likelihood). However, we also found that estimates of mean and mean-squared effect are biased downwards, unless the number of alleles sequenced is very large. This implies that sequencing small numbers of alleles does not adequately capture the properties of the distribution. Although we have attempted to fit this model to multimodal distributions, our results also suggest that very large amounts of data will be needed to estimate complex DFEs. Furthermore, if there is an appreciable proportion of mutations with large Nes values in the distribution, any model, including the spike model or the gamma distribution, is not expected to capture these, unless the number of alleles sequenced is very large, because such mutations have a very low probability of segregating in a sample of DNA sequences.
In estimating the DFE from DNA sequence data, it is often assumed that mutations are unconditionally deleterious. However, in reality, it is probable that there is a balance between slightly advantageous and deleterious mutations, and there is some empirical evidence for the presence of slightly advantageous mutations (Charlesworth & Eyre-Walker 2007). We have evaluated a model involving a partially reflected distribution that generates a balance between slightly advantageous and deleterious mutations. If we simulate data under a model in which there are both slightly deleterious and slightly advantageous mutations, and estimate the DFE under the assumption that there are only deleterious mutations in the model, estimates of the DFE are similar to the distributions of the absolute strength of selection. This implies that the presence of slightly advantageous mutations does not strongly affect estimates of the DFE. This is because strongly advantageous mutations (Nes ≫ 1) are very rare under the partially reflected gamma distribution and do not contribute substantially to polymorphism, very weakly selected mutations (Nes ≪ 1) behave as effectively neutral, and only slightly advantageous mutations (Nes ≈ 1) contribute to the SFS in a way that is different from deleterious mutations. Hence, the SFS under the partially reflected gamma distribution tends to be quite similar to that under the standard gamma distribution in which mutations are assumed to be unconditionally deleterious.
Overall, our simulation results suggest that whole-genome polymorphism data should make it possible to infer accurate information about the DFE for certain classes of sites, such as non-synonymous sites of protein-coding genes. Our results also illustrate the limitations of such an endeavour. Inferring complex distributions and the DFE for single genes appear to be difficult propositions, although the former may be aided by sequencing samples of very large number of alleles. Sequencing of thousands, or perhaps tens of thousands, of alleles will soon become feasible via high throughput technologies. The information gained about the DFE is likely to be important in understanding the genetic basis of fitness and other quantitative traits.
Acknowledgements
We thank two anonymous referees, Laurence Loewe and Bill Hill, for constructive criticism and the BBSRC for financial support.
Footnotes
One contribution of 16 to a Theme Issue ‘The population genetics of mutations: good, bad and indifferent’ dedicated to Brian Charlesworth on his 65th birthday.
References
- Adams M. D., et al. 2000The genome sequence of Drosophila melanogaster. Science 287, 2185–2195 (doi:10.1126/science.287.5461.2185) [DOI] [PubMed] [Google Scholar]
- Andolfatto P.2001Contrasting patterns of X-linked and autosomal nucleotide variation in Drosophila melanogaster and Drosophila simulans. Mol. Biol. Evol. 18, 279–290 [DOI] [PubMed] [Google Scholar]
- Boyko A. R., et al. 2008Assessing the evolutionary impact of amino acid mutations in the human genome. PLoS Genet. 4, e1000083 (doi:10.1371/journal.pgen.1000083) [DOI] [PMC free article] [PubMed] [Google Scholar]
- Cargill M., et al. 1999Characterization of single-nucleotide polymorphisms in coding regions of human genes. Nat. Genet. 22, 231–238 (doi:10.1038/10290) [DOI] [PubMed] [Google Scholar]
- Charlesworth B.1994The effect of background selection against deleterious mutations on weakly selected, linked variants. Genet. Res. 63, 213–227 (doi:10.1017/S0016672300032365) [DOI] [PubMed] [Google Scholar]
- Charlesworth B.1996Background selection and patterns of genetic diversity in Drosophila melanogaster. Genet. Res. 68, 131–149 (doi:10.1017/S0016672300034029) [DOI] [PubMed] [Google Scholar]
- Charlesworth J., Eyre-Walker A.2007The other side of the nearly neutral theory, evidence of slightly advantageous back-mutations. Proc. Natl Acad. Sci. USA 104, 16 992–16 997 (doi:10.1073/pnas.0705456104) [DOI] [PMC free article] [PubMed] [Google Scholar]
- Charlesworth D., Charlesworth B., Morgan M. T.1995The pattern of neutral molecular variation under the background selection model. Genetics 141, 1619–1632 [DOI] [PMC free article] [PubMed] [Google Scholar]
- Eyre-Walker A., Keightley P. D.2007The distribution of fitness effects of new mutations. Nature Rev. Genet. 8, 610–618 (doi:10.1038/nrg2146) [DOI] [PubMed] [Google Scholar]
- Eyre-Walker A., Keightley P. D.2009Estimating the rate of adaptive molecular evolution in the presence of slightly deleterious mutations and population size change. Mol. Biol. Evol. 26, 2097–2108 (doi:10.1093/molbev/msp119) [DOI] [PubMed] [Google Scholar]
- Eyre-Walker A., Keightley P. D., Smith N. G. C., Gaffney D.2002Quantifying the slightly deleterious model of molecular evolution. Mol. Biol. Evol. 19, 2142–2149 [DOI] [PubMed] [Google Scholar]
- Eyre-Walker A., Woolfit M., Phelps T.2006The distribution of fitness of new deleterious amino acid mutations in humans. Genetics 173, 891–900 (doi:10.1534/genetics.106.057570) [DOI] [PMC free article] [PubMed] [Google Scholar]
- International Human Genome Sequencing Consortium 2001Initial sequencing and analysis of the human genome. Nature 409, 860–921 (doi:10.1038/35057062) [DOI] [PubMed] [Google Scholar]
- Keightley P. D.1994The distribution of mutational effects on viability in Drosophila melanogaster. Genetics 138, 1315–1322 [DOI] [PMC free article] [PubMed] [Google Scholar]
- Keightley P. D., Eyre-Walker A.2007Joint inference of the distribution of fitness effects of deleterious mutations and population demography based on nucleotide polymorphism frequencies. Genetics 177, 2251–2261 (doi:10.1534/genetics.107.080663) [DOI] [PMC free article] [PubMed] [Google Scholar]
- Li W.-H., Stadler L. A.1991Low nucleotide diversity in man. Genetics 129, 513–523 [DOI] [PMC free article] [PubMed] [Google Scholar]
- Loewe L.2006Quantifying the the genomic decay paradox due to Muller's ratchet in human mitochondrial DNA. Genet. Res. 87, 133–159 (doi:10.1017/S0016672306008123) [DOI] [PubMed] [Google Scholar]
- Loewe L., Charlesworth B.2006Inferring the distribution of mutational effects on fitness in Drosophila. Biol. Lett. 2, 426–430 (doi:10.1098/rsbl.2006.0481) [DOI] [PMC free article] [PubMed] [Google Scholar]
- Loewe L., Charlesworth B., Bartolomé C., Nöel V.2006Estimating selection on non-synonymous mutations. Genetics 172, 1079–1092 (doi:10.1534/genetics.105.047217) [DOI] [PMC free article] [PubMed] [Google Scholar]
- McDonald J. H., Kreitman M.1991Adaptive evolution at the Adh locus in Drosophila. Nature 351, 652–654 (doi:10.1038/351652a0) [DOI] [PubMed] [Google Scholar]
- Nelder J. A., Mead R.1965A simplex method for function minimization. Comput. J. 7, 308–313 [Google Scholar]
- Nielsen R., Yang Z.2003Estimating the distribution of selection coefficients from phylogenetic data with applications to mitochondrial and viral DNA. Mol. Biol. Evol. 20, 1231–1239 (doi:10.1093/molbev/msg147) [DOI] [PubMed] [Google Scholar]
- Ohta T.1992The nearly neutral theory of molecular evolution. Ann. Rev. Ecol. Syst. 23, 263–286 (doi:10.1146/annurev.es.23.110192.001403) [Google Scholar]
- Peck J. R., Barreau G., Heath S. C.1997Imperfect genes, Fisherian mutation and the evolution of sex. Genetics 145, 1171–1199 [DOI] [PMC free article] [PubMed] [Google Scholar]
- Piganeau G., Eyre-Walker A.2003Estimating the distribution of fitness effects from DNA sequence data, implications for the molecular clock. Proc. Natl Acad. Sci. USA 100, 10 335–10 340 (doi:10.1073/pnas.1833064100) [DOI] [PMC free article] [PubMed] [Google Scholar]
- Press W. H., Teukolsky S. A., Vetterling W. T., Flannery B. P.1992Numerical recipes in C, 2nd edn Cambridge, UK: Cambridge University Press [Google Scholar]
- Schultz S. T., Lynch M.1997Mutation and extinction: the role of variable mutational effects, synergistic epistasis, beneficial mutations and degree of outcrossing. Evolution 51, 1363–1371 (doi:10.2307/2411188) [DOI] [PubMed] [Google Scholar]